Latest Jets Results from the Tevatron at
Latest jet results from the Tevatron are presented in this conference note. These are namely: new results on central inclusive jet production using both cone and algorithms, measurement of decorrelation in azimuthal angle between the two jets with the highest transverse momenta, and study of jet shapes. Results are based on data collected in collisions at in the years 2001-2004. Depending on the analysis, integrated luminosity of the sample was up to .
Producing events with high transverse momenta () jets we probe properties of matter and space at very short distances. At the Fermilab Tevatron, jets are being produced with up to about which corresponds to distances about thousand times smaller than the proton size. Up to this scale, the Tevatron high jet data provide tests of our understanding of proton structure and strong force that acts between proton constituents: quarks and gluons. Another aspect of the Tevatron jet physics program is the detailed study of jet properties and understanding these properties within the framework of perturbative Quantum Chromodynamics (pQCD). These studies have direct impact on many non-QCD analyzes that work with jets. In addition, strong interaction induced processes provide unavoidable background for these analyzes in hadron-hadron colliders. Better understanding of QCD processes thus improve our chances for discovery of potential signals of new physics.
To the first category of high jet program belong updated results on central jet inclusive spectra both from the CDF and the DØ Collaborations. Second category is represented by the DØ measurement of dijet azimuthal decorrelations, study of jet shapes by CDF, and the CDF measurement of inclusive jet spectra using algorithm with different sizes of jets.
The analyzes presented in this talk are based on data collected with CDF and DØ detectors in Run II of the Tevatron. This period started in year 2001 after upgrade of collider and both detectors. The Tevatron delivers now proton antiproton collisions at while in previous run (Run I) it was . Also Tevatron luminosity was increased significantly. Both aspects of collider upgrade affected high jet physics. Due to them, both experiments already collected about one order of magnitude more events with high jets than in Run I.
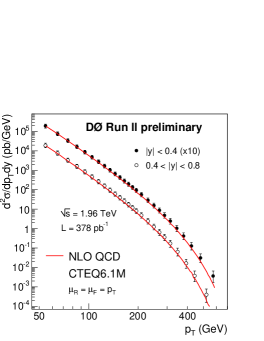
The CDF and DØ Collaborations measured inclusive production of central jets. DØ performed the measurement in two rapidity bins: and (rapidity is defined as , where is jet energy and is jet longitudinal momentum along the beam axis). The measurement was based on of data. Jets were reconstructed using iterative seed-based cone algorithm (including midpoints) with radius . Jet energies where calibrated using sample. Uncertainty on jet energy was found to be between 4-5%, for jet energies between -, and about 6% at . It translates to about 25% (30%, 60%) error on jet production cross section for (, ). Results of the measurement are shown in Fig. 2. The error on jet cross section was dominated by the uncertainty on jet energy calibration.
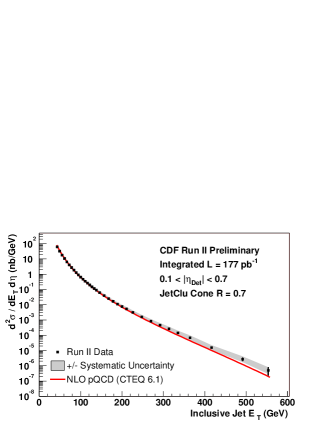
CDF performed the measurement for jets with where is jet pseudorapidity (, where is jet polar angle measured from the beam axis). In this case, jets where reconstructed with CDF Run I cone algorithm with radius . Measurement was based on of data. Final result is shown in Fig. 2. Systematic error is again dominated by the uncertainty of jet energy calibration which was about 3%. CDF calibrated their jet energies using calorimeter electron and hadronic responses measured during testbeam.
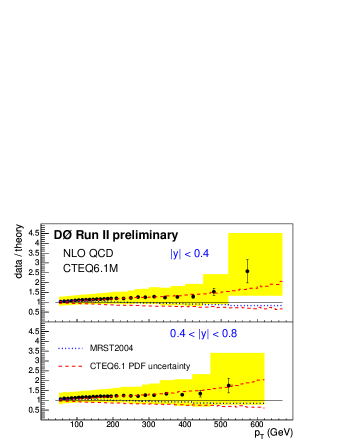
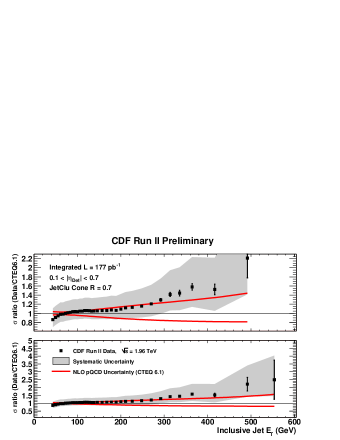
CDF and DØ results were compared with next-to-leading (NLO) QCD predictions. In both cases, a good agreement was observed over the entire region of jet (from up to about ) in which the cross section is rapidly falling down by 8 orders of magnitude. More detailed comparison with NLO QCD prediction is given in Fig. 4 (DØ) and Fig. 4 (CDF). CTEQ6.1M and MRST2004 parton distribution functions (PDF) where used in the NLO QCD calculations. Both sets of PDF lead to similar predictions. Data are sensitive to running of strong coupling and also to proton structure functions. At high , theoretical uncertainty is dominated by the uncertainty on gluon distribution function at high (where is fraction of proton momentum carried by gluon).
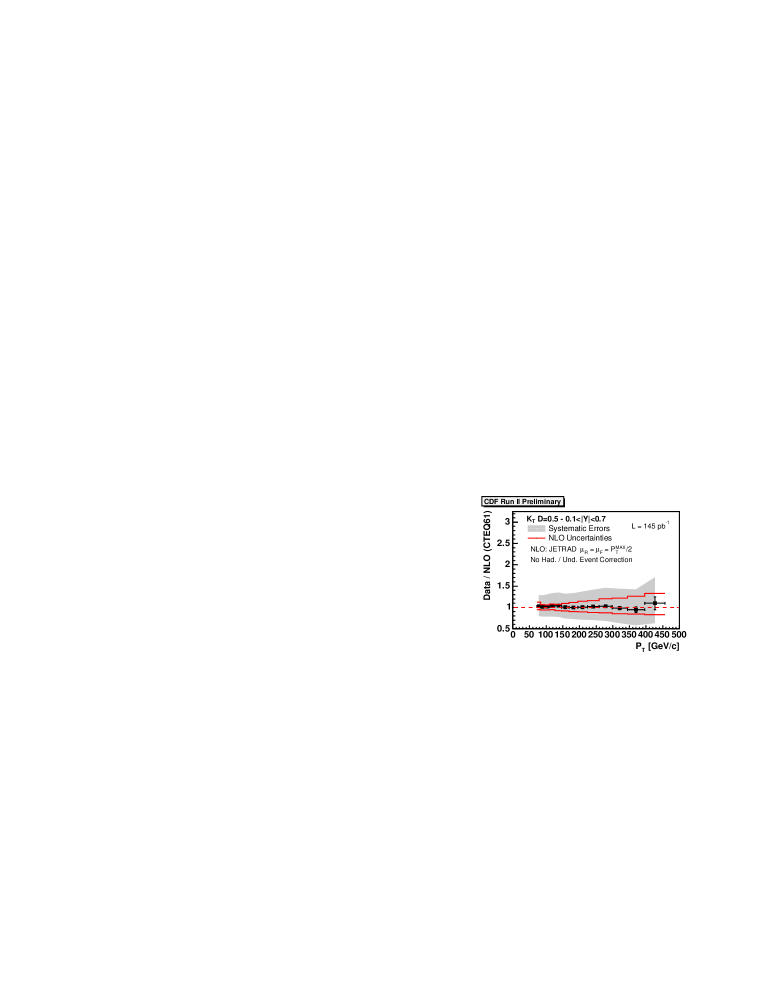
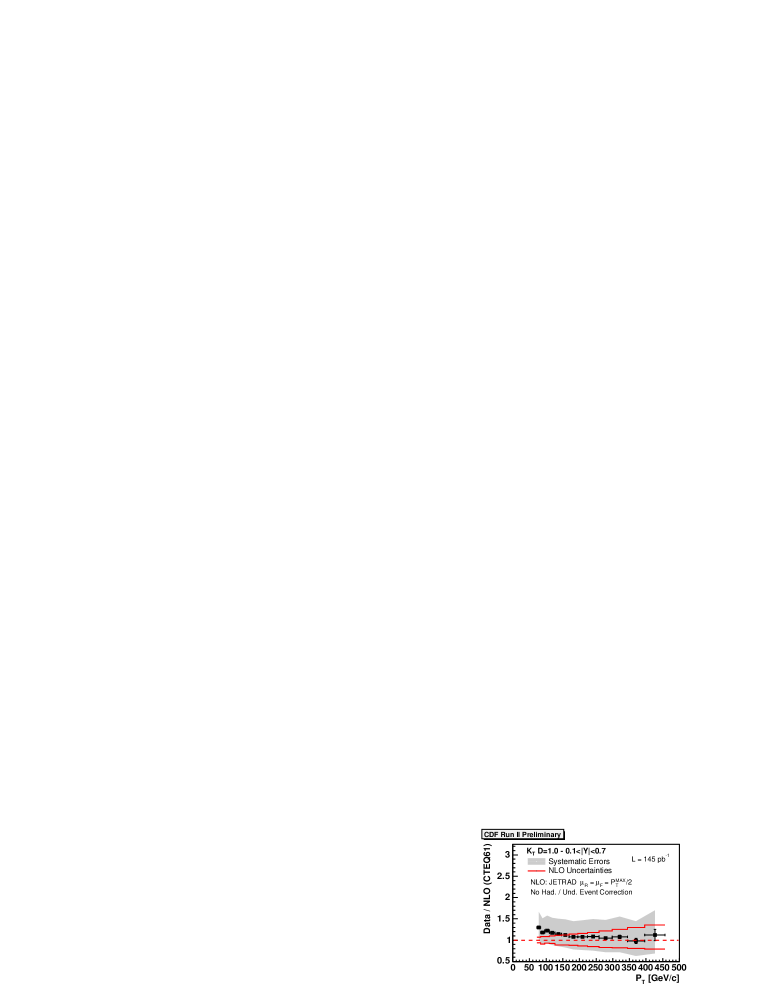
The CDF Collaboration also studied central jet production for jets reconstructed with -algorithm. CDF used Ellis-Sopper version of -algorithm adapted for hadron-hadron colliders. In this case, the et size is controlled by the parameter . Obtained jet cross section for and its comparison with NLO QCD predictions lead to the same conclusions as in the case of cone jets. CDF performed the measurement for three different sizes of jets (, 0.7, and 1.0). For , there was, with respect to NLO QCD, no difference between them. At low end, observed jet production is higher above the NLO QCD prediction for higher values of (see Fig. 5). The results suggest that the larger jets are more sensitive to hadronization effects and/or to the soft underlying event physics.
DØ studied radiative processes in QCD by examining their impact on angular distributions. DØ measured the distribution of azimuthal angle between two jets with highest , . Second leading jet was required to have , and both leading jets were required to have rapidity . Measurement was performed in four bins of leading jet transverse momentum . Fully corrected distribution of dijet azimuthal angle is presented in Fig. 7. As the data show, decorrelations increase with decrease of .
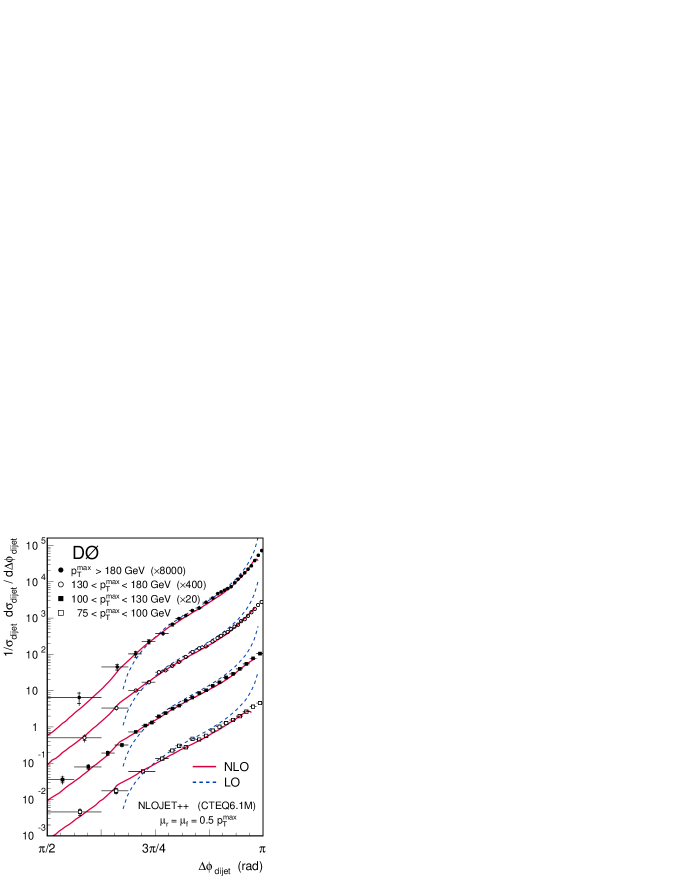
The first non-trivial description of distribution is in pQCD given by the tree level parton matrix element. The limitations of this leading order (LO) prediction are apparent (see dashed line in Fig. 7). With three partons, it is imposible to produce final state with . NLO calculations, obtained with NLOJET++ , provide much better agreement with data in much wider range of . However, in the region where , any fixed order pQCD calculations become unreliable. Resummations of soft parton emissions in all orders of pQCD are needed in order to describe this region properly.
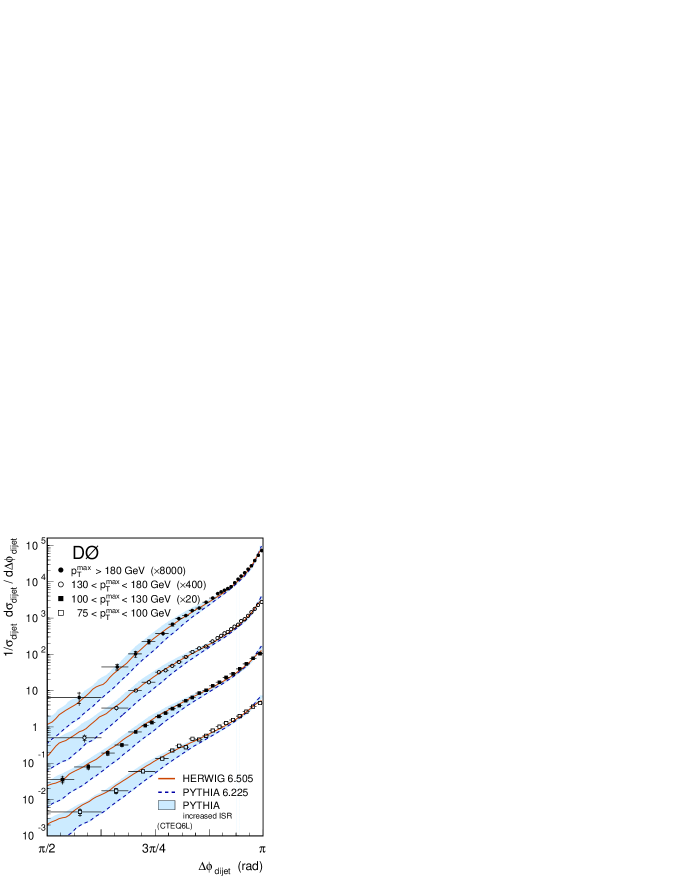
General purpose Monte Carlo (MC) generators, like Herwig or pythia , provide such resummations in the so called leading logarithm approximation through the developement of parton showers. Dijet azimuthal decorrelations are then sensitive to the details of the parton shower mechanism. Comparison between data and MC generator predictions is given in Fig. 7. herwig provides good desciption of the data in the whole range of , while pythia gives much smaller decorrelations than observed in the data. We found that pythia predictions were sensitive to the parameters of initial-state parton shower (ISR). Shaded region in Fig. 7 indicates the changes in azimuthal decorrelations as the maximal allowed virtuality of partons in the shower is increased from its default value by factor of four.
Another way how to study the effects of multiparton radiation is to examine an energy deposition within a jet, so called jet shapes. CDF measured averaged deposition of transverse momentum as a function of distance from jet exis:
| (1) |
where is jet transverse momentum deposited in cone with radius . Measurement was performed for the central rapidity jets in wide range of . Jets were reconstructed with midpoint cone algorithm with cone size . An example of jet shape measurement in one low- bin is given in Fig. 9, overall dependence on jet is then summarized in Fig. 9. With increasing , jets are getting more narrow. This is due to two reasons: running of , and change of proportion of gluon and quark jets. At low , the sample is dominated by gluon induced jets which are wider than quark jets, while at high , the sample is dominated by quark jets.
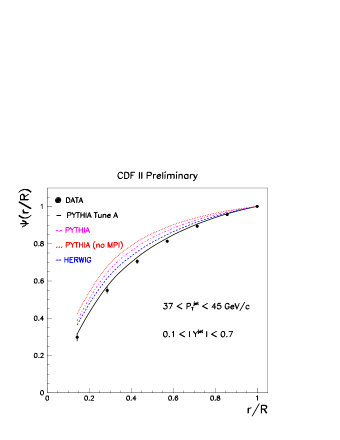
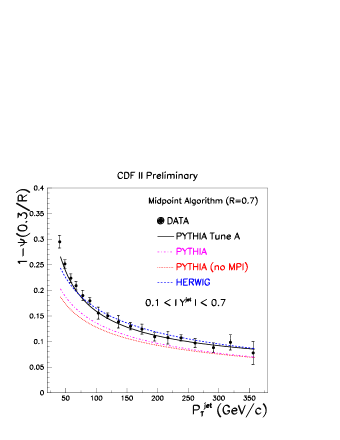
Herwig’s and pythia’s predictions are compared with the data as well in the two figures. pythia with default setting produces too narrow jets which indicates that there is not enough radiation in there. This is independent on pythia’s model of soft physics, multi-parton interactions (MPI), being switched on or off. In Run I, CDF tuned pythia to their data from studies of soft underlying event. So called Tune A gives very good description of jet shapes. Herwig describes data quite well, except the low- region where the jets are narrower than in the data.
To summarize, new results on jet spectra from CDF and DØ experiments has been presented. They are consistent with NLO QCD predictions. Aspects of multi-parton radiation were studied by the two experiments in the measurement of decorrelation in azimuthal angle between the two leading jets and in the measurement of jet shapes. NLO QCD provides good description of -distributions except the region where . The results are also useful for tuning parton shower models in MC generators.
References
- [1] R. Blair et al. (CDF II Collaboration), FERMILAB-PUB-96/390-E
- [2] V. Abazov et al. (DØ Collaboration), in preparation for submission to Nucl. Instrum. Methods Phys. Res. A; T. LeCompte and H. T. Diehl, Ann. Rev. Nucl. Part. Sci. 50, 71 (2000); S. Abachi et al. (DØ Collaboration), Nucl. Instrum. Methods Phys. Res. A 338, 185 (1994).
- [3] G. C. Blazey et al., in Proceedings of the Workshop: “QCD and Weak Boson Physics in Run II”, edited by U. Baur, R. K. Ellis, and D. Zeppenfeld, Batavia, Illinois (2000) p. 47. See Section 3.5 for details.
- [4] T. Affolder et al. (CDF Collaboration), Phys. Rev. D 64 (2001) 032001 [Erratum-ibid. D 65 (2002) 039903]
- [5] J. Pumplin et al., JHEP 0207, 12 (2002); D. Stump et al., JHEP 0310, 046 (2003).
- [6] A. D. Martin, R. G. Roberts, W. J. Stirling and R. S. Thorne, Phys. Lett. B 604, 61 (2004)
- [7] S. D. Ellis, D. E. Soper, Phys. Rev. D 48 (1993) 3160.
- [8] W. T. Giele, E. W. N. Glover, Phys. Rev. D 46 (1992) 1980.
- [9] V. M. Abazov et al. [DØ Collaboration], Phys. Rev. Lett. 94, 221801 (2005)
- [10] Z. Nagy, Phys. Rev. Lett. 88, 122003 (2002); Z. Nagy, Phys. Rev. D 68, 094002 (2003).
- [11] G. Marchesini et al., Comp. Phys. Comm. 67, 465 (1992); G. Corcella et al., JHEP 0101, 010 (2001).
- [12] T. Sjöstrand et al., Comp. Phys. Comm. 135, 238 (2001).