TOP QUARK RESULTS FROM DØ
In this talk I will present recent preliminary results from the DØ experiment from Tevatron Run II ( collisions at TeV). The results presented in this talk include top quark pair production cross section, top quark mass, and upper limits on single top quark production.
The top quark was discovered at the Tevatron in 1995 by the CDF and DØ experiments. The top quark is by far the heaviest of the six known quarks ( GeV). It is also the least well studied. The current run of the Tevatron (Run II) will greatly increase the statistics availble for studying the top quark and should result in many new and improved experimental measurements. The top quark was discovered using data samples with in integrated luminosity from each experiment of about 50 pb-1 and consisting of a few to a few dozen candidate events, depending on channel. The results presented in this talk are based on integrated luminosities of about 200 pb-1 out of about 500 pb-1 recorded. The balance of Tevatron Run II should increase the integrated luminosity by a further order of magnitude to fb-1.
The Tevatron is a proton-antiproton collider with a center-of-mass energy of TeV for Run II (as compared to 1.8 TeV for Run I, during which run the top quark was discovered). At hadron colliders such as the Tevatron, top quarks can be produced in pairs by the strong interaction, or singly by the weak interaction. Perhaps surprisingly, the expected pair production cross section () is only about a factor of two larger than the expected single production cross section ( pb). However, top quarks produced as pairs are much easier to observe than singly produced top quarks due to lower background. The goal of top quark research at the Tevatron is to test the Standard Model predictions regarding the top quark by observing the top quark in as many channels as possible, and to measure the fundamental properties of the top quark, such as its mass and couplings.
1 Top Quark Pair Production Cross Section
The Standard Model predicts that top quarks should decay nearly 100% of the time into a boson and a quark. Top quark pair events are classified according to the decays of the two bosons as dilepton events (, , , BR=5%), lepton+jets events (+jets, +jets, BR=30%), all jets events (BR=44%), and events containing taus (, , , +jets, BR=21%). Note that regardless of how the bosons decay, two quark jets are included in the final state, which is an important part of the signature of top quark production.
1.1 Dilepton Channel
The dilepton channel signature is two high- isolated leptons, two jets, and missing (). The main backgrounds are , , and (with missing due to measurement errors), and backgrounds involving misidentified charged leptons (fake leptons) in +jets and QCD multijet events. The event selection cuts are as follows.
-
•
Lepton GeV (20 GeV for ).
-
•
Jet GeV.
-
•
GeV () or 35 GeV ( and ).
-
•
Rejection of and events with invariant mass close to .
-
•
GeV () or 140 Gev ().
is defined as the sum of the ’s of the jets plus the of the higher lepton.
| Total | ||||
| Integrated luminosity (pb-1) | 156 | 140 | 143 | |
| Fake leptons | ||||
| Total background | ||||
| Expected signal | ||||
| Total expected | ||||
| Observed | 5 | 4 | 8 | 17 |
Results from the dilepton channels are summarized in Table 1. The DØ top quark pair production cross section preliminary result in the dilepton channel is as follows.
| (1) |
1.2 Lepton+Jets Channel
The nominal lepton+jets channel signature is one high- isolated lepton, four jets (including two -quark jets), and missing . The major backgrounds are +jets and QCD multijet events with fake leptons. The strategy for identifying top quark pair events in this channel is to begin with preselection cuts that require the lepton, jets, and missing , followed by additional analysis based on -tagging or topological event shape variables. The integrated luminosities of the data samples used in these channels varied from 141 pb-1 to 169 pb-1. Preselection cuts are as follows:
-
•
One isolated lepton with GeV and pseudorapidity () or ().
-
•
GeV () or GeV ().
-
•
Four or more jets (three in -tagged analysis) with GeV and .
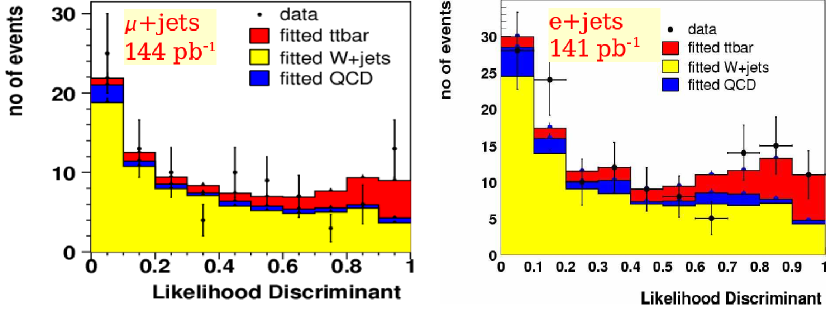
For the topological analysis, a likelihood discriminant is constructed from four topological event shape variables (two of the variables are sphericity and aplanarity). Next, the cross section is calculated using a maximum likelihood fit of the observed distribution of the likelihood discriminant to the sum of signal and background templates derived from either Monte Carlo (top quark signal, +jets background), or data (QCD multijet background). For this fit, the expected number of QCD multijet background is fixed, but the +jets contribution is allowed to float. The results of the likelihood fit are shown in Fig. 1. The preliminary cross section result for the topological lepton+jets channel is
| (2) |
The second approach to extracting the top quark signal from preselected +jets events is based on -tagging. In this approach, jets induced by quarks are identified by the presence of displaced tracks arising from the decay of long-lived -hadrons (lifetime -tagging) using the DØ silicon microstrip tracker (SMT). Two lifetime -tagging algorithms are used, based on either the impact parameters of tracks, or the presence of reconstructed displaced secondary vertices.
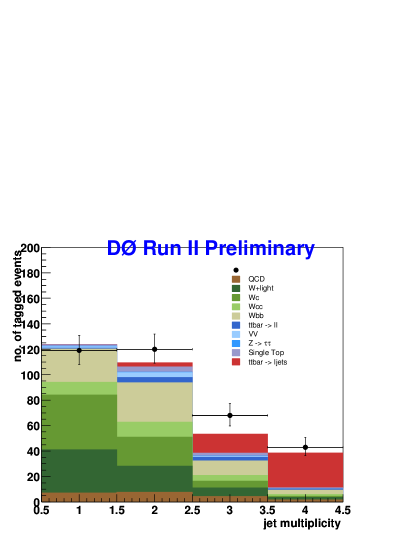
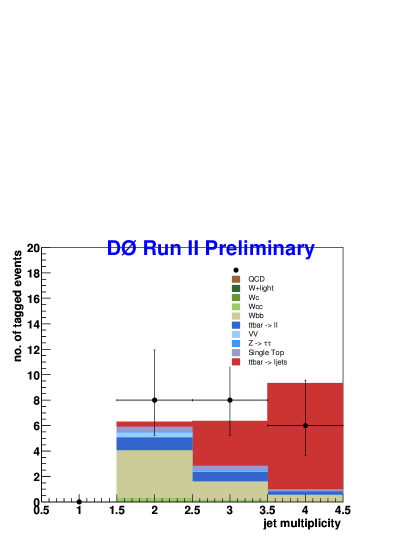
A likelihood fit is used to extract the top quark cross section. For the purpose of this fit, data are divided into separate bins for electron vs. muon, three vs. four or more jets, and one vs. two or more -tagged jets (for a total of eight bins). The expected background normalization is fixed using known -tagging efficiencies and fake rates, and using a jet flavor composition estimated by Monte Carlo. The result of the likelihood fit is shown in Fig. 2. The preliminary cross section results for the -tagged lepton+jets channel for the two -tagging algorithms are
| (3) |
| (4) |
1.3 All Jets Channel
The nominal signature for the all jets channel is six jets, two of which are -quark jets. The major background is QCD multijet production. The analysis of the all jets channel combines -tagging and event shape. The integrated luminosity used in this analysis is 162 pb-1. The preselection cuts are as follows.
-
•
Six or more jets with GeV and .
-
•
One secondary vertex -tag.
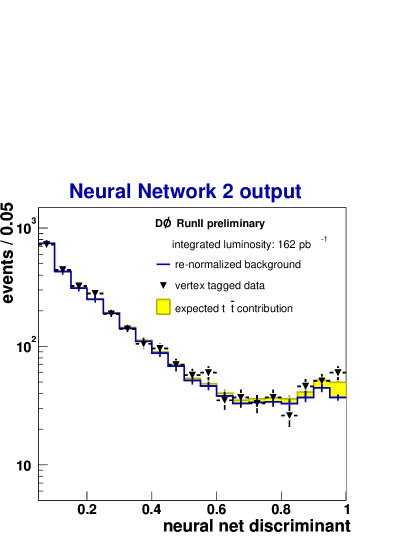
The event shape analysis makes use of three neural networks constructed using 13 event shape variables. The distribution of the final neural network output is shown in Fig. 3. The cross section is calculated by making a cut on the neural network output (), giving 220 events with an expected background of . The preliminary cross section result is
| (5) |
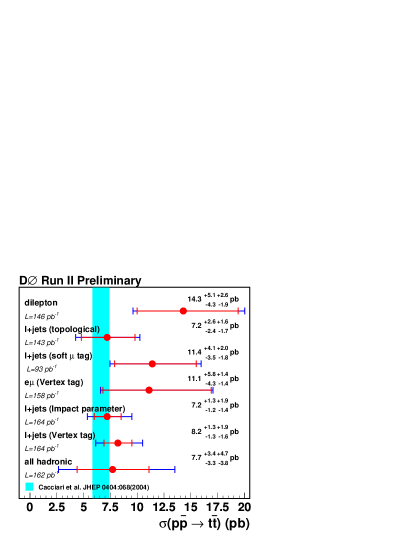
1.4 Pair Production Summary
Figure 4 shows a summary of all DØ preliminary pair production cross section results (those presented in this talk, and others). All results are consistent with each other and with theory.
2 Top Quark Mass
This talk contains top quark mass results from top quark pair events in the dilepton and lepton+jets channels. All results make use of some form of template-based likelihood fit. That is, a mass estimator is extracted for each event, and the distribution of mass estimators is fit to the sum of signal and background templates. The top quark mass hypothesis is varied to produce a likelihood curve.
2.1 Top Quark Mass in the Dilepton Channel
Dilepton top quark events do not have enough information to be fully reconstructed. Most dilepton events are therefore consistent with a continuum of top quark masses. It turns out that if one assumes a top quark mass, then there is just enough information to fully reconstruct dilepton events. Not all top quark masses are equally likely, however. For any top quark mass hypothesis, events are assigned a weight based on the Dalitz-Goldstein-Kondo (DGK) likelihood, which is proportional to the differential cross section of the fully reconstructed event. In case there is more than one solution to the reconstruction of the event (there can be up to four), the DGK likelihood is the sum of the possible solutions. Resolution smearing is also taken into account in constructing the DGK likehood curve. The DGK likelihood curve is used to extract a single top quark mass estimator, which is the top quark mass which maximizes the DGK likelihood. This is not the only possible mass estimator, nor is it the optimal one, but it is the simplest.
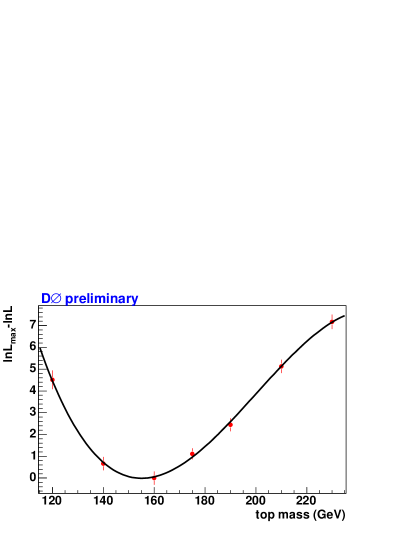
The event sample for the dilepton mass analysis consists of 13 events (8 , 5 , 0), with an expected background of 3.3 events (1.0 , 0.9 , 1.4 ). The top mass likelihood curve extracted from the signal and background template fit is shown in Fig. 5. The preliminary result for the top quark mass in the dilepton channel is as follows.
| (6) |
2.2 Top Quark Mass in the Lepton+Jets Channel
Candidate events for the lepton+jets mass analysis are preselected as +4 jet events, with final selection based either on topological event shape or -tagging (similar to the cross section analysis).
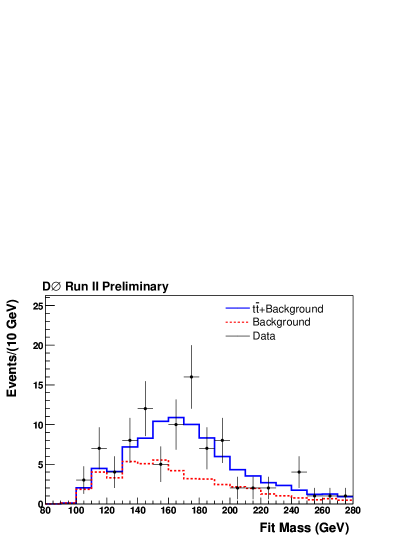
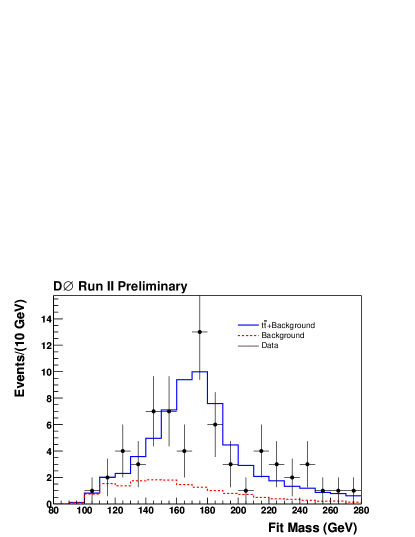
The top quark mass is estimated for each event by fully reconstructing the the event according to the top quark pair hypothesis using a kinematic fit. The kinematic fit has 12 possible solutions (six with single -tag, two with double -tag). The top quark mass estimate is taken from the best fit. The results of the likelihood fit are shown in Fig. 6. The preliminary top quark mass in the lepton+jets channel for untagged and -tagged events are
| (7) |
| (8) |
3 Single Top Production
Production of top quarks singly by the weak interaction provides the opportunity to make an absolute measurement of the weak couplings of the top quark (e.g. ), which is not possible with pair-produced top quark events. Observing single top quark production is an experimental challenge, which may be quite close to being achieved.
The leptonic signature for single top production is similar to the lepton+jets channel for top pairs, except that there are fewer jets. The final state contains two -quarks, one of which is produced in association with the top quark (which may or may not too far forward to be observable), and the second of which comes from top quark decay. Major backgrounds are +jets, top quark pairs, and QCD multijet events with fake leptons. Event selection cuts for the single top analysis are as follows.
-
•
One isolated lepton with GeV and () or ().
-
•
GeV.
-
•
Leading jet GeV and .
-
•
One to three additional jets with GeV and .
-
•
One or two secondary vertex -tags.
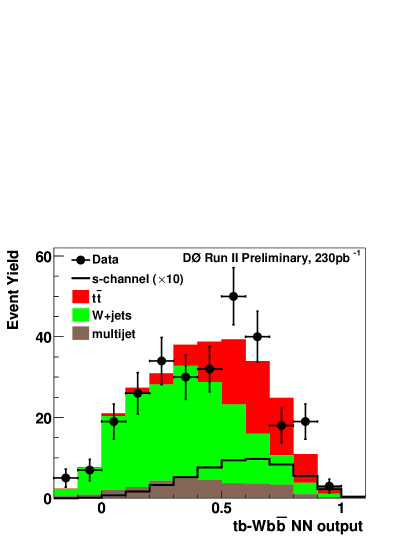
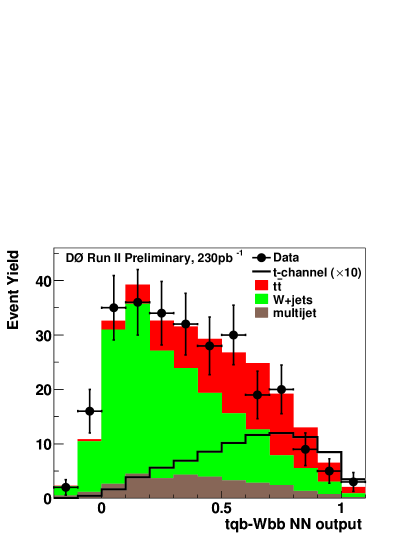
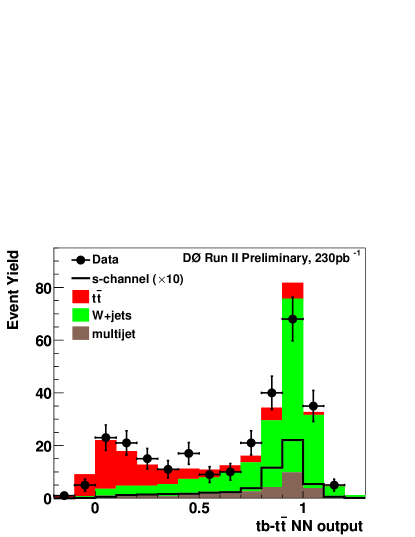
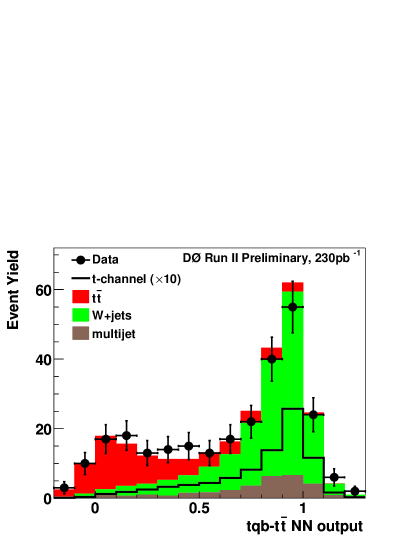
Following event selection, a neural network event shape analysis is performed using 11 event shape variables. These variables include energy-related variables, including the reconstructed top quark mass, as well as non-energy-related variables. Four neural network discriminants are derived, one of which is optimized for separating each of the two signal production mechanisms (-channel and -channel) from each of the two main backgrounds (+jets and ). Distributions of the four neural network discriminants are shown in Fig. 7.
Upper limits are obtained for each production mechanism separately using a two-dimsneional template likelihood fit, whose two dimensions are the neural network discriminants for the two backgrounds. The likelihood curve for the two production mechanisms are shown in Fig. 8. The preliminary results for the upper limits on single top production are as follows.
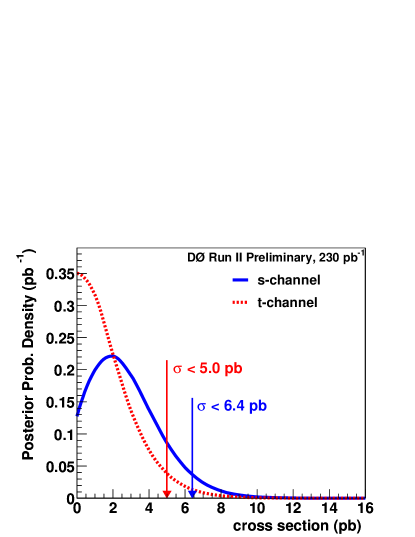
| (9) |
| (10) |
The expected limits are 4.5 pb and 5.8 pb for -channel and -channel respectively.
4 Summary
To summarize, in this talk we present results for top quark pair production, top quark mass, and upper limits on single top quark production. All results are consistent with previous results and with the Standard Model. All results are preliminary, based on integrated luminosities of about 200 pb-1. Tevatron Run II is expected to generate data with an integrated luminosity in the range 4–8 pb-1.
Acknowledgments
We thank the staffs at Fermilab and collaborating institutions, and acknowledge support from the DOE and NSF (USA); CEA and CNRS/IN2P3 (France); FASI, Rosatom and RFBR (Russia); CAPES, CNPq, FAPERJ, FAPESP and FUNDUNESP (Brazil); DAE and DST (India); Colciencias (Colombia); CONACyT (Mexico); KRF (Korea); CONICET and UBACyT (Argentina); FOM (The Netherlands); PPARC (United Kingdom); MSMT (Czech Republic); CRC Program, CFI, NSERC and WestGrid Project (Canada); BMBF and DFG (Germany); SFI (Ireland); Research Corporation, Alexander von Humboldt Foundation, and the Marie Curie Program.
References
References
- [1] CDF Collaboration, F. Abe et al., Phys. Rev. Lett. 74, 2626 (1995); DØ Collaboration, S. Abachi et al., Phys. Rev. Lett. 74, 2632 (1995).
- [2] CDF and DØ Collaborations, TEVEWWG, hep-ex/0404010 (2004).
- [3] R. Bonciani et al., Nucl. Phys. B529, 424 (1998); N. Kidonakis and R. Vogt, Phys. Rev. D 68, 114014 (2003); M. Cacciari et al., JHEP 404, 68 (2004).
- [4] B. W. Harris et al., Phys. Rev. D 66, 054024 (2002); Z. Sullivan, Phys. Rev. D 70, 114012 (2004); J. Campbell, R. K. Ellis, and F. Tramontano, Phys. Rev. D 70, 094012 (2004); Q.-H. Cao, R. Schwienhorst, and C.-P. Yuan, Phys. Rev. D 71, 054023 (2005).
- [5] http://www-d0.fnal.gov/Run2Physics/WWW/results/prelim/TOP/T03/T03.pdf.
- [6] http://www-d0.fnal.gov/Run2Physics/WWW/results/prelim/TOP/T05/T05.pdf.
- [7] http://www-d0.fnal.gov/Run2Physics/WWW/results/prelim/TOP/T02/T02.pdf.
- [8] http://www-d0.fnal.gov/Run2Physics/WWW/results/prelim/TOP/T11/T11.pdf.
- [9] http://www-d0.fnal.gov/Run2Physics/WWW/results/prelim/TOP/T12/T12.pdf.
- [10] http://www-d0.fnal.gov/Run2Physics/WWW/results/prelim/TOP/T13/T13.pdf.