Abstract
Using data collected with the “ISTRA+” spectrometer during the 2001 run of the U-70 proton synchrotron in Protvino, we report the first observation of the radiative kaon decay K. We find BR(KE MeV) / BR(Kμ3) = 0.270 0.029(stat) 0.026(syst)% and BR(KEMeVBR(Kstatsyst. These ratios are consistent with the theoretical predictions and respectively. The measured angular distribution asymmetry for the region E MeV, A, is two standard deviations away from the theoretical prediction of 0.354. The measured asymmetry in the T-odd variable is .
1 Introduction
The study of the radiative kaon decays can give valuable information on the kaon structure and allows for good test of theories describing hadron interactions and decays, like Chiral Perturbation Theory (ChPT). Until now the studies of the radiative Kl3-decays are restricted by the decay modes with electrons in the final state or by the studies of KL decays [1, 2]. Only one paper [3], dated by 1973, published the upper limit on the branching of K-decay.
The interest to the study of Kl3γ decays is further enhanced by the theoretical proposals to search for effects of new physics using T-odd kinematical variable [4, 5]. In the standard model the expected asymmetry for K decay
A
is at the level [4], whereas in the extensions of the standard model it can achieve [5].
In this paper we present first observation of the radiative K decay. The experimental setup and event selection are described in section 2. The results of the analysis are presented in section 3, where we, first, show the presence of the signal for the photon energy in the kaon rest frame E below 60 MeV, measure the branching ratio for the region 5 E 30 MeV, measure the asymmetries in this region and finally measure the branching ratio for the region 30 E 60 MeV. Our conclusions are given in the last section.
2 Experimental setup and event selection

The experiment is performed at the IHEP 70 GeV proton synchrotron U-70. The ISTRA+ spectrometer has been described in detail in recent papers on [6, 7], [8, 9] and decays [10]. Here we recall briefly the characteristics relevant to our analysis. The ISTRA+ setup is located in a negative unseparated secondary beam line 4A of U-70. The beam momentum is GeV/c with . The admixture of in the beam is , the beam intensity is per 1.9 sec U-70 spill. A schematic view of the ISTRA+ setup is shown in Fig. 1. The beam particles are deflected by the magnet M1 and are measured by four proportional chambers BPC1—BPC4 with 1 mm wire spacing, the kaon identification is done by three threshold Cerenkov counters Č0—Č2. The 9 meter long vacuum decay volume is surrounded by eight lead glass rings used to veto low energy photons. The 72-cell lead-glass calorimeter SP2 plays the same role. The decay products are deflected in the magnet M2 with 1 Tm field integral and are measured with 2 mm step proportional chambers PC1—PC3, with 1 cm cell drift chambers DC1—DC3 and, finally, with 2 cm diameter drift tubes DT1—DT4. The wide aperture threshold Cerenkov counters Č3 ,Č4 , filled with He, serve to trigger electrons and are not used in the present measurement. SP1 is a 576-cell lead-glass calorimeter, followed by HC, a scintillator-iron sampling hadron calorimeter. MH is a 11x11 cell scintillating hodoscope, used to improve the time resolution of the tracking system, MuH is a 7x7 cell muon hodoscope.
The trigger is provided by scintillation counters S1—S5, beam Cerenkov counters and by the analog sum of amplitudes from last dynodes of the SP1 : T=S, here S4 is a scintillation counter with a hole to suppress the beam halo, S5 is a counter downstream of the setup at the beam focus, (SP requires that the analog sum to be larger than the MIP signal.
During the physics run in November-December 2001 350 million trigger events were collected with high beam intensity. This information is complemented by 150 M Monte Carlo (MC) events generated using Geant3 [11] for the dominant decay modes, 100 M of them are the mixture of the dominant decay modes with the branchings exceeding 1 %, 30 M are the decays KKμ3) and 20 M are the decays KKπ3). Signal efficiency has been estimated using 5.7 M MC events of the radiative decay weighted with the matrix element, calculated in the leading approximation (up to terms of ) of chiral perturbation theory[4, 12]
Some information on the data processing and reconstruction procedures is given in [6, 8, 10, 7, 9], here we briefly mention the details relevant for present analysis.
The muon identification (see [8, 9]) is based on the information from the SP1 and the HC. The energy deposition in the SP1 is required to be compatible with the MIP signal in order to suppress charged pions and electrons. The sum of the signals in the HC cells associated with charged track is required to be compatible with the MIP signal. The muon selection is further enhanced by the requirement that the ratio of the HC energy in last three layers to the total HC energy exceeds 5 %. The used cut values are the same as in [9].
Events with one reconstructed charged track and three reconstructed showers in the calorimeter SP1 are selected. We require the effective mass m to be within MeV/c2 from m. In the following analysis the central MeV/c2 band is used for signal search and the side bands MeV/c2 and MeV/c2 are used for background studies. We require also the reconstructed -coordinate of the vertex to be below 1650 cm. 183672 events have been selected and written to miniDST’s using the above cuts with relaxed cut on to be above 1 %.
3 Evidence for signal and measurements of the branching ratios
A set of cuts is developed to suppress backgrounds to the Kμ3γ decay and/or to do data cleaning:
0) We select events with good charged track having two reconstucted ( and ) projections and the number of hits in the MH below 5. We require also that the missing mass squared to the () system abs(m (GeV/c2)2. 50804 events have survived these cuts.
1) Events with the reconstructed vertex inside the interval cm are selected.
2) The measured missing energy is required to be above zero.
3) We require the effective mass M to be within MeV/c2 from m.
4) We require also that the missing mass squared to the system is below 0.025 (GeV/c2)2 ( m).
5) The events with missing momentum pointing to the SP1 working aperture are selected in order to suppress possible background ( cm, here is the distance between the impact point of the missing momentum and the SP1 center in the SP1 transverse plane).
6) We require the photon energy E in the kaon rest frame to be below 60 MeV.
The remaining decays are suppressed by requirements:
7) , where is the angle between and in the kaon rest frame;
8) , where is the angle between and in the laboratory frame in the plane perpendicular to the beam momentum.
9) We require also the absence of the signal above the threshold in the calorimeter SP2.
We look for a signal in the distributions over the effective mass M, where four-momentum is calculated using the measured missing momentum and assuming m, and in the distributions of the missing mass squared to the -system, m. Effective mass spectra for cut levels 1, 4, 6 and 9 are shown in Fig. 2. These spectra show the evidence for peak at mK after the cut on the photon energy in the kaon rest frame.

3.1 The region below 30 MeV.
We have found that the signal is clearly seen for E MeV and the background in this region is dominated by Kμ3 decays (with an accidental extra photon) and Kπ3 decays. The main MC sample of 100 M events (with the natural mixture of the dominant decay modes) has been found to be insufficient for estimates of the background shapes, therefore specialized MC samples of 20 M Kπ3 and 30 M Kμ3 events have been used. The background has been divided into three contributions:
1) Non- contribution has been estimated using tails of the M distribution for real data, see Fig. 3 .

2) Kπ3 contribution has been approximated by the form given by specialized MC sample, its normalization has been fixed using the observed Kπ3 signal in the m distribution for selected events.
3) Kμ3 contribution has been approximated by the form from specialized MC sample, its normalization has been kept free.
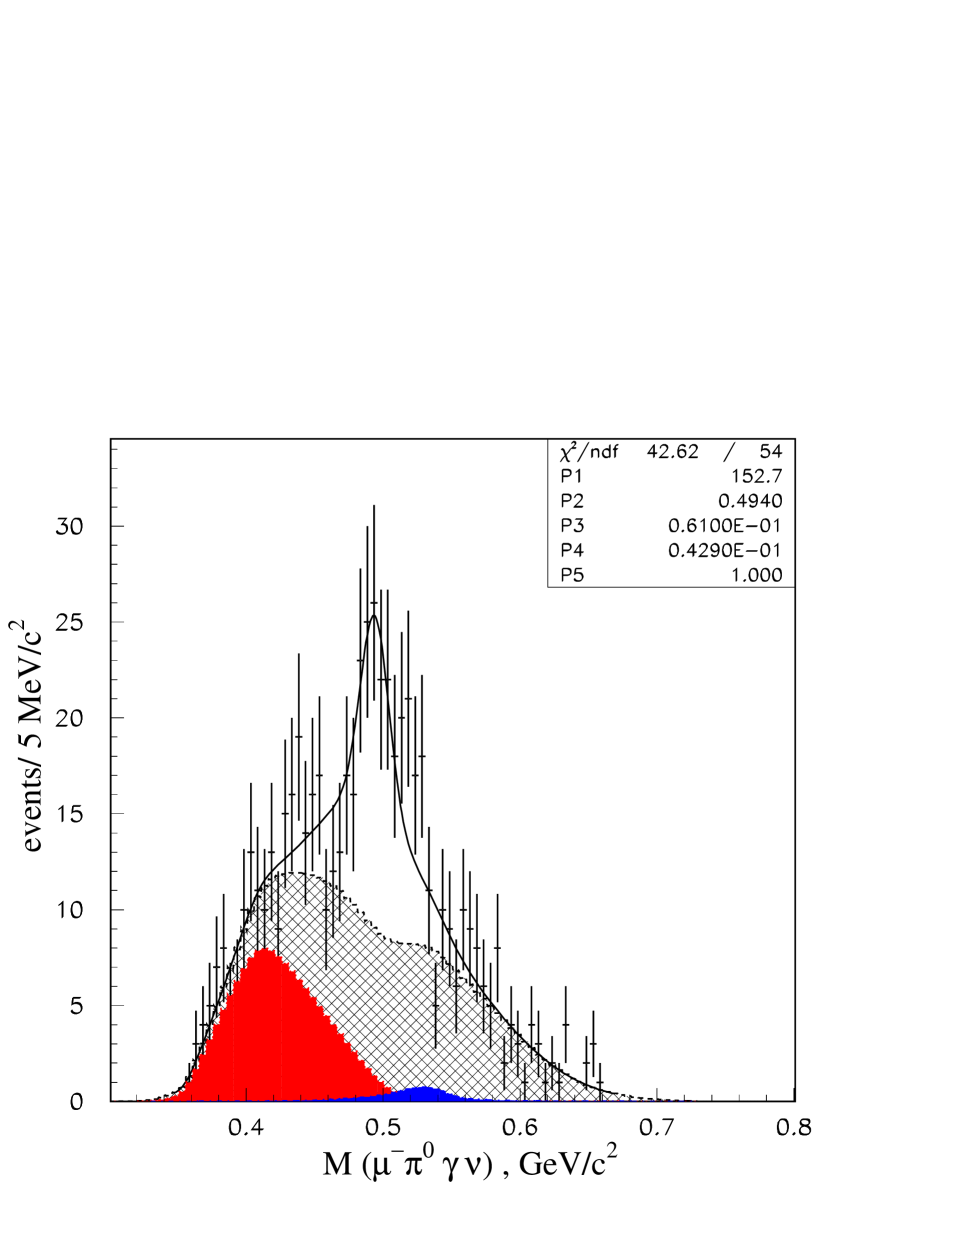
The shapes for all three background contributions have been found using the histogram smoothing by the HQUAD routine from the HBOOK package [13]. The signal has been parametrized by the sum of two Gaussians with widths and relative fractions fixed at the values given by the signal MC sample.
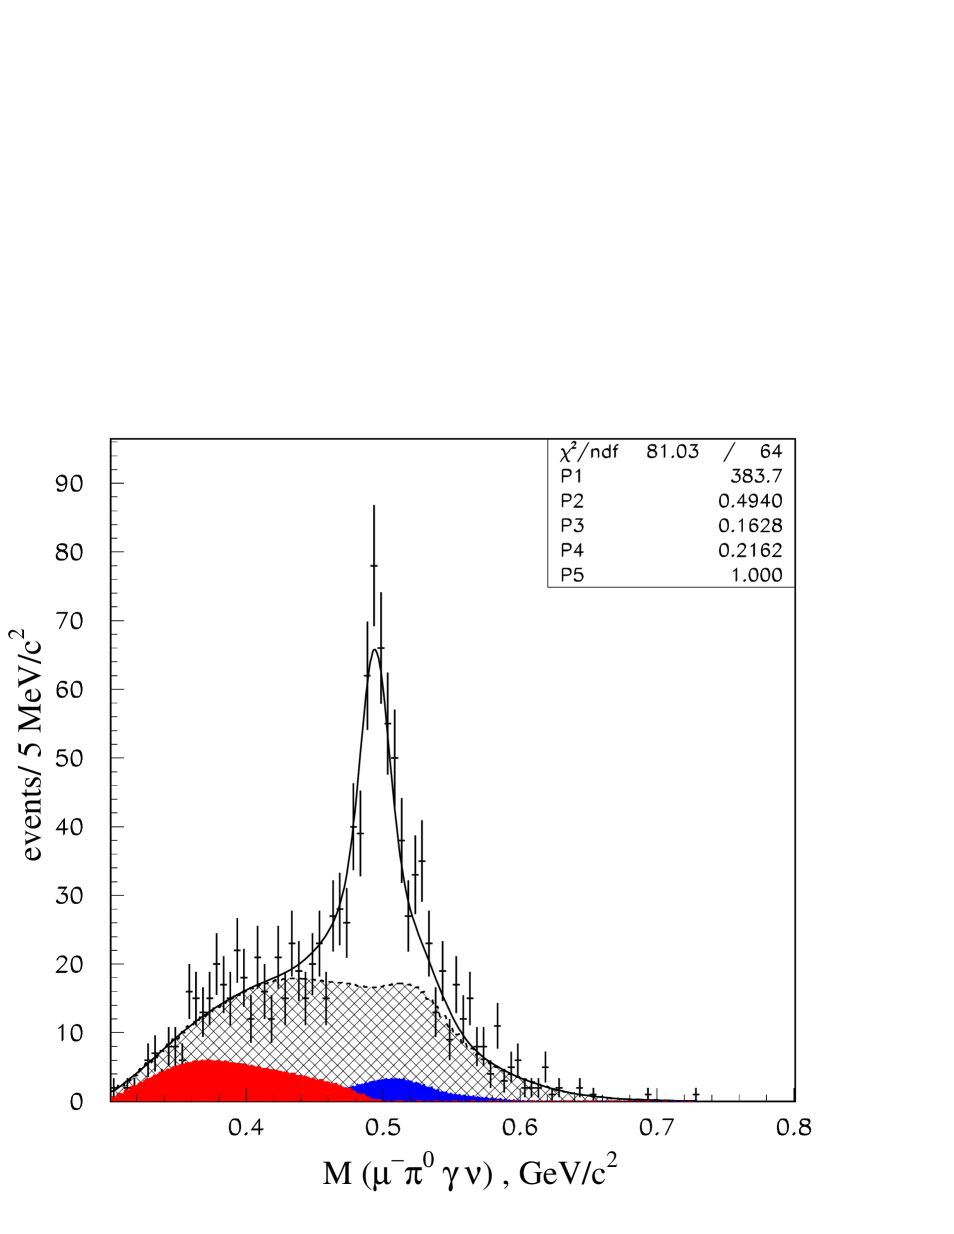
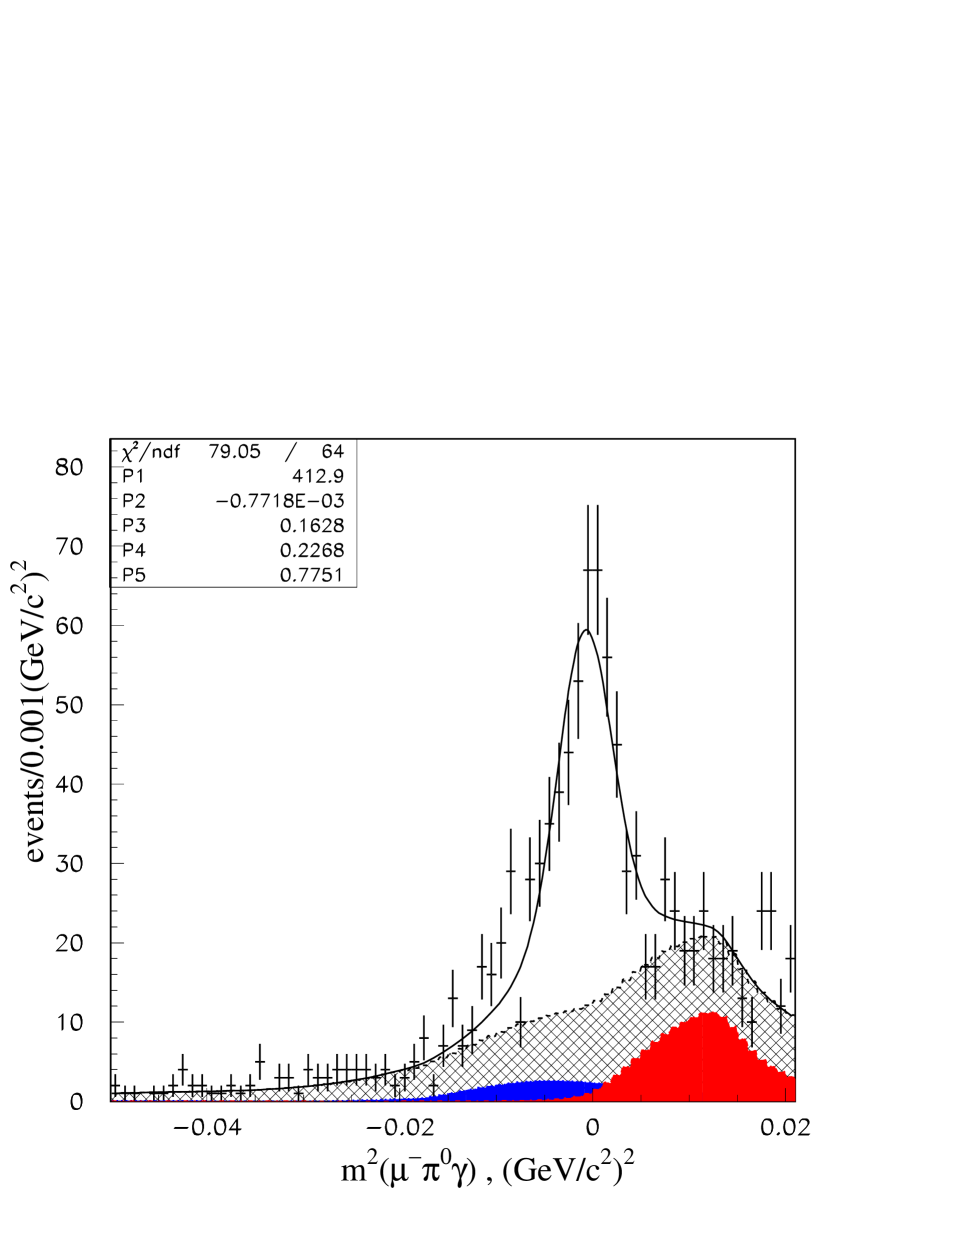
Results of the fits are illustrated respectively in Fig. 4 and Fig. 5 for the distributions over M and m. First parameter here (and in the following) is the number of observed events, second parameter is the position of the peak , and three last parameters are the respective normalization factors of the Kπ3, Kμ3 and non- contributions.
The number of observed events is equal to in Fig. 4 and to in Fig. 5. The difference between these two values (29.2) is our estimate of the systematics caused by the imprecise knowledge of the backgrounds. The results of fits with the polynomial parametrization of the background lie also within this uncertainty.
The Kμ3 decay has been used for the normalization. The number of Kμ3 events in the region 400 cm, corrected for the geometrical acceptance and the measurement efficiency, has been found using the cuts described in [9]. It is equal to K. Independent normalization of using Kπ2 decays gives the branching ratio lower by 6.2%. The origin of this difference is explained mainly by the trigger bias. This difference has been taken into account in our final estimates of the systematic uncertainties.
The signal efficiency has been found from the signal MC weighted with the matrix element, calculated within O ChPT approximation. It is equal to 2.6 %. The signal efficiency has been calculated using the cut E MeV, the cut value is our detection threshold explained by the beam momentum and the threshold in the energy of the SP1 showers equal to GeV.
The measured branching ratio is equal to BR = (statsyst. This should be compared with theoretical prediction of 6.86. The ratio R=BR(K/BR(K is equal to R = (statsyst. This should be compared with theoretical prediction of 2.1. In the transformations from the ratio R to the branching ratio we use the branching ratio BR(K [14].
3.2 Asymmetries for the region E MeV.
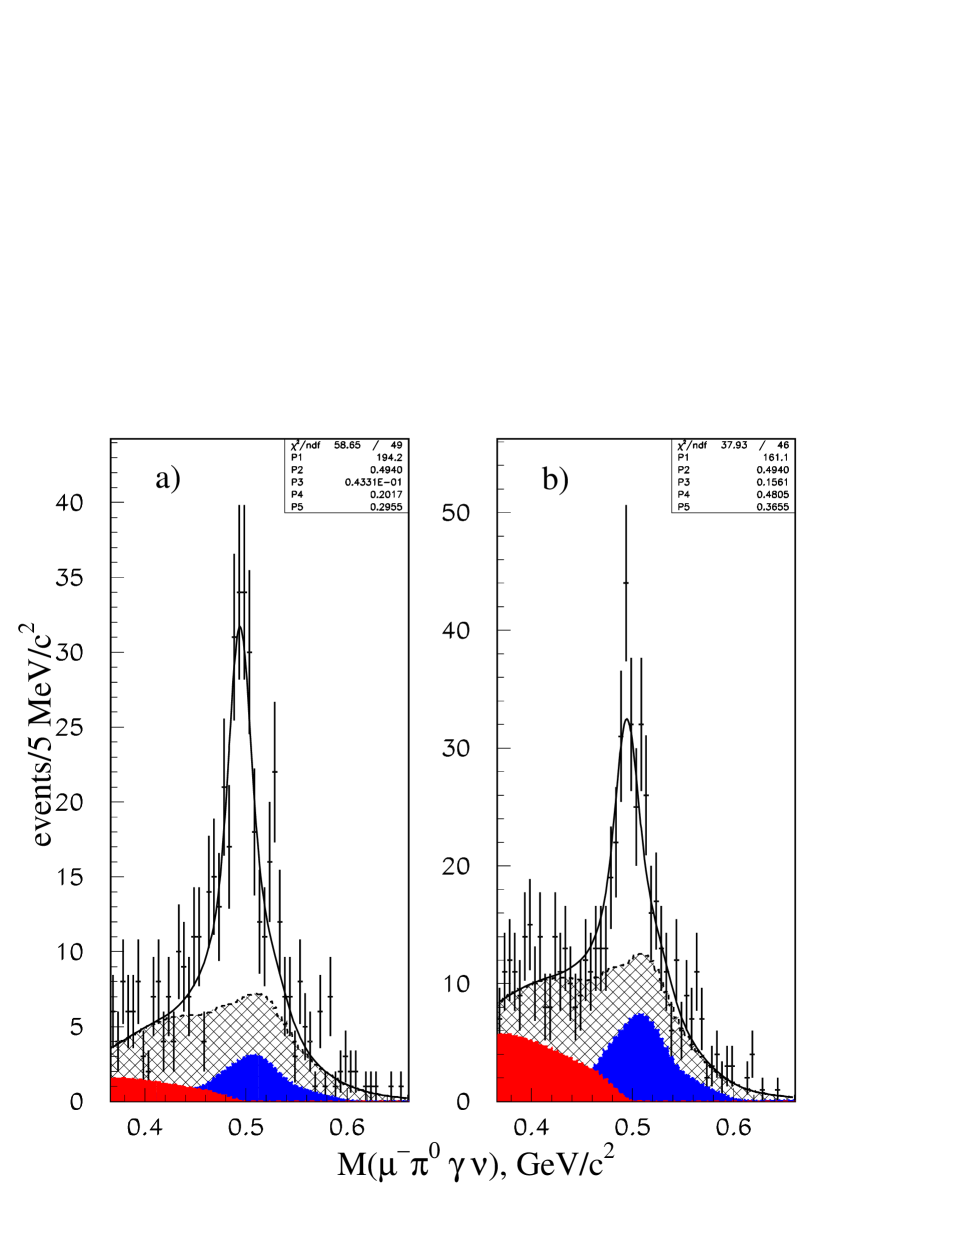
For this region we have measured the asymmetry of photon emission towards muon direction in the kaon rest frame
A
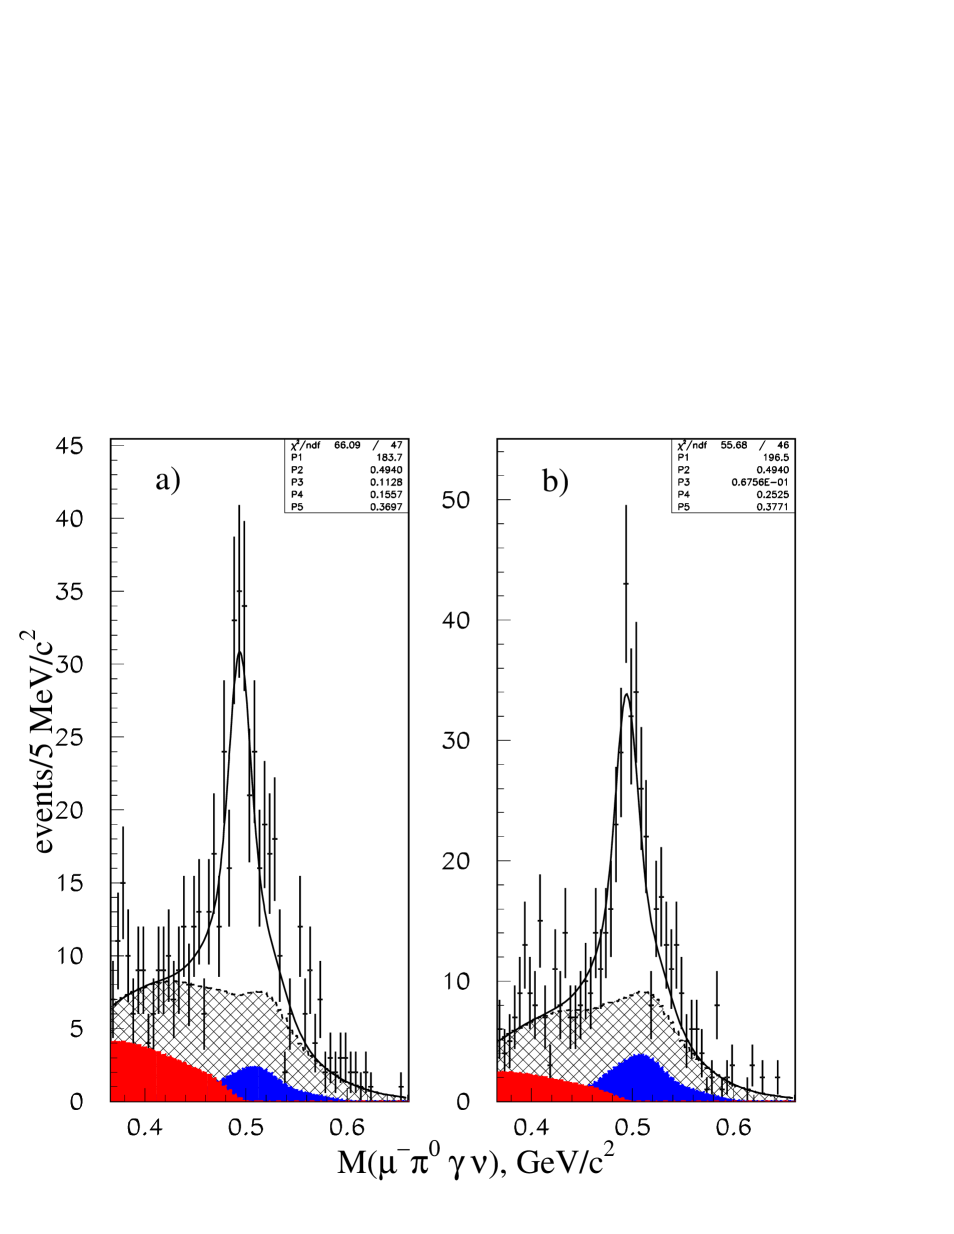
and the asymmetry in , A. The effective mass spectra are shown in Fig. 6 for positive and negative separately and in Fig. 7 for positive and negative .
The asymmetry in is equal to , this value is below the theoretical expectation, equal to 0.35, by 2 standard deviations.
The asymmetry in is equal to . Of course our statistics is insufficient to test the theoretical predictions [4, 5].
3.3 The region E MeV.
For this region we see strong Kπ3 background and residual Kπ2 background. These backgrounds have been suppressed by additional cut 0.1 MeV/c. The parametrization is illustrated in Fig. 8 for the effective mass M spectrum. The signal efficiency was found to be 6.30 %. The number of observed events is equal to statsyst. The systematics in the number of observed events has been calculated in the same way as in the Section 3.1. The branching ratio BR = (statsyst, is compatible with the theoretical expectation . The ratio R = (statsyst, is compatible with the expectation .
4 Conclusions
Our conclusions are the following.
First observation of the radiative kaon decay K is presented.
The measured ratio R = BR(KBR(K for the region E MeV is equal to 0.270statsyst. This is consistent with theoretical prediction equal to 0.21 %.
The measured ratio R for the region E MeV is equal to (statsyst, this value is compatible with theoretical prediction equal to .
The measured asymmetry in the T-odd variable for the region E MeV is equal to .
The measured asymmetry in the is equal to , this value is two standard deviations away from the theoretical prediction equal to 0.354.
The work is supported in part by the RFBR grant N03-02-16330(IHEP group) and RFBR grant N03-0216135(INR group). We are indebted to V. Braguta for giving us routine for O ChPT matrix element calculations.
References
- [1] M. Bender et al., NA48 Collaboration, Phys.Lett. B418 (1998) 411.
- [2] T. Alexopoulos et al., KTeV Collaboration, Phys.Rev. D71 (2005) 012001.
- [3] D. Ljung and D. Cline, Phys.ReV. D8 (1973) 1307.
- [4] V. Braguta, A. Likhoded, A. Chalov, Phys.Rev. D65 (2002) 054038.
- [5] V. Braguta, A. Likhoded, A. Chalov. Phys.Rev. D68 (2003) 094008.
- [6] I.V. Ajinenko et al., Phys.Atom.Nucl. 65(2002) 2064; Yad. Fiz. 65(2002)2125.
- [7] O.P. Yushchenko et al., Phys. Lett. B589 (2004) 111.
- [8] I.V. Ajinenko et al., Phys.Atom.Nucl. 66(2003) 105; Yad. Fiz. 66(2003) 107.
- [9] O.P. Yushchenko et al., Phys. Lett. B581 (2004) 31.
- [10] I.V. Ajinenko et al., Phys. Lett. B567 (2003) 159.
- [11] R. Brun et al., CERN-DD/EE/84-1, CERN, Geneva, 1984.
- [12] J. Bijnens, G. Ecker, J. Gasser, Nucl.Phys. B396 (1993) 81.
-
[13]
CN/ASD Group, HBOOK Users Guide(version 4.22), Program Library Y250,
CERN, Geneva, 1994;
J. Allison, Comp.Phys.Comm. 77 (1993) 377. - [14] S. Eidelman et al., Review of Particle Physics, Particle Data Group, Phys. Lett. B502 (2004) 1.