THE KLOE COLLABORATIONaaa
The KLOE Collaboration:
A. Aloisio,
F. Ambrosino,
A. Antonelli,
M. Antonelli,
C. Bacci,
G. Bencivenni,
S. Bertolucci,
C. Bini,
C. Bloise,
V. Bocci,
F. Bossi,
P. Branchini,
S. A. Bulychjov,
R. Caloi,
P. Campana,
G. Capon,
T. Capussela,
G. Carboni,
F. Ceradini,
F. Cervelli,
F. Cevenini,
G. Chiefari,
P. Ciambrone,
S. Conetti,
E. De Lucia,
P. De Simone,
G. De Zorzi,
S. Dell’Agnello,
A. Denig,
A. Di Domenico,
C. Di Donato,
S. Di Falco,
B. Di Micco,
A. Doria,
M. Dreucci,
O. Erriquez
A. Farilla,
G. Felici,
A. Ferrari,
M. L. Ferrer,
G. Finocchiaro,
C. Forti,
P. Franzini,
C. Gatti,
P. Gauzzi,
S. Giovannella,
E. Gorini,
E. Graziani,
M. Incagli,
W. Kluge,
V. Kulikov,
F. Lacava,
G. Lanfranchi,
J. Lee-Franzini,
D. Leone,
F. Lu,
M. Martemianov,
M. Martini,
M. Matsyuk,
W. Mei,
L. Merola,
R. Messi,
S. Miscetti,
M. Moulson,
S. Müller,
F. Murtas,
M. Napolitano,
F. Nguyen,
M. Palutan,
E. Pasqualucci,
L. Passalacqua,
A. Passeri,
V. Patera,
F. Perfetto,
E. Petrolo,
L. Pontecorvo,
M. Primavera,
P. Santangelo,
E. Santovetti,
G. Saracino,
R. D. Schamberger,
B. Sciascia,
A. Sciubba,
F. Scuri,
I. Sfiligoi,
A. Sibidanov,
T. Spadaro,
E. Spiriti,
M. Tabidze,
M. Testa,
L. Tortora,
P. Valente,
B. Valeriani,
G. Venanzoni,
S. Veneziano,
A. Ventura,
S. Ventura,
R. Versaci,
I. Villella,
G. Xu .presented by G. LANFRANCHI
Abstract
Recent results obtained by the KLOE experiment operating at DANE, the
Frascati -factory, are presented.
They mainly concern neutral kaon decays including the dominant branching ratios, the lifetime and the extraction of the parameter
from the semileptonic decays and lifetime.
The best world upper limit on channel is also presented.
1 Introduction
The determination of and provide the most
precise test of CKM unitarity.
In fact the first row unitarity requires which, since , is equivalent
to .
The 2004 edition of Particle Data Group gives
and
from which the sum of the squares gives
which deviates from unitarity by .
Semileptonic kaon decays are the cleanest way to obtain an accurate value
of . In fact, since is a transition,
only the vector part of the weak current has a non vanishing contribution
and such processes are protected by the Ademollo-Gatto
theorem against SU(3) breaking corrections to the lowest order in .
In order to extract from semileptonic kaon decays we need to
measure the branching fraction and the lifetime.
The most accurate determination of from semileptonic decays
comes from KTeV collaboration .
The branching fraction is found to be , strikingly different from PDG fit value, .
The KTeV result has been partially confirmed by the
NA48 Collaboration, ,
even if with an error 4 times bigger.
The lifetime value in the PDG relies on a single direct measurement
ns
that was performed more than 30 years ago
. lifetime is, at present, the major experimental
source of error in the determination of .
KLOE has the unique possibility to measure simultaneously absolute
branching fractions and lifetime.
The measurement of the absolute branching is possible
at the -factory since the production of pairs
in decays provides a tagged, monochromatic beam of known flux.
Moreover have low momentum ( 110 MeV/c)
and, therefore, a big fraction () of them decays inside the detector.
This is important since the statistical error on the lifetime
depends on the number of events, and, very strongly,
on the time interval covered:
(1)
where is the interval covered by the fit
in lifetime units and is the number of events in that interval.
With and (which is the KLOE case)
a statistical error of 0.3 can, in principle, be reached.
2 Experimental Setup
DANE, the Frascati factory, is an collider
working at GeV with a design luminosity
of cm-2 s-1. The mesons are produced,
almost at rest, with a visible cross section of 3.2 b
and decay into () pairs with BR of %
(%).
These pairs are produced in a pure quantum state, so that
observation of a () in an event signals (tags)
the presence of a () and vice-versa;
highly pure and nearly monochromatic and
beams can thus be obtained. Neutral kaons get a momentum of 110 MeV/c which
translates in a slow speed, 0.22.
and can therefore be distinguished by their mean decay lengths:
0.6 cm and 340 cm.
The KLOE detector consists of a drift chamber, DCH, surrounded by an
electromagnetic calorimeter, EMC.
The DCH is a cylinder of 4 m diameter
and 3.3 m in length which constitutes a large fiducial volume
for decays (1/2 ). The momentum resolution for tracks
at large polar angle is %. The EMC is a
lead-scintillating fiber calorimeter
consisting of a barrel and two endcaps which cover 98% of the solid angle. The
energy resolution is .
The intrinsic time resolution is 54 ps ps.
A super-conducting coil surrounding the barrel
provides a 0.52 T magnetic field.
During 2002 data taking, the maximum luminosity reached by DANE was
7.5 cm-2 s-1. Although this is lower than the design value,
the performance of the machine was improving during the years and, at the end
of 2002, we collected 4.5 pb-1/day. The whole data sample in the years 2001-2002
amounts to 450 pb-1, equivalent to 1.4 billion decays.
The analyses presented here are based on 400 pb-1 of integrated luminosity
of the 2001 and 2002 runs.
Recently,
the machine has been upgraded and KLOE has resumed its data taking in
April 2004. Up to know (15th May, 2005) 1 fb-1 have
already been collected with a peak luminosity of
1.3 cm-2 s-1.
We foresee to reach 2 fb-1 by the end of the year.
3 Measurement of the dominant branching ratios
The absolute branching fractions are determined
on a tagged events sample by counting the number
of decays in each channel, , in the used fiducial volume and
correcting for acceptance, reconstruction efficiency
and tagging efficiency:
(2)
where , is the number of tagging events, is the reconstruction efficiency
( for events, for events
and for events),
is the fiducial volume geometrical acceptance
which depends on the lifetime and
is the fractional variation of the tagging efficiency when
the decays in a given channel with respect to the average.
We define this ratio tag bias.
3.1 The tag
The tag is provided by events selected
requiring the presence of a vertex with two opposite curvature tracks
within a cylinder of radius 10 cm and height 20 cm
around the interaction point (IP).
The two-tracks invariant mass, in the pions hypothesis, must be within 5 MeV around
. The magnitude of the total momentum of the two tracks
must be within 10 MeV of the value expected from the value of .
The momentum is obtained from the decay kinematics of
using the direction reconstructed from the measured momenta
of tracks and the known value of .
The main source of tag bias is due to the dependence of the trigger efficiency
on the behaviour. The hardware calorimeter
trigger which requires two local energy deposits above
some thresholds (50 MeV on the barrel and 150 MeV on the end caps)
is used for the present analysis.
The trigger efficiency is essentially 100 for , between for charged
decays.
To reduce the tag bias due to trigger efficiency
we require that the trigger conditions are satisfied by the pions from
. We further reinforce these conditions by requiring that the two pions
impinge on the calorimeter barrel and produce two clusters
with an energy 80 MeV each.
The used for the analysis is defined inside the drift chamber
by 35 cm 150 cm and 120 cm, where are the decay vertex position coordinates. Since the mean decay path length in KLOE is 340 cm, the FV contains of the decays.
This choice minimize the difference in tag bias among the decay modes. The average tag bias is 0.985, 0.99 and 1.02 for or and
decays respectively.
3.2 Charged decays
The in charged decay modes are selected by requiring the presence
of two good tracks forming a vertex in the FV
and not belonging to the decay tree.
A track is associated to the if the
point of closest approach to the line of flight
has a distance with respect to the line of flight
, with and = 5 cm.
The tracking efficiency has been determined by counting the number of events
with at least one found track and the number of events
in which there are two opposite sign decay tracks.
The tracking efficiency is also evaluated from Monte Carlo
simulation and it is 60.5 for , 58.5
for and for .
A correction to the tracking efficiency
has been applied by comparing the results for data and Monte Carlo simulation.
The correction is evaluated as a function of the track momentum using
and events and ranges
between 1.03 and 0.99 depending on the channel.
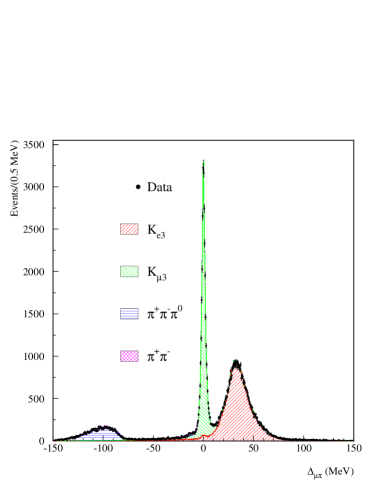
The variable to discriminate among the different charged decay modes
is the lesser of the two values of
, where is the
missing momentum and is the missing energy
evaluated in the two mass assignments or .
An example of this distribution is shown in Fig. 1 where
the different components are shown.
Figure 1: distribution for an event subsample.
Dots are data, solid histograms are Monte Carlo.
The distribution obtained with data
is fitted with a linear combination of three Monte Carlo
distributions (for and events) by leaving free the
relative weights.
The contribution from the violating decay
and the with Dalitz conversion is kept
fixed in the fit and amounts to 0.3 .
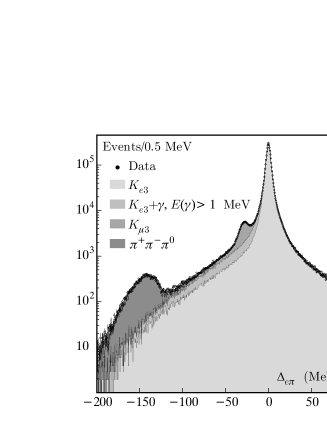
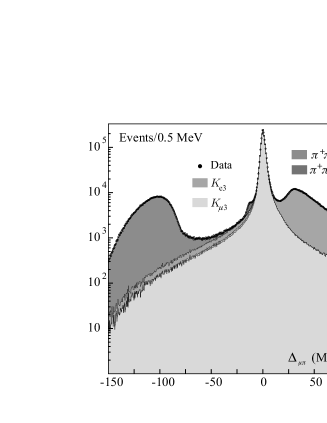
In Fig. 2 we show enriched samples of
(left) and (right) events obtained by selecting the
or by time of arrival and energy deposition in the calorimeter.
The radiative corrections which affect
mainly the decays have been properly taken
into account in the Monte Carlo
simulation .
Figure 2: (left) and (right)
distributions for data (dots) and Monte Carlo (solid histograms).
3.3 Neutral decays
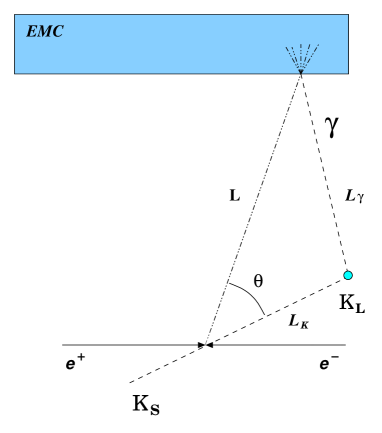
decays are selected using time of flight techniques.
In fact, the position of the vertex for
decays is measured using the photon
arrival times on the EMC.
Each photon defines a time of flight
triangle shown in Fig.3. The three sides are the
decay length, ; the distance from the decay vertex to the
calorimeter cluster centroid, ; and the distance from
the cluster to the vertex, . The equations to determine
the unknowns and are:
(3)
where is the photon arrival time on the EMC,
is the velocity and is
the angle between and .
Only one of the two solutions is kinematically correct.
The vertex position is obtained by the energy weighted average
of each measurement.
The accuracy of this method is checked with
decays, comparing the position of the decay
vertex from tracking using the pair with the one from
timing with the two photons from .
The vertex reconstructed by the calorimeter has on average an offset
of 2 mm almost uniform in the fiducial volume.
To select the events we require at least three
photons with energy greater than 20 MeV originating from the same vertex.
Figure 3: Left: the time of flight triangle.
The main sources of inefficiencies are: 1) geometrical acceptance;
2) cluster energy threshold; 3) merging of clusters; 4) accidental
association to a charged track; 5) Dalitz decay of one or more
’s. The effect of these inefficiencies is to modify the
relative population for events with 3, 4, 5, 6, 7 and ,
clusters with a loss of efficiency of .
Background contamination affects only events with three and four clusters.
The main source of background
comes from decays where one or two
charged pions produce a cluster not associated to a track
and neither track is associated to the vertex.
This background is rejected by requiring at least one cluster
with at least 50 MeV energy and a polar angle satisfying
.
Other sources of background are decays, possibly in coincidence with machine
background particles ( or ) that shower in the
QCAL and generate soft neutral particles and
following the regeneration in the drift chamber material.
3.4 Results
A total of milions of tagged are used to compute
the branching fractions, almost 40 milions to evaluate
systematic uncertainties. Using the published result of the
lifetime ( ns) we obtain the following results:
(4)
where the sources of systematic uncertainties are shown
in Table 1. The sum of all measured branching fraction above,
plus the PDG value for rare decays, 0.0036,
is
where the correlated error includes all contributions
to the uncertainties on the branching ratios that are 100 correlated
between channels, such as the uncertainty in the value of the
lifetime.
This result depends on the value of the lifetime through the
acceptance (Eq. 2).
Turning the argument around, by normalizing the sum to 1 we obtain un
indirect estimate of the lifetime:
and a new set of values for the branching fractions:
(6)
Selection
0.0011
0.0007
0.0004
0.0020
Signal Shape
0.0006
0.0009
0.0010
-
Tag Bias
0.0013
0.0008
0.0007
0.0005
lifetime
0.0023
0.0017
0.0007
0.0012
Table 1: Summary of systematic uncertainties on the absolute
branching fractions measurements.
4 Direct measurement of the lifetime
We have measured the lifetime using events of
the fully neutral decay tagged by
events. This choice is motivated by the fact that
we want to maximize the number of tagged events to reduce the
statistical error and, simultaneously, we want to
avoid any coupling among tagging and tagged events
in order to minimize the systematic uncertainty.
The sample selected for the BR measurement has been used
also for the lifetime measurement plus some additional cuts.
For lifetime measurement we must keep under control
the variation of the selection efficiency with .
Monte Carlo simulation shows that the selection efficiency
has a linear dependence with ,
(cm)
mainly due to the vertex reconstruction efficiency.
The vertex reconstruction efficiency as a function of has been checked
also using events both in data and in Monte Carlo simulation.
We find the same linear dependence as in the case with slopes
compatibles within their statistical uncertainties.
The lifetime is measured using events with
a vertex reconstructed in the region
40 cm 165 cm and with a flight direction defined by a
polar angle
with respect to the beam axis between .
These two conditions define the fiducial volume.
The proper time, , is obtained event by event dividing
the decay length by of the in the laboratory,
.
The residual background is subtracted bin by bin using Monte Carlo predictions.
The variations of the vertex reconstruction efficiency
as a function of the decay length are taken into account by correcting
bin by bin the decay vertex distribution with the efficiency
values obtained with
the Monte Carlo sample multiplied by the data - Monte Carlo ratio
of the efficiencies evaluated with sample.
The statistical uncertainty of the efficiency values
()
has been taken into account by adding it in quadrature to the statistical fluctuation
of the entries in each bin of the distribution after the background subtraction.
The distribution is fitted with an
exponential function
inside the fiducial volume,
which, in terms of proper time ranges from 6 ns to 24.8 ns. This corresponds
to a time interval expressed in lifetime units.
With events inside the fit region we obtain
ns
with a = 58 for 62 degrees of freedom.
The major sources of systematic uncertainties come from the background
evaluation, tagging and selection efficiency and from the estimate of
the nuclear interactions in the drift chamber material.
The total systematic error is . Our result is:
It is compatible at 1.3 level with the other
measurement and only at 1.7 level with the PDG
2004 fit .
Table 2: Left:
fit of the proper time distribution. Right: residuals of the fit.
5 Determination of
is proportional to the square root
of the semileptonic BR of mesons.
For decays we can write :
(8)
where is the vector form factor
at zero momentum transfer and
is the integral of the phase space density,
factoring out and without radiative corrections.
Radiative corrections at large scale of form factor and phase space density
are contained in the term
.
The short-distance electroweak corrections are included in the parameter
.
and are the slope and
curvature of the vector form factor .
From eq. 8 we see that the lifetime value enters directly
in the determination of the product .
The three most recent results are:
where the error is the sum in quadrature of the statistical and
systematic uncertainties.
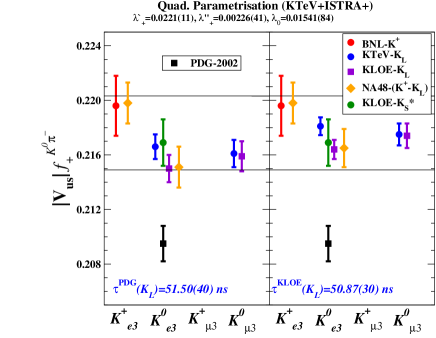
Fig. 4 (left) shows the product
extracted from the three recent measurements of using
the PDG 2004 average ns.
In the extraction of
we use the values of and
obtained by KTeV experiment from a quadratic fit .
In the same plot we show also the value
of obtained from
the KLOE preliminary measurement of
and the band from the and unitarity where we use
following Ref. .
Fig. 4 (right) shows the same product extracted using the
KLOE lifetime value, ns.
The data are now in better agreement with ones and unitarity.
Figure 4: for various
semileptonic decays.
6 Direct search of decay
The decay is a pure CP violating process.
The related CP violation parameter is defined as the
ratio of to decay amplitudes:
where describes the CP violation in the mixing matrix
and is a direct CP violating term.
In the standard model we expect to
be similar to ().
The expected branching ratio of this decay
is therefore , making its direct
observation really challenging.
The best upper limit on the BR (i.e. on ) has been set
to 1.4 by SND where,
similarly to KLOE, it is possible to tag a beam.
The other existing technique
is to detect the interference term between in the same
final state which is proportional to ,
.
The best published result
using this method comes from the NA48 Collaboration.
Fitting the interference pattern at small decay times,
they find
and
corresponding to at
C.L.
The signal selection requires a interacting with the calorimeter
and six neutral clusters coming
from the interaction point (IP). A first rejection of the huge background
coming from the decay + 2 fake
is obtained by applying a kinematic fit imposing as constraints
the mass, the 4-momentum and for each photon.
Two pseudo- variables are then built:
which is based on
the best combination into
and which selects four out of six photons providing the best
kinematic agreement with the decay.
A signal box is defined in the vs
plane by optimising the upper limit in the Monte Carlo sample.
Residual background comes from events in which one
of the two pions interacting with the quadrupoles produces a
late cluster simulating a -crash.
This background is rejected by vetoing events with two charged tracks from IP.
At the analysis end we find 2 events in the signal box with an estimated
background of .
To derive the upper limit on the number of signal counts, we build the
background probability distribution function, taking into account our
finite MC statistics and the uncertainties on the MC calibration factors.
This function is folded with a Gaussian of width equivalent to the entire
systematic uncertainty on the background. Using the Neyman construction
we limit the number of decays observed to
3.45 at 90 C. L. with a total reconstruction efficiency of
. In the same tagged
sample, we count events.
We use them as normalization. Finally, using the value
we obtain
at 90 % C.L. which represents
an improvement by a factor 6 with respect to the best previous
limit.
References
References
[1]
S. Eidelman et al., Phys. Lett. B592 (2004) 1
[2]
T. Alexopoulos et al. (KTeV Collaboration),
Phys. Rev. D70 (2004), 092006.
[3]
A. Lai et al. (NA48 Collaboration),
Phys. Lett. B602 (2004), 41.
[4] K. G. Vosburgh et al.,
Phys. Rev. Lett. 26 (1971), 866.
[5] M. Adinolfi et al., KLOE Collaboration, Nucl. Instrum. Methods A 488, 51 (2002).
[6] M. Adinolfi et al., KLOE Collaboration, Nucl. Instrum. Methods A 482, 364 (2002).
[7] C. Gatti, MC generators for radiative kaon decays,
Kloe Note 194 (2004).
http://www.lnf.infn.it/kloe/pub/knote/kn194.ps
[8] M. Battaglia et al., arXiv: hep-ph/0304132.
[9] V. Cirigliano et al., Eur. Phys. J. C23,121 (2002).
[10] V. Cirigliano et al., Eur. Phys. J. C35,53 (2004).
[11] T. Alexopoulos et al., KTeV Collaboration],
Phys. Rev. D70, 092007.
[12]
T. Spadaro,
Recent results from KLOE at DAFNE, Proceedings of
Les Rencontres de Physique de la Vallee d’Aoste,
La Thuile 2004, ed. M. Greco.
[13] H. Leutwyler, M. Roos, Z. Phys. C 25, 91 (1984).
[14] M. N. Achasov et al., SND Collaboration, Phys. Lett. B 459, 674 (1999).
[15] A. Lai et al, NA48 Collaboration, Phys. Lett. B 610
(2005) 165.
[16] G. J. Feldman and R. Cousins, Phys. Rev. D57 (1998), 57.
![[Uncaptioned image]](/html/hep-ex/0505089/assets/x5.png)
![[Uncaptioned image]](/html/hep-ex/0505089/assets/x6.png)