Measurement of the branching fraction and decay rate asymmetry of
B. Aubert
R. Barate
D. Boutigny
F. Couderc
Y. Karyotakis
J. P. Lees
V. Poireau
V. Tisserand
A. Zghiche
Laboratoire de Physique des Particules, F-74941 Annecy-le-Vieux, France
E. Grauges
IFAE, Universitat Autonoma de Barcelona, E-08193 Bellaterra, Barcelona, Spain
A. Palano
M. Pappagallo
A. Pompili
Università di Bari, Dipartimento di Fisica and INFN, I-70126 Bari, Italy
J. C. Chen
N. D. Qi
G. Rong
P. Wang
Y. S. Zhu
Institute of High Energy Physics, Beijing 100039, China
G. Eigen
I. Ofte
B. Stugu
University of Bergen, Inst. of Physics, N-5007 Bergen, Norway
G. S. Abrams
M. Battaglia
A. W. Borgland
A. B. Breon
D. N. Brown
J. Button-Shafer
R. N. Cahn
E. Charles
C. T. Day
M. S. Gill
A. V. Gritsan
Y. Groysman
R. G. Jacobsen
R. W. Kadel
J. Kadyk
L. T. Kerth
Yu. G. Kolomensky
G. Kukartsev
G. Lynch
L. M. Mir
P. J. Oddone
T. J. Orimoto
M. Pripstein
N. A. Roe
M. T. Ronan
W. A. Wenzel
Lawrence Berkeley National Laboratory and University of California, Berkeley, California 94720, USA
M. Barrett
K. E. Ford
T. J. Harrison
A. J. Hart
C. M. Hawkes
S. E. Morgan
A. T. Watson
University of Birmingham, Birmingham, B15 2TT, United Kingdom
M. Fritsch
K. Goetzen
T. Held
H. Koch
B. Lewandowski
M. Pelizaeus
K. Peters
T. Schroeder
M. Steinke
Ruhr Universität Bochum, Institut für Experimentalphysik 1, D-44780 Bochum, Germany
J. T. Boyd
J. P. Burke
N. Chevalier
W. N. Cottingham
M. P. Kelly
University of Bristol, Bristol BS8 1TL, United Kingdom
T. Cuhadar-Donszelmann
C. Hearty
N. S. Knecht
T. S. Mattison
J. A. McKenna
University of British Columbia, Vancouver, British Columbia, Canada V6T 1Z1
A. Khan
P. Kyberd
L. Teodorescu
Brunel University, Uxbridge, Middlesex UB8 3PH, United Kingdom
A. E. Blinov
V. E. Blinov
A. D. Bukin
V. P. Druzhinin
V. B. Golubev
E. A. Kravchenko
A. P. Onuchin
S. I. Serednyakov
Yu. I. Skovpen
E. P. Solodov
A. N. Yushkov
Budker Institute of Nuclear Physics, Novosibirsk 630090, Russia
D. Best
M. Bondioli
M. Bruinsma
M. Chao
I. Eschrich
D. Kirkby
A. J. Lankford
M. Mandelkern
R. K. Mommsen
W. Roethel
D. P. Stoker
University of California at Irvine, Irvine, California 92697, USA
C. Buchanan
B. L. Hartfiel
A. J. R. Weinstein
University of California at Los Angeles, Los Angeles, California 90024, USA
S. D. Foulkes
J. W. Gary
O. Long
B. C. Shen
K. Wang
L. Zhang
University of California at Riverside, Riverside, California 92521, USA
D. del Re
H. K. Hadavand
E. J. Hill
D. B. MacFarlane
H. P. Paar
S. Rahatlou
V. Sharma
University of California at San Diego, La Jolla, California 92093, USA
J. W. Berryhill
C. Campagnari
A. Cunha
B. Dahmes
T. M. Hong
A. Lu
M. A. Mazur
J. D. Richman
W. Verkerke
University of California at Santa Barbara, Santa Barbara, California 93106, USA
T. W. Beck
A. M. Eisner
C. J. Flacco
C. A. Heusch
J. Kroseberg
W. S. Lockman
G. Nesom
T. Schalk
B. A. Schumm
A. Seiden
P. Spradlin
D. C. Williams
M. G. Wilson
University of California at Santa Cruz, Institute for Particle Physics, Santa Cruz, California 95064, USA
J. Albert
E. Chen
G. P. Dubois-Felsmann
A. Dvoretskii
D. G. Hitlin
I. Narsky
T. Piatenko
F. C. Porter
A. Ryd
A. Samuel
California Institute of Technology, Pasadena, California 91125, USA
R. Andreassen
S. Jayatilleke
G. Mancinelli
B. T. Meadows
M. D. Sokoloff
University of Cincinnati, Cincinnati, Ohio 45221, USA
F. Blanc
P. Bloom
S. Chen
W. T. Ford
U. Nauenberg
A. Olivas
P. Rankin
W. O. Ruddick
J. G. Smith
K. A. Ulmer
S. R. Wagner
J. Zhang
University of Colorado, Boulder, Colorado 80309, USA
A. Chen
E. A. Eckhart
A. Soffer
W. H. Toki
R. J. Wilson
Q. Zeng
Colorado State University, Fort Collins, Colorado 80523, USA
E. Feltresi
A. Hauke
B. Spaan
Universität Dortmund, Institut fur Physik, D-44221 Dortmund, Germany
D. Altenburg
T. Brandt
J. Brose
M. Dickopp
V. Klose
H. M. Lacker
R. Nogowski
S. Otto
A. Petzold
G. Schott
J. Schubert
K. R. Schubert
R. Schwierz
J. E. Sundermann
Technische Universität Dresden, Institut für Kern- und Teilchenphysik, D-01062 Dresden, Germany
D. Bernard
G. R. Bonneaud
P. Grenier
S. Schrenk
Ch. Thiebaux
G. Vasileiadis
M. Verderi
Ecole Polytechnique, LLR, F-91128 Palaiseau, France
D. J. Bard
P. J. Clark
W. Gradl
F. Muheim
S. Playfer
Y. Xie
University of Edinburgh, Edinburgh EH9 3JZ, United Kingdom
M. Andreotti
V. Azzolini
D. Bettoni
C. Bozzi
R. Calabrese
G. Cibinetto
E. Luppi
M. Negrini
L. Piemontese
Università di Ferrara, Dipartimento di Fisica and INFN, I-44100 Ferrara, Italy
F. Anulli
R. Baldini-Ferroli
A. Calcaterra
R. de Sangro
G. Finocchiaro
P. Patteri
I. M. Peruzzi
Also with Università di Perugia, Dipartimento di Fisica, Perugia, Italy
M. Piccolo
A. Zallo
Laboratori Nazionali di Frascati dell’INFN, I-00044 Frascati, Italy
A. Buzzo
R. Capra
R. Contri
M. Lo Vetere
M. Macri
M. R. Monge
S. Passaggio
C. Patrignani
E. Robutti
A. Santroni
S. Tosi
Università di Genova, Dipartimento di Fisica and INFN, I-16146 Genova, Italy
S. Bailey
G. Brandenburg
K. S. Chaisanguanthum
M. Morii
E. Won
Harvard University, Cambridge, Massachusetts 02138, USA
R. S. Dubitzky
U. Langenegger
J. Marks
S. Schenk
U. Uwer
Universität Heidelberg, Physikalisches Institut, Philosophenweg 12, D-69120 Heidelberg, Germany
W. Bhimji
D. A. Bowerman
P. D. Dauncey
U. Egede
R. L. Flack
J. R. Gaillard
G. W. Morton
J. A. Nash
M. B. Nikolich
G. P. Taylor
Imperial College London, London, SW7 2AZ, United Kingdom
M. J. Charles
W. F. Mader
U. Mallik
A. K. Mohapatra
University of Iowa, Iowa City, Iowa 52242, USA
J. Cochran
H. B. Crawley
V. Eyges
W. T. Meyer
S. Prell
E. I. Rosenberg
A. E. Rubin
J. Yi
Iowa State University, Ames, Iowa 50011-3160, USA
N. Arnaud
M. Davier
X. Giroux
G. Grosdidier
A. Höcker
F. Le Diberder
V. Lepeltier
A. M. Lutz
A. Oyanguren
T. C. Petersen
M. Pierini
S. Plaszczynski
S. Rodier
P. Roudeau
M. H. Schune
A. Stocchi
G. Wormser
Laboratoire de l’Accélérateur Linéaire, F-91898 Orsay, France
C. H. Cheng
D. J. Lange
M. C. Simani
D. M. Wright
Lawrence Livermore National Laboratory, Livermore, California 94550, USA
A. J. Bevan
C. A. Chavez
J. P. Coleman
I. J. Forster
J. R. Fry
E. Gabathuler
R. Gamet
K. A. George
D. E. Hutchcroft
R. J. Parry
D. J. Payne
K. C. Schofield
C. Touramanis
University of Liverpool, Liverpool L69 72E, United Kingdom
C. M. Cormack
F. Di Lodovico
R. Sacco
Queen Mary, University of London, E1 4NS, United Kingdom
C. L. Brown
G. Cowan
H. U. Flaecher
M. G. Green
D. A. Hopkins
P. S. Jackson
T. R. McMahon
S. Ricciardi
F. Salvatore
University of London, Royal Holloway and Bedford New College, Egham, Surrey TW20 0EX, United Kingdom
D. Brown
C. L. Davis
University of Louisville, Louisville, Kentucky 40292, USA
J. Allison
N. R. Barlow
R. J. Barlow
M. C. Hodgkinson
G. D. Lafferty
M. T. Naisbit
J. C. Williams
University of Manchester, Manchester M13 9PL, United Kingdom
C. Chen
A. Farbin
W. D. Hulsbergen
A. Jawahery
D. Kovalskyi
C. K. Lae
V. Lillard
D. A. Roberts
G. Simi
University of Maryland, College Park, Maryland 20742, USA
G. Blaylock
C. Dallapiccola
S. S. Hertzbach
R. Kofler
V. B. Koptchev
X. Li
T. B. Moore
S. Saremi
H. Staengle
S. Willocq
University of Massachusetts, Amherst, Massachusetts 01003, USA
R. Cowan
K. Koeneke
G. Sciolla
S. J. Sekula
F. Taylor
R. K. Yamamoto
Massachusetts Institute of Technology, Laboratory for Nuclear Science, Cambridge, Massachusetts 02139, USA
H. Kim
P. M. Patel
S. H. Robertson
McGill University, Montréal, Quebec, Canada H3A 2T8
A. Lazzaro
V. Lombardo
F. Palombo
Università di Milano, Dipartimento di Fisica and INFN, I-20133 Milano, Italy
J. M. Bauer
L. Cremaldi
V. Eschenburg
R. Godang
R. Kroeger
J. Reidy
D. A. Sanders
D. J. Summers
H. W. Zhao
University of Mississippi, University, Mississippi 38677, USA
S. Brunet
D. Côté
P. Taras
B. Viaud
Université de Montréal, Laboratoire René J. A. Lévesque, Montréal, Quebec, Canada H3C 3J7
H. Nicholson
Mount Holyoke College, South Hadley, Massachusetts 01075, USA
N. Cavallo
Also with Università della Basilicata, Potenza, Italy
G. De Nardo
F. Fabozzi
Also with Università della Basilicata, Potenza, Italy
C. Gatto
L. Lista
D. Monorchio
P. Paolucci
D. Piccolo
C. Sciacca
Università di Napoli Federico II, Dipartimento di Scienze Fisiche and INFN, I-80126, Napoli, Italy
M. Baak
H. Bulten
G. Raven
H. L. Snoek
L. Wilden
NIKHEF, National Institute for Nuclear Physics and High Energy Physics, NL-1009 DB Amsterdam, The Netherlands
C. P. Jessop
J. M. LoSecco
University of Notre Dame, Notre Dame, Indiana 46556, USA
T. Allmendinger
G. Benelli
K. K. Gan
K. Honscheid
D. Hufnagel
P. D. Jackson
H. Kagan
R. Kass
T. Pulliam
A. M. Rahimi
R. Ter-Antonyan
Q. K. Wong
Ohio State University, Columbus, Ohio 43210, USA
J. Brau
R. Frey
O. Igonkina
M. Lu
C. T. Potter
N. B. Sinev
D. Strom
E. Torrence
University of Oregon, Eugene, Oregon 97403, USA
F. Colecchia
A. Dorigo
F. Galeazzi
M. Margoni
M. Morandin
M. Posocco
M. Rotondo
F. Simonetto
R. Stroili
C. Voci
Università di Padova, Dipartimento di Fisica and INFN, I-35131 Padova, Italy
M. Benayoun
H. Briand
J. Chauveau
P. David
L. Del Buono
Ch. de la Vaissière
O. Hamon
M. J. J. John
Ph. Leruste
J. Malclès
J. Ocariz
L. Roos
G. Therin
Universités Paris VI et VII, Laboratoire de Physique Nucléaire et de Hautes Energies, F-75252 Paris, France
P. K. Behera
L. Gladney
Q. H. Guo
J. Panetta
University of Pennsylvania, Philadelphia, Pennsylvania 19104, USA
M. Biasini
R. Covarelli
S. Pacetti
M. Pioppi
Università di Perugia, Dipartimento di Fisica and INFN, I-06100 Perugia, Italy
C. Angelini
G. Batignani
S. Bettarini
F. Bucci
G. Calderini
M. Carpinelli
R. Cenci
F. Forti
M. A. Giorgi
A. Lusiani
G. Marchiori
M. Morganti
N. Neri
E. Paoloni
M. Rama
G. Rizzo
J. Walsh
Università di Pisa, Dipartimento di Fisica, Scuola Normale Superiore and INFN, I-56127 Pisa, Italy
M. Haire
D. Judd
K. Paick
D. E. Wagoner
Prairie View A&M University, Prairie View, Texas 77446, USA
J. Biesiada
N. Danielson
P. Elmer
Y. P. Lau
C. Lu
J. Olsen
A. J. S. Smith
A. V. Telnov
Princeton University, Princeton, New Jersey 08544, USA
F. Bellini
G. Cavoto
A. D’Orazio
E. Di Marco
R. Faccini
F. Ferrarotto
F. Ferroni
M. Gaspero
L. Li Gioi
M. A. Mazzoni
S. Morganti
G. Piredda
F. Polci
F. Safai Tehrani
C. Voena
Università di Roma La Sapienza, Dipartimento di Fisica and INFN, I-00185 Roma, Italy
H. Schröder
G. Wagner
R. Waldi
Universität Rostock, D-18051 Rostock, Germany
T. Adye
N. De Groot
B. Franek
G. P. Gopal
E. O. Olaiya
F. F. Wilson
Rutherford Appleton Laboratory, Chilton, Didcot, Oxon, OX11 0QX, United Kingdom
R. Aleksan
S. Emery
A. Gaidot
S. F. Ganzhur
P.-F. Giraud
G. Graziani
G. Hamel de Monchenault
W. Kozanecki
M. Legendre
G. W. London
B. Mayer
G. Vasseur
Ch. Yèche
M. Zito
DSM/Dapnia, CEA/Saclay, F-91191 Gif-sur-Yvette, France
M. V. Purohit
A. W. Weidemann
J. R. Wilson
F. X. Yumiceva
University of South Carolina, Columbia, South Carolina 29208, USA
T. Abe
M. T. Allen
D. Aston
R. Bartoldus
N. Berger
A. M. Boyarski
O. L. Buchmueller
R. Claus
M. R. Convery
M. Cristinziani
J. C. Dingfelder
D. Dong
J. Dorfan
D. Dujmic
W. Dunwoodie
S. Fan
R. C. Field
T. Glanzman
S. J. Gowdy
T. Hadig
V. Halyo
C. Hast
T. Hryn’ova
W. R. Innes
M. H. Kelsey
P. Kim
M. L. Kocian
D. W. G. S. Leith
J. Libby
S. Luitz
V. Luth
H. L. Lynch
H. Marsiske
R. Messner
D. R. Muller
C. P. O’Grady
V. E. Ozcan
A. Perazzo
M. Perl
B. N. Ratcliff
A. Roodman
A. A. Salnikov
R. H. Schindler
J. Schwiening
A. Snyder
J. Stelzer
Stanford Linear Accelerator Center, Stanford, California 94309, USA
J. Strube
University of Oregon, Eugene, Oregon 97403, USA
Stanford Linear Accelerator Center, Stanford, California 94309, USA
D. Su
M. K. Sullivan
K. Suzuki
S. Swain
J. M. Thompson
J. Va’vra
M. Weaver
W. J. Wisniewski
M. Wittgen
D. H. Wright
A. K. Yarritu
K. Yi
C. C. Young
Stanford Linear Accelerator Center, Stanford, California 94309, USA
P. R. Burchat
A. J. Edwards
S. A. Majewski
B. A. Petersen
C. Roat
Stanford University, Stanford, California 94305-4060, USA
M. Ahmed
S. Ahmed
M. S. Alam
J. A. Ernst
M. A. Saeed
M. Saleem
F. R. Wappler
S. B. Zain
State University of New York, Albany, New York 12222, USA
W. Bugg
M. Krishnamurthy
S. M. Spanier
University of Tennessee, Knoxville, Tennessee 37996, USA
R. Eckmann
J. L. Ritchie
A. Satpathy
R. F. Schwitters
University of Texas at Austin, Austin, Texas 78712, USA
J. M. Izen
I. Kitayama
X. C. Lou
S. Ye
University of Texas at Dallas, Richardson, Texas 75083, USA
F. Bianchi
M. Bona
F. Gallo
D. Gamba
Università di Torino, Dipartimento di Fisica Sperimentale and INFN, I-10125 Torino, Italy
M. Bomben
L. Bosisio
C. Cartaro
F. Cossutti
G. Della Ricca
S. Dittongo
S. Grancagnolo
L. Lanceri
P. Poropat
L. Vitale
Università di Trieste, Dipartimento di Fisica and INFN, I-34127 Trieste, Italy
F. Martinez-Vidal
IFIC, Universitat de Valencia-CSIC, E-46071 Valencia, Spain
R. S. Panvini
Vanderbilt University, Nashville, Tennessee 37235, USA
Sw. Banerjee
B. Bhuyan
C. M. Brown
D. Fortin
K. Hamano
R. Kowalewski
J. M. Roney
R. J. Sobie
University of Victoria, Victoria, British Columbia, Canada V8W 3P6
J. J. Back
P. F. Harrison
T. E. Latham
G. B. Mohanty
Department of Physics, University of Warwick, Coventry CV4 7AL, United Kingdom
H. R. Band
X. Chen
B. Cheng
S. Dasu
M. Datta
A. M. Eichenbaum
K. T. Flood
M. Graham
J. J. Hollar
J. R. Johnson
P. E. Kutter
H. Li
R. Liu
B. Mellado
A. Mihalyi
Y. Pan
R. Prepost
P. Tan
J. H. von Wimmersperg-Toeller
J. Wu
S. L. Wu
Z. Yu
University of Wisconsin, Madison, Wisconsin 53706, USA
M. G. Greene
H. Neal
Yale University, New Haven, Connecticut 06511, USA
Abstract
We report the observation of the decay ,
where indicates a neutral meson detected in the final
state , excluding .
This doubly Cabibbo-suppressed decay chain can be used to measure the
CKM phase .
Using about million events recorded by the
BABAR experiment at the PEP-II storage ring, we measure the
branching fraction and the decay rate
asymmetry
for the full decay chain.
pacs:
13.25.Hw, 12.15.Hh, 11.30.Er
††preprint: 05/016††preprint: SLAC-PUB-11245
The Cabibbo-Kobayashi-Maskawa (CKM) matrix, whose element
ref:km describes the weak charged-current
coupling between
quark flavors and , provides an explanation for CP violation
in the Standard Model.
A crucial part of the program to study CP violation
is the measurement of the angle of the unitarity triangle
related to the CKM matrix.
The decays can be used to measure with
essentially no hadronic uncertainties, making use of interference
between and decay amplitudes. A
number of variations on the original method Gronau:1991dp
have been developed, and
some have been explored experimentally. Employing multiple methods
helps to resolve discrete ambiguities and decrease the experimental
error.
An important class of measurement methods involves
with multi-body decays 111We use the symbol to indicate
any linear combination of a and a meson state..
In this technique, is extracted from an analysis of the -decay
Dalitz plot, and ambiguities are resolved through interference
between several decay amplitudes Giri:2003ty .
Both Belle Abe:2003cn and BABARAubert:2004kv have used
this method to obtain limits on with the Cabibbo-favored
decay .
The same approach can be carried out with multi-body final
states that are produced by singly Cabibbo-suppressed decay of both
and Grossman:2002aq .
While these modes yield much smaller event samples, their interfering
and decay amplitudes have similar magnitudes.
Therefore, their overall sensitivity to is a priori expected
to be similar to that of Cabibbo-favored decays, where the interfering
amplitudes typically have very dissimilar magnitudes.
Among the singly Cabibbo-suppressed modes, the decay has a
relatively large branching fraction ref:pdg and a simple Dalitz
plot dominated by broad resonances Frolov:2003jf , making
it attractive for the measurement of with this technique.
Its major difficulty is the relatively small
signal-to-background ratio, which results mainly from the high
combinatorial background associated with reconstruction.
In this article, we describe an analysis procedure with which to extract
the signal for later use in a Dalitz plot analysis
measurement of ,
and report the measured branching fraction and decay rate asymmetry of
this decay chain.
Our result excludes the decay mode ,
which is a previously-studied CP-eigenstate
not related to the method of Ref. Giri:2003ty .
The decay rate asymmetry , where
() is the number of signal () decays, depends on the
weak and strong phases of the decay, as well as the and
decay rate and phase variation over the Dalitz plot. Its
magnitude is at most of order , where , estimated to be
about 0.1 Giri:2003ty , is the ratio between the magnitudes of
the interfering and amplitudes.
Due to interference, the branching fraction
may differ from the product
ref:pdg
by up to about .
The data used in this analysis were collected with the BABAR detector at the PEP-II energy-asymmetric storage ring. The data
consist of 207 fb-1 collected on the
resonance (on-resonance sample), and 21 fb-1 collected at an
center-of-mass (CM) energy approximately 40 below the
resonance peak (off-resonance sample).
Samples of simulated events were analyzed with the same
reconstruction and analysis procedure. These include an sample
about three times larger than the data; a continuum sample,
where represents a , , , or quark, with equivalent
luminosity similar to that of the data; and a signal sample about 200
times larger than what is expected in the data.
The BABAR detector, as well as the methods used for charged
and neutral particle reconstruction and identification are described in detail in Ref. ref:babar .
We select events using criteria designed to maximize the signal
branching fraction sensitivity and the reliability of the maximum
likelihood fit procedure described below.
To suppress the continuum background, we require the ratio
of the 2nd to the 0th Fox-Wolfram moments ref:R2 , computed
from the momenta of all charged particles and photon candidates not
matched to tracks, to be less than 0.50.
Charged kaon candidates are required to have a high quality particle
identification measurement and be identified using kaon
selection criteria that reduce the pion background to less than 3%.
The measured energy of photon candidates is required to be at least 30 .
Photon candidate pairs whose invariant mass is within 25 of
the nominal mass ref:pdg are combined to make
candidates, to which we perform a constrained-mass fit in order to
improve the energy and momentum resolutions. Throughout
this article, we use the symbol to refer to the harder
(higher-energy) of the two photons constituting a
candidate, and to denote the softer (lower-energy) photon.
We select candidate decays by requiring the invariant
mass to be between 1.830 and 1.895 . The resolution
is about 14 . The candidate energy and momentum resolutions
are then improved by performing a constrained mass fit.
The charged pion candidates are required to fail kaon selection
criteria.
The decay is rejected by excluding
candidate pairs whose invariant mass is between 0.489 and 0.508 .
We note that this last requirement will not be needed
when measuring with an analysis of the
Dalitz plot, where the final state
can be included as an incoherent term, as done in Ref. Frolov:2003jf .
Candidate decays are constructed by combining a
candidate with a charged kaon candidate.
Additional continuum suppression is obtained by requiring
, where is the angle between the thrust
axis calculated in the CM frame with the daughters of the
candidate and the thrust axis of the rest of the event (ROE).
For each candidate we calculate the beam-energy substituted mass
, where the total CM
energy is continuously determined from the measured PEP-II beam
energies, and is the momentum of the candidate in the CM
frame. Signal events have a Gaussian distribution that peaks at the
nominal mass with a width of about 2.7 , while
background is distributed more broadly than signal. We require .
The energy difference , where
is the CM energy of the candidate, is required to be between
and . The distribution of signal events peaks
around 0 with a width of 21 .
About 25% of the events selected have more than one
candidate. In these events, we select one candidate at random.
Random selection allows consistent studies of background suppression
variables, and degrades the signal sensitivity by only a few percent
relative to the best possible selection method.
Studying the simulated event sample selected by the above criteria, we
identify ten event types, one signal and nine background. We list
these types with the labels used to refer to them throughout the
article:
•
: events that were correctly
reconstructed. These are the only events considered to be signal.
•
: events in which the candidate is
misreconstructed, namely, some of the particles used to form the final
state do not originate in the decay of the meson.
•
: , decays,
where the decay is correctly reconstructed and the
remaining is mistaken to be the kaon.
•
: , decays, where
the candidate is misreconstructed.
The kaon candidate may be either the remaining or a particle from
the other meson in the event.
•
: , excluding
decays, with a misreconstructed candidate.
•
: and , excluding decays, with a misreconstructed
candidate.
•
: All other events with a
misreconstructed candidate.
•
: Other events with a correctly
reconstructed decay.
•
: Continuum events with a
misreconstructed candidate.
•
: Continuum events with a correctly
reconstructed decay.
The Cabibbo-favored decay chain , , which has the same final state particles as our
signal decay, does not contribute significantly to the background,
since it is suppressed by the particle identification and cuts
The majority of background events are of the type.
The combination of , , and events constitutes
the second largest background.
In order to suppress these backgrounds, we have developed two neural
networks, each of which combines several input variables that provide
separation between signal and background.
The first neural network variable is computed from input
variables that provide separation between continuum and events.
The second variable combines input variables
that separate correctly reconstructed and candidates from
misreconstructed ones. It provides separation between signal and
all misreconstructed- background.
The input variables for are
(1) the cosine of the CM angle between and the beams;
(2) ;
(3-4) the zeroth and second Legendre moments of the momentum flow of the ROE about the CM thrust axis of the candidate daughters;
(5) log of the distance along the beam direction
between the reconstructed vertex and the vertex of the ROE,
computed as in Ref. Aubert:2002ic ;
(6) log of the distance of closest
approach between the kaon track and the decay vertex, which is
calculated from the and track parameters;
(7) an integer variable calculated from the probability that the ROE contains a , determined using the lepton flavor tagging algorithm
of Ref. Aubert:2002ic .
The input variables for are
(1) the invariant mass of the candidate;
(2) the momentum in the lab frame;
(3) cosine of the decay angle ,
defined as the angle between the momentum and the
momentum of the CM frame, calculated in the rest frame;
(4) the invariant mass of , where is the
candidate reconstructed from the and any
additional photon in the event except ,
chosen such that is closest to the nominal mass;
(5) , calculated analogously to , but with
instead of ;
(6-7) cosines of the decay angles of the and the ,
calculated analogously to ;
(8) cosine of the
angle between and the thrust axis of the
final state, calculated in the rest frame;
(9) cosine of
the angle between the candidate momentum and the line
connecting the and decay vertices.
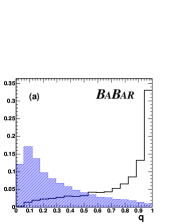
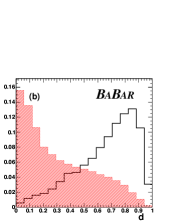
The and distributions of simulated signal and
background events are shown in Fig. 1. All events are
required to satisfy the conditions , , in
order to reduce the background and suppress correlations
between the variables used in the fit described below.
The final signal reconstruction efficiency is 10.5%.
Figure 1: (a) Distribution of the neural network variable for continuum (hatched) and signal simulated events. The
background distribution is similar to that of signal.
(b) Distribution of the neural network variable
for background
(hatched) and signal simulated events. The continuum background
distribution is similar to that of the background.
All histograms are normalized to unit area.
We perform a maximum likelihood fit to measure the number
and the decay rate asymmetry of signal
events in the on-resonance data sample, using the variables ,
, and .
The variable , which is commonly used as a fit variable in
decay analyses, is not included in the fit. Studies with simulated
events indicate that correlations of with other fit variables in
the distributions of , , and background events lead
to a bias in the measured signal yield, unless the correlations are
modeled correctly. Such modeling complicates the analysis procedure,
increases the dependence on the simulation, and incurs additional
systematic errors. By excluding
from the fit,
We give up some statistical precision in order to
make the analysis more robust. Correlations between the , , and distributions for the different event types are at the few percent
level in the worst cases, and ignoring them in fits
to simulated events does not result in significant biases.
The probability density function (PDF) for the fit is
(1)
where the subscript corresponds to one of the ten event types
listed above, is the number of events of type , and
.
The PDF for events of type is a product of the form
(2)
The functions , , and
are parameterized as second order polynomials, and all other
functions are the sum of a Gaussian and a second order
polynomial. The parameters of these functions are obtained from fits
to simulated events.
The PDFs and are
15-bin histograms obtained from simulated events.
To extract the signal yield and asymmetry, we minimize the log
of the extended likelihood
(3)
Six parameters are floating in the fit. These are
the event yields
,
,
,
and ,
the ratio ,
and the decay rate asymmetry
,
where the superscript indicates the charge of the kaon.
Five ratios of event yields are obtained from the simulation and
are not varied in the fit. From these ratios we obtain the five parameters
,
,
,
,
and .
All fixed parameters are later varied to evaluate systematic errors,
as described below.
The results of the fit are summarized in Table 1.
We observe signal events and
the decay rate asymmetry ,
where the errors are statistical only.
The corresponding branching fraction is
.
The statistical significance of the signal observation, obtained
from a scan of the likelihood as a function of the signal yield,
is 5.7 standard deviations.
The fit parameter most correlated with the signal yield is ,
with correlation matrix element .
The largest correlation matrix element for the asymmetry is .
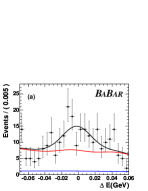
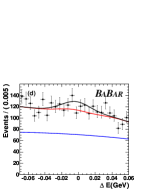
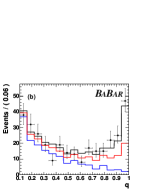
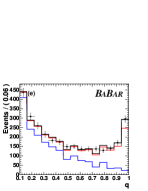
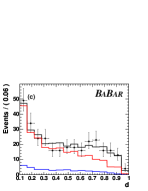
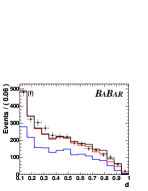
Projections of the data and the fit function onto the fit variables
are shown in Fig. 2 for events with a high likelihood
of being signal and for the entire data sample.
Table 1: Results of the data fit. Errors are statistical only.
Parameter
Value
133
23
0.02
0.16
43
16
1454
53
806
54
0.82
0.11
Figure 2: Projections of the data (data points) and fit function
onto the (a) , (b) ,
and (c) axes. The curves or histograms in each plot show, from bottom
to top, the cumulative contributions of the continuum,
background, and signal components of the fit function.
For each of the variables plotted, a
tight event selection is
applied on the other two variables with a signal efficiency of
about 50%, in order to increase the signal-to-background ratio
in these plots.
Figures (d), (e), and (f) show the same projections
for the entire data sample.
The systematic uncertainties in the signal branching fraction and asymmetry
measurements are
summarized in Table 2. We describe briefly the
procedures used for their evaluation:
(1) The statistical errors in the simulated samples used to obtain
the shapes of , , and are
propagated to the final fit.
(2) The value of is varied by ,
determined from the uncertainties on the decay modes contributing to
the background ref:pdg .
The parameters , , , and
are varied by , which is estimated to be very conservative, given
the level of data-simulation agreement.
(3) We evaluate the effect of possible differences between the
event distributions in the data and the simulation
by studying events in the sideband ,
as well as events produced in the copious decay mode .
(4) The and distributions of events are
slightly correlated, and this correlation is ignored in the PDF. To
evaluate the uncertainty due to this, we repeat the fit with
taken from simulated events in different bins.
(5) We consider the effect of a possible contribution of charmless
events, assuming
a branching fraction of .
(6) The uncertainty in the contribution of a non-resonant component
to the decay Frolov:2003jf is propagated to the
signal efficiency.
(7) We account for the possibility of charge-dependence in the track
reconstruction efficiency.
(8-9) We assign a reconstruction efficiency uncertainty of 1.4% per charged
track and 3.5% for the .
(10) We account for the uncertainty in the number of events
produced by PEP-II and (11) the uncertainty in the efficiency of the particle
identification requirements applied to the data sample.
Table 2: Fractional systematic error in the signal branching fraction
and absolute error in the asymmetry .
No.
Source
Error (%)
(1)
Simulated sample statistics
7.9
1.8
(2)
Variation of fixed yields
6.2
0.25
(3)
Data-simulation shape comparison
5.8
1.6
(4)
correlations in
1.9
0.39
(5)
Charmless branching fraction
0.85
0.093
(6)
Dalitz plot distribution
0.33
-
(7)
Detector asymmetry
-
0.90
(8)
Track reconstruction efficiency
4.2
-
(9)
efficiency
3.5
-
(10)
Number of events produced
1.1
-
(11)
Particle ID efficiency
1.0
-
Total
13
2.6
Additional cross-checks are performed to verify the validity
of our results.
We compare the fit variable distributions of the data with those of
simulated events in the sideband .
The fit variable distributions of simulated continuum events are
validated against the off-resonance data.
The simulated distributions of events are
compared with their distributions in the data.
We verify the signal efficiency by measuring the branching fraction
using decays to and .
The simulated distributions of the and input
variables are compared with the distributions in the data.
In all cases, good agreement between simulation and data is observed.
No significant excess of signal events is found in
a fit to data events in the sidebands and .
We conduct fits to event samples containing simulated signal and
background events and find no significant biases in all the fit variables.
Fits to parameterized experiments generated with the
parameter values obtained in the data fit are unbiased, and
their distributions of fit parameter errors and
maximum likelihood are consistent with those of the data fit.
In summary, using a sample of million events
we observe
events in the decay chain , where the final state
excludes the CP-eigenstate .
We extract the branching fraction and decay rate asymmetry
(4)
where the first errors are statistical and the second are systematic.
The level of background suppression we achieve is critical for
using this mode to measure . The
remaining background doubles the statistical error on with respect to the
no-background case.
We are grateful for the
extraordinary contributions of our PEP-II colleagues in
achieving the excellent luminosity and machine conditions
that have made this work possible.
The success of this project also relies critically on the
expertise and dedication of the computing organizations that
support BABAR.
The collaborating institutions wish to thank
SLAC for its support and the kind hospitality extended to them.
This work is supported by the
US Department of Energy
and National Science Foundation, the
Natural Sciences and Engineering Research Council (Canada),
Institute of High Energy Physics (China), the
Commissariat à l’Energie Atomique and
Institut National de Physique Nucléaire et de Physique des Particules
(France), the
Bundesministerium für Bildung und Forschung and
Deutsche Forschungsgemeinschaft
(Germany), the
Istituto Nazionale di Fisica Nucleare (Italy),
the Foundation for Fundamental Research on Matter (The Netherlands),
the Research Council of Norway, the
Ministry of Science and Technology of the Russian Federation, and the
Particle Physics and Astronomy Research Council (United Kingdom).
Individuals have received support from
CONACyT (Mexico),
the A. P. Sloan Foundation,
the Research Corporation,
and the Alexander von Humboldt Foundation.
References
(1) N. Cabibbo, Phys. Rev. Lett. 10,
531 (1963);
M. Kobayashi and T. Maskawa,
Prog. Theoret. Phys. 49, 652 (1973).
(2)
M. Gronau and D. Wyler,
Phys. Lett. B 265, 172 (1991).
(3)
A. Giri, Y. Grossman, A. Soffer and J. Zupan,
Phys. Rev. D 68, 054018 (2003).
(4)
The Belle Collaboration, K. Abe et al.,
arXiv:hep-ex/0308043;
The Belle Collaboration, A. Poluektov et al.,
Phys. Rev. D 70, 072003 (2004).
(5)
The BABAR Collaboration, B. Aubert et al.,
arXiv:hep-ex/0408088.
(6)
Y. Grossman, Z. Ligeti, and A. Soffer,
Phys. Rev. D 67, 071301(R) (2003).
(7)
The Particle Data Group Collaboration, S. Eidelman et al.,
Phys. Lett. B 592, 1 (2004).
(8)
The CLEO Collaboration, V. V. Frolov et al.,
arXiv:hep-ex/0306048.
(9)
The BABAR collaboration, B. Aubert et al.,
Nucl. Instrum. Meth. A 479, 1 (2002).
(10) G.C. Fox and S. Wolfram, Phys. Rev. Lett. 41,
1581 (1978).
(11)
The BABAR Collaboration, B. Aubert et al.,
Phys. Rev. Lett. 89, 201802 (2002).