RESULTS FROM THE SALT PHASE OF SNO
The Sudbury Neutrino Observatory (SNO) has recently completed an analysis of data from the salt phase of the experiment, in which NaCl was added to the heavy-water neutrino target to enhance sensitivity to solar neutrinos. Results from the 391-day salt data set are summarized, including the measured solar neutrino fluxes, the electron energy spectrum from charged current interactions, and the day-night neutrino flux asymmetries. Constraints on neutrino mixing parameters including the new measurements are also given.
1 Introduction
The Sudbury Neutrino Observatory (SNO) is a heavy water Cherenkov detector located 2092 m underground near Sudbury, Ontario. The neutrino target consists of 1000 tonnes of ultra-pure D2O housed in a clear acrylic vessel 12 m in diameter. SNO detects the neutrinos from 8B decays in the sun through three reactions:
| (1) |
The charged current reaction is sensitive only to electron neutrinos, while the neutral current reaction is sensitive to any active flavor, , . The elastic scattering reaction has some sensitivity to non-electron flavors, but is primarily sensitive to electron neutrinos. The NC reaction in SNO allows a measurement of the total flux of all active 8B solar neutrinos, while a comparison of the neutrino fluxes measured through the NC and CC reactions tests for solar neutrino flavor change.
Cherenkov radiation from the electrons produced in the CC and ES reactions is detected in an array of approximately 9500 photomultiplier tubes (PMTs). The neutrons liberated in the NC reaction must be detected through a secondary capture reaction. The SNO experiment was designed to run in three phases, incorporating three distinct neutron capture signatures to ensure a robust NC measurement. In each phase, the neutron response features, systematic uncertainties, background characteristics, and analysis techniques differ. In the first phase of the experiment, neutrons were detected using the 6.25 MeV gamma signature from neutron capture on deuterium. Results from the first phase confirmed solar model predictions of the 8B flux, demonstrated solar neutrino flavor change, and contributed to determination of the underlying neutrino oscillation parameters.
In the second phase of the experiment, ultra-pure salt (NaCl) was dissolved in the D2O, to a concentration of ( by weight. The higher cross section for neutron capture on 35Cl and the higher energy (8.6 MeV) released in the reaction improve SNO’s efficiency for detecting NC neutrons. In addition, the multiple gammas produced in the 35Cl capture reaction result in a more isotropic distribution of Cherenkov light relative to the distribution of light in single-electron events. Using the isotropy of light produced in a neutrino event, the CC and NC signals can be statistically separated without requiring constraints on the solar neutrino energy spectrum. First neutrino flux results for 254 days of salt data were published in 2004. Results for the 391-day salt data set have recently been reported and are summarized in this article.
Finally, the third phase of the SNO experiment began in the fall of 2004, following the deployment of 36 strings of 3He proportional counters and 4 strings of 4He proportional counters inside the heavy water volume. Neutron capture in the 3He counters allows an event-by-event determination of the NC rate, completely decoupled from the PMT detection of the CC and ES signals.
2 Data Analysis in the Salt Phase
The effect of the added salt on SNO’s neutron detection efficiency is illustrated in figure 1(a), which shows the neutron capture efficiency for a 252Cf calibration source as a function of the radial position of the source in the detector volume. Accounting for the fiducial volume and energy cuts used in the solar neutrino analysis, the neutron capture efficiency in the salt phase is 40.7%, compared to 14.4% in the pure-D2O phase. The higher energy of neutron capture events in the salt phase also boosts the NC signal further above the analysis energy threshold. A Monte Carlo comparison of the energy spectrum for neutrons in the salt and pure-D2O phases is shown in figure 1(b).
A fiducial volume cut of 550 cm and an analysis energy threshold of MeV are used to reduce the number of background events in the final salt event sample, where is the effective electron kinetic energy for the event, MeV. The final data set consists of 4722 events recorded over 391.4 days of detector live time between July 2001 and August 2003. This data set contains some remaining backgrounds as well as neutrino interaction events. The dominant background in SNO is neutrons from the photodisintegration of deuterium by gammas with energies above 2.2 MeV. Radioactive contaminants from the U and Th decay chains are the primary source of these gammas, which can originate within the D2O or in the acrylic vessel and external regions of the detector. The total contribution of neutron backgrounds from inside the D2O region is determined, using a variety of in-situ and ex-situ techniques, to be events. Additionally, an estimated events in the salt data set are gamma rays from the products of atmospheric neutrino interactions. These “internal” neutron and gamma backgrounds are held fixed in the statistical signal extraction process that is used to determine the CC, NC, and ES reaction rates. Neutrons and gamma rays produced outside the D2O region can also propagate into the fiducial volume. Neutron backgrounds due to these “external” sources will have a characteristic radial profile that can be used to distinguish them from signal neutrons.
To extract the numbers of CC, NC, ES, and external neutron (EN) events in the data set, event distributions in several variables are fit to characteristic signal distributions derived from Monte Carlo calculations. The event variables used are the effective electron kinetic energy , the radius of the reconstructed event vertex , the cosine of the angle between the reconstructed event direction and a vector from the sun , and a parameter characterizing the light isotropy in the event, . The parameter is based on Legendre polynomials in terms of the angle between each pair of hit PMTs relative to the event vertex. Events with a more isotropic distribution of light have smaller values of .
Detailed Monte Carlo simulations are used to generate probability density functions (PDFs) characterizing signal distributions in these variables. These PDFs are shown in figure 2. In a statistical fit, the isotropy distributions provide a powerful tool for distinguishing neutrons from CC and ES events, the direction distributions help to identify the ES contribution, and the radial distributions separate the external neutron background.
The energy distribution shown for the CC signal assumes an undistorted 8B neutrino spectrum. To make measurements that are independent of model assumptions about the energy spectrum, we can extract the CC and ES signals separately in each energy bin. In such an “energy unconstrained” analysis, the extracted CC spectrum can be used to test models of neutrino oscillation. This model-independent signal extraction is possible because of the power of the distribution for separating event classes in salt. In the D2O phase, the CC and ES spectra had to be constrained to break statistical correlations between the signals.
3 Systematic Uncertainties
Systematic uncertainties in detector response are evaluated through comparisons of Monte Carlo simulations and calibration data. The primary calibration sources used to study systematic uncertainties are a 16N 6.13 MeV gamma-ray source and a 252Cf fission neutron source. The 16N source is used to study energy response, event reconstruction performance, and detector stability over time. The 252Cf source is used to evaluate neutron response characteristics. Systematic uncertainties are propagated by perturbing the PDFs according to the estimated 1 variation in each response parameter, and then repeating the signal extraction process.
The dominant systematic uncertainties on the CC and NC extracted fluxes in the energy-unconstrained analysis are due to uncertainty in the parameter. Uncertainties of less than a percent in the mean isotropy values translate to uncertainties of around 4% in the CC and NC fluxes. The energy scale uncertainty in the salt phase is estimated to be 1.15%, which contributes an uncertainty of around 3.5% in the NC flux, but has a smaller effect on the CC and ES fluxes. An uncertainty of 1% in radial reconstruction accuracy is also one of the larger contributions to the overall systematic error, resulting in a % uncertainty in each flux. The ES flux uncertainty is dominated by a 5% systematic uncertainty due to uncertainty in angular resolution. A much more detailed discussion of calibrations and systematic uncertainties can be found in the recent salt phase publication.
4 Solar Neutrino Flux Results from an Energy-Unconstrained Analysis
From an energy-unconstrained extended maximum likelihood fit to extract the contributions of each signal to the data set, the number of NC events is , the number of CC events is , and the number of ES events is . The external neutron background is events. Accounting for acceptance factors and detector live time, we can convert these extracted event numbers into equivalent fluxes of 8B solar neutrinos, in units of ,
| (2) |
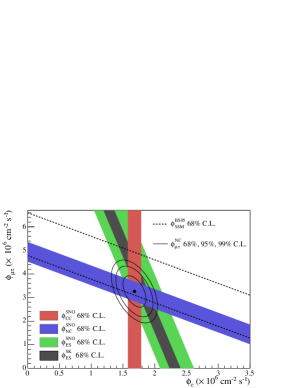
The flavor composition of 8B solar neutrinos detected by SNO is summarized in figure 3, which also shows comparisons to the ES flux measured by the Super-Kamiokande experiment and the Standard Solar Model predicted total flux. The best-fit point indicates the appearance of non-electron neutrino flavors in the solar neutrino flux.
5 Charged Current Spectrum and Day-Night Asymmetries
The favored model for explaining solar neutrino flavor change invokes matter-enhanced neutrino oscillation in the solar interior, through the so-called Mikheyev-Smirnov-Wolfenstein (MSW) effect. In addition to predicting solar neutrino flavor change, the MSW effect has two other predictions that are potentially testable in SNO. Matter effects in the sun could distort the energy spectrum of solar neutrinos, and additional matter effects in the earth could affect the flavor composition of neutrinos that pass through terrestrial material before reaching a detector. The energy-unconstrained analysis of SNO’s salt phase data allows an extraction of the CC electron energy spectrum, which can be used to test for spectrum distortions. Matter effects in the earth can be tested by looking for day-night asymmetries in the rate of charged current interactions.
For both the spectrum and day-night analyses, a number of differential systematic uncertainties were evaluated. Calibration sources were used to study energy-dependent systematic effects. In-situ techniques using low-energy backgrounds and secondary products from cosmic-ray muon interactions were used to study diurnal variations for the day-night analysis.
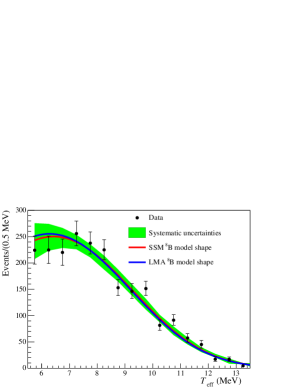
The extracted CC energy spectrum is shown in figure 4, with statistical uncertainties. Systematic uncertainties are shown with respect to the prediction assuming an undistorted 8B solar neutrino spectrum. The measured spectrum is consistent with no distortions, and is also consistent with the spectrum predicted by the best-fit MSW model, corresponding to the so-called Large Mixing Angle (LMA) region of the neutrino oscillation parameter space.
To search for day-night effects, we construct asymmetry parameters in terms of the measured day and night fluxes, , where = CC, NC, ES. The asymmetries determined in an energy-unconstrained analysis of the salt phase data are
| (3) |
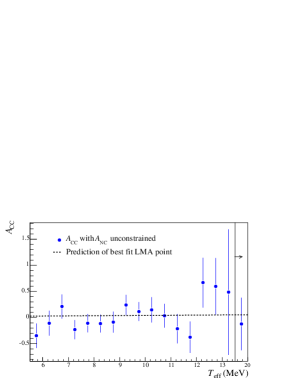
All asymmetries are consistent with zero. The extracted day and night CC spectra from this analysis can be used to construct the CC asymmetry as a function of energy, shown in figure 5. Neutrino oscillation parameters in the LMA region predict very small day-night asymmetries, and a comparison to the LMA predicted asymmetry is shown in the figure.
Since an asymmetry in the NC rate is not expected for standard neutrino oscillations, a statistically significant NC asymmetry would be evidence for sterile neutrinos or exotic physics. Within the standard neutrino oscillation picture, we can constrain the neutral current asymmetry to be zero to reduce the statistical correlations in the extraction of the day-night asymmetries. With this additional constraint, the asymmetries become
| (4) |
Repeating this analysis with the assumption of an undistorted 8B neutrino energy spectrum further reduces the uncertainties, and allows the salt phase charged-current asymmetry to be combined with the energy-constrained asymmetry results from the first phase of SNO. The combined day-night asymmetry from both phases is (stat.+syst.). The day-night asymmetry results from SNO are consistent with no asymmetry, and also with the best-fit MSW model, which predicts an asymmetry of %.
6 MSW Parameter Constraints
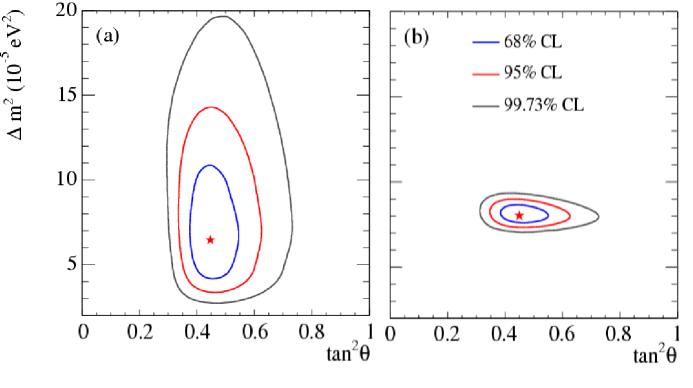
The salt phase results for the fluxes, spectra, and day-night asymmetries can be combined with SNO’s previous results and the results of other solar neutrino experiments to produce constraints on the fundamental neutrino parameters in the MSW model. Figure 6(a) shows the results of a global chi-squared analysis in a two-neutrino oscillation framework, including SNO’s salt phase and D2O phase data as well as results from Chlorine and Gallium experiments and the Super-Kamiokande experiment . The best-fit point is , . Including the results from the KamLAND experiment gives the contours shown in figure 6(b). The best fit point for the global analysis including the KamLAND data is , .
7 Conclusions
Solar neutrino results from the salt phase of the SNO experiment have been summarized in this paper. These results include measurements of the flux of 8B solar electron neutrinos through the CC reaction, and of the flux of 8B solar neutrinos of all active flavors through the NC reaction. Use of the isotropy parameter in the salt phase allows NC and CC events to be statistically separated without any assumptions about the underlying neutrino energy spectrum. The new flux results confirm and improve previous results, demonstrate solar neutrino flavor change, and contribute to evidence for solar neutrino oscillations.
Salt phase results also include the first presentation of the extracted charged current electron energy spectrum with statistical and systematic uncertainties fully evaluated. This spectrum is consistent with the spectrum predicted for an undistorted 8B neutrino spectrum, and is also consistent with the spectrum predicted by the best-fit MSW model. Day-night asymmetries have been constructed to test for possible MSW effects in the earth. Measured asymmetries are consistent with zero, and also with the predictions for the best-fit MSW model. A global analysis of the salt phase results along with other solar and reactor neutrino measurements has been performed, giving best-fit values of ,. More details as well as additional results can be found in the recent salt phase publication.
Acknowledgments
This research was supported by: Canada: Natural Sciences and Engineering Research Council, Northern Ontario Heritage Fund, Atomic Energy of Canada, Ltd., Ontario Power Generation, High Performance Computing Virtual Laboratory, Canada Foundation for Innovation; US: Dept. of Energy, National Energy Research Scientific Computing Center; UK: Particle Physics and Astronomy Research Council.
References
References
- [1] The SNO Collaboration, Nucl. Instr. and Meth. A449, 172 (2000).
- [2] The SNO Collaboration, arXiv:nuclex/0502021, submitted to Phys. Rev. C , (2005).
- [3] The SNO Collaboration, Phys. Rev. Lett. 87, 071301 (2001).
- [4] The SNO Collaboration, Phys. Rev. Lett. 89, 011301 (2002).
- [5] The SNO Collaboration, Phys. Rev. Lett. 89, 011302 (2002).
- [6] The SNO Collaboration, Phys. Rev. Lett. 92, 181301 (2004).
- [7] S. Fukuda et al. Phys. Lett. B 539, 179 (2002)
- [8] J. N. Bahcall and M.H. Pinsonneault, Phys. Rev. Lett. 92, 121301 (2004).
- [9] B. Cleveland et al., Astrophys. J. 496, 505 (1998).
- [10] V. Gavrin, Results from the Russian American Gallium Experiment (SAGE), VIIIth International Conference on Topics in Astrophysics and Underground Physics (TAUP 2003), Seattle, September 5-9, 2003; J.N. Abdurashitov et al., J. Exp. Theor. Phys. 95, 181 (2002); the latest SAGE results were presented by C. Cattadori, Results from Radiochemical Solar Neutrino Experiments, XXIst International Conference on Neutrino Physics and Astrophysics (Neutrino 2004), Paris, June 14-19, 2004.
- [11] E. Bellotti, The Gallium Neutrino Observatory (GNO) VIIIth International Conference on Topics in Astrophysics and Underground Physics (TAUP 2003), Seattle, September 5-9, 2003; M. Altmann et al. Phys. Lett. B 490, 16 (2000); W. Hampel et al. Phys. Lett. B 447, 127 (1999).
- [12] K. Eguchi et al., Phys. Rev. Lett. 90, 021802 (2003).
- [13] T. Araki et al., Phys. Rev. Lett. 90, 081801 (2005).