Search for the decay
in the momentum region MeV/
Abstract
We have searched for the decay in the kinematic region with momentum close to the end point. No events were observed, and the 90% confidence-level upper limit on the partial branching ratio was obtained, (, MeV/) under the assumption of chiral perturbation theory including next-to-leading order “unitarity” corrections. The same data were used to determine an upper limit on the branching ratio of at the 90% confidence level.
keywords:
kaon rare decay , chiral perturbation theory , unitarity corrections , noncommutative theoriesPACS:
13.20.Eb , 12.39.Fe , 11.10.NxBNL/73917-2005-JA, IHEP/2005-8, KEK/2005-8, TRIUMF/TRI-PP-05-07, TUHEP/EX-05-001
, , , , , , , , , , , , , , , , , , , , , , , , , , , , , , , , , , , , , , , , , , , , , , , , , , , , , , , , , , ,
We report the results of a search for the rare decay in the momentum region MeV/ from the E949 experiment [1] at the Alternating Gradient Synchrotron (AGS) of Brookhaven National Laboratory. The first observation of the decay in the momentum region 100–180 MeV/ was reported [2] by the E787 experiment at the AGS with a partial branching ratio of (, 100 MeV/ 180 MeV/) = . In the region 215 MeV/ no decays were observed and, assuming a pure phase-space kinematic distribution, a 90% confidence-level (C.L.) upper limit of was set on the total branching ratio [2]. This established that the background to the rare decay [3] was negligible.
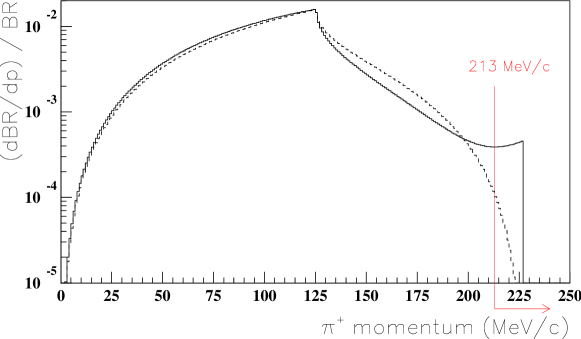
In an effective-field approach to low-energy hadronic interactions called chiral perturbation theory (ChPT) [4], there is no (“tree-level”) contribution to or its neutral counterpart ; the leading contributions start at [5]. For , both the branching ratio and the spectrum shape at are sensitive to the undetermined coupling-constant ĉ. There is no complete calculation at the next-to-leading order, . The dominant effects [6] are one-loop “unitarity” corrections, deduced from an empirical fit to the decay amplitude of and containing the same constant ĉ, and vector-meson exchange. In vector-meson exchange is expected to be negligible compared to unitarity corrections. The corrections result in a slightly different prediction for the spectrum (Fig. 1). Separate fits to the measured spectrum from [2] with and without the unitarity corrections yielded ĉ = and ĉ = , respectively, but slightly preferred their inclusion. For , the amplitude at is determined without any undetermined coupling-constant, but the measured branching ratio, [7], is twice as large as predicted at ; the vector-meson contribution in the next-to-leading order calculation (sometimes parametrized by an effective coupling constant ) is considered to be important to this decay [8].
One of the consequences of the unitarity corrections to is a non-zero amplitude in the kinematic region close to the end point of 227 MeV/, where the two-photon invariant mass 0 MeV/, as shown in Fig. 1. The partial branching ratio (, MeV/), corresponding to 108 MeV/, is predicted to be for ĉ = including unitarity corrections and for ĉ = without the corrections. Observation of the decay at a partial branching ratio larger than predicted would indicate the contribution of vector-meson exchange or other new dynamics to . The kinematic region close to the end point in is known to be crucial to understand the CP-conserving component to the decay through the amplitude, but experimental results on in [9, 10] are inconsistent (see Ref. [11, 12] for theoretical discussions).
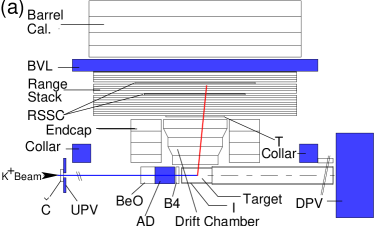
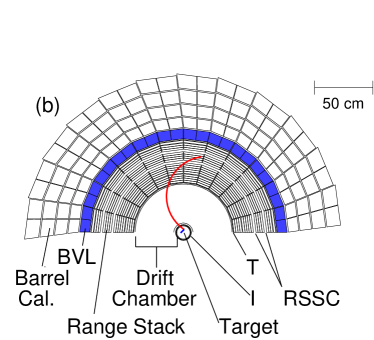
E949 was designed primarily to measure the decay [13]. The AGS delivered kaons of 710 MeV/ to the experiment at a rate of per 2.2-s spill. Kaons, detected and identified by Čerenkov, tracking, and energy-loss counters, were slowed by BeO and active degraders, and came to rest and decayed in a scintillating-fiber target. The exposure of kaons in each spill was recorded by a scaler which counted the number of kaons entering the target during the time the data acquisition system was ready to accept data. Fig. 2 shows a diagram of the apparatus. Measurements of charged decay products were made using the target, a central drift chamber, and a cylindrical range stack (RS) composed of 18 layers of plastic scintillator with two embedded layers of tracking chambers. The RS counters in the first layer (T-counters in Fig. 2) were 0.635-cm thick and 52-cm long; the subsequent RS counters were 1.905-cm cm thick and 182-cm long. The pion from the decay was identified by observation of the decay sequence in the RS using 500-MHz waveform digitizers based on flash analogue-to-digital converters [14]. Trigger counters surrounding the target (I-counters in Fig. 2 which were 0.64-cm thick) and the T-counters surrounding the drift chamber defined the fiducial region. Counters (0.95-cm thick) surrounding the RS helped to suppressed the muons from and decays by identifying long-range muons that had completely traversed the RS. A hermetic calorimeter system surrounded the central region. The photons from were detected in a lead/scintillator sandwich barrel detector (BV) surrounding the RS, while two endcap calorimeters and other subsystems (collar, “UPV”, “AD”, and “DPV” in Fig. 2) were used for detecting extra particles. A solenoid surrounding the BV provided a 1 T magnetic field along the beam line.
The AGS proton-beam intensity, and the E949 beam line and apparatus were improved over those used in E787 [15] for the study, which was performed in 1991111 Many of the improvements were made in the E787 apparatus after 1991.. The new beam line [16] incorporated two stages of electrostatic particle separation which improved the acceptance for kaons as well as the to ratio. The target, central drift chamber, and RS tracking chambers were replaced by a new target consisting of 0.5-cm square fibers, a new low-mass drift chamber [17], and straw-tube chambers, respectively. One third of the RS scintillation counters were replaced to increase the light output. A new photon detector, the barrel veto liner (BVL), was installed to add 2.3 radiation lengths of lead/scintillator sandwich material to the BV. The endcaps were replaced by new fully active detectors consisting of undoped-CsI crystals [18] with significantly increased light output, and both the target and endcaps were read out using 500-MHz waveform digitizers based on charged coupled devices [19] to improve timing and double-pulse resolution. Additional ancillary photon-veto systems [20] and a flasher system of Light Emitting Diode to aid in the RS energy calibration were also introduced.
The 2002 data set used for this analysis derived from a total exposure of kaons entering the target . The trigger required a kaon at rest in the target to decay at least 1.5 ns later into a positively charged particle which subsequently came to rest in the RS, accompanied by coincident electromagnetic showers in both the BVL and BV, and no extra energy in the endcap or RS counters. The decay particle was required to penetrate the RS to at least the 16th layer to suppress backgrounds from the monochromatic decay ( ) with P=205 MeV/c, and no further than the 17th layer to suppress decays into muons. In the RS counter where the particle came to rest, called the “stopping counter”, a decay was identified online based on the pulse shape information from the waveform digitizers on the RS. An improved trigger system [21] including a programmable trigger board reduced the online dead time. A total of events met the trigger requirements.
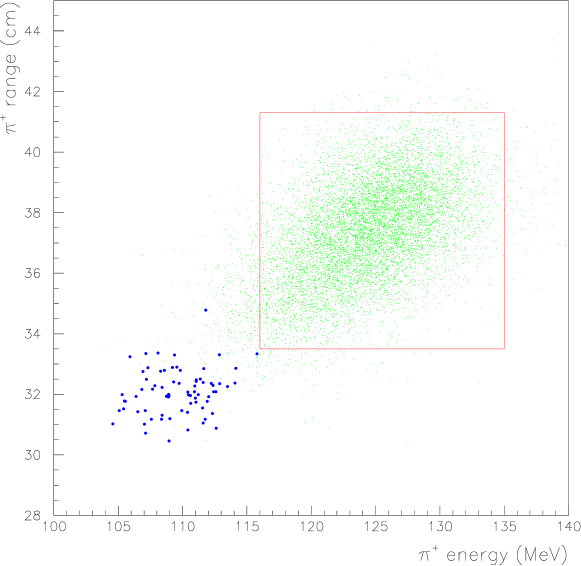
The momentum, equivalent range in plastic scintillator (), and kinetic energy () of the charged track were reconstructed with information from the target, drift chamber and RS. Tracks were accepted for the region defined by 213 MeV/ 234 MeV/, 33.5 cm 41.3 cm, and 116 MeV 135 MeV, where the lower limits corresponded to 3.3, 2.3, and 2.6 standard deviations, respectively, above the peak ( MeV/, cm, and MeV). The larger search region ( 213 MeV/) compared with E787 ( 215 MeV/) resulted from improved kinematic reconstruction, which also removed the requirement of a constrained fit for consistency with kinematics that was used in E787 [2].
The timing and energy () of the photons were determined by grouping adjacent hit modules in the BVL and BV to classify isolated photon showers (“clusters”). The hit position in each module along the beam axis () was calculated from the end-to-end time and energy differences; the azimuthal angle () of the hit position in the end view of the detector was determined by the segmentation of the modules. The location of the photon shower in and was obtained by an energy-weighted average of the hit positions and was used, in conjunction with the kaon-decay vertex position in the target, to determine the polar and azimuthal angles of the photon as well as the opening angles between the photon and the charged track in the side view () and in the end view (). In approximately half of the decays the two photons were unresolved and appear as a single cluster in the BVL and BV, since the opening angle between two photons from gets smaller for the events with momentum close to the kinematic end point. The events with either one or two clusters were accepted; at least one cluster with 50 MeV 320 MeV, 155∘, and 155∘ was required. For events with two clusters, the lower-energy cluster had to have 10 MeV.
Background sources from kaon decays at rest were classified into three types:
- “”
-
: decays with mismeasurements of the and the two photons,
- “”
-
: decays with the lower-energy photon overlapping the track in the RS, causing the kinetic energy of reconstructed track to be incorrectly measured, and
- “”
-
: decays with a misidentified as a and with photons in the final state (e.g. , and with decay in flight).
Another background source was due to kaon decay in flight:
- “”
-
: decay-in-flight before the kaon came to rest in the target.
Beam-related backgrounds (e.g. multiple beam particles scattering into the detector) were found to negligible.
These backgrounds were studied from the data by imposing offline selection criteria (“cuts”). The requirements on the momentum, range and kinetic energy provided large suppression of all of the backgrounds from kaon decays at rest. Several cuts, referred to as “ selection cuts”, were imposed to suppress the background. These included cuts on the following quantities:
-
•
the cut on the invariant mass of two photons to reject events with two clusters and 100 MeV/,
-
•
the cut on additional coincident energy to reject events with activity not associated with the and the candidate signal photons222 The extra activity was identified in the various subsystems, including the RS, as hits in the counters in coincidence with the track within a few ns and with energy above a threshold of typically 1 MeV., and
-
•
the cut on the photon clusters to reject events with two photons from a which hit the same or adjacent modules in BVL and BV and form a single cluster333 Due to the kinematics of and subsequent decays, the two photons must hit the modules at different positions along the beam axis. An event was rejected if the maximum discrepancy among the -position measurements in the modules of the cluster was larger than 113 cm. [22].
In addition, only those events whose total photon-shower energy was deposited in the BVL and BV calorimeters were accepted. Cuts on in the RS to reject events with a RS counter in which the measured energy was larger than expected from the reconstructed range in that counter were imposed to suppress the background [22]. The cuts on the relation between the range measured in the RS and the momentum measured in the drift chamber as well as the cuts on the decay sequence, recorded in the RS stopping counter, were also imposed to suppress the background. The background was suppressed by requiring a delay of at least 2 ns between the time of the kaon coming to rest in the target and its subsequent decay, and by imposing the cuts on the timing between the in the RS and the in the Čerenkov counter.
To study and measure these backgrounds, two independent sets of cuts were established for each background source. At least one of these cuts was inverted to enhance each background collected by the trigger as well as to prevent candidate events from being examined before the background studies were completed. To avoid contamination from other background sources, all the cuts except for those being studied were imposed on the data. Possibilities of a correlation between the two sets of cuts or of a biased estimate of the effectiveness of the cuts were studied, and were found to be negligible. The signal acceptance and background levels were studied as a function of cut severity. A comparison of the observed background levels near but outside the signal region was made to the predicted background in these regions. All of these studies [23] were performed in the same manner as the analyses of E787 [24] and E949 [13]. Table 1 summarizes the background levels measured with the final analysis cuts and the two sets of cuts for studying each background source. In total, background events were expected in the signal region.
The acceptance () and the single event sensitivity () for in the kinematic region MeV/ were derived from the acceptance factors in Table 2 and the total kaon exposure times the -stopping efficiency, which is the fraction of kaons entering the target that came to rest before decaying. The efficiency was measured to be with the events collected with the trigger and selected using all the analysis cuts except those designed to remove events. Thus the sensitivity for was normalized to and many systematic uncertainties in the measurement of the acceptance factors, in particular in the trigger acceptance, canceled. We obtained and for ĉ = 1.8 including unitarity corrections and and for ĉ = 1.6 without the corrections. The former sensitivity was below the predicted branching ratio of , giving an expectation of 1.6 events. In order to verify that the sensitivity estimations were correct, a sample of decays accumulated with a calibration trigger was analyzed. The branching ratio of measured with the same -stopping efficiency was consistent with the Particle Data Group value [7]. The systematic uncertainty in the sensitivity was estimated to be less than 10%.
After imposing all analysis cuts, no events were observed in the signal region (Fig. 3). The group of 74 events around cm and MeV are due to the background. Taking 2.24 events instead of zero according to the unified approach [25] with the background contribution of 0.197 events, we set a 90% C.L. upper limit on the partial branching ratio (, MeV/) as for ĉ = 1.8 including unitarity corrections and for ĉ = 1.6 without the corrections. The systematic uncertainty was not taken into consideration in deriving the limits. For the purpose of comparison with the previous E787 results, a 90% C.L. upper limit for the total branching ratio assuming the phase-space distribution was calculated; the present limit is times lower than the same limit in E787 ( ).
The data described above were also used to set an upper limit on the branching ratio for decay, which is forbidden by angular-momentum conservation and gauge invariance, but is allowed in noncommutative theories [26]. The signature of was a two-body decay of a kaon at rest with a 227-MeV/ track in the RS and a 227-MeV photon emitted directly opposite to it and observed in the BVL and BV calorimeters. The trigger, event reconstruction, and offline selection criteria in the study of had been designed so that the same data were available to the search for . Since the background levels were already small, the accepted region was not reduced for the analysis. The previous limit from the E787 study was [22] (90% C.L.) from data collected in 1996–1997 with a highly prescaled trigger with relaxed trigger-conditions resulting in the total kaon exposure of . The new 90% C.L. upper limit from E949, using the acceptance for of , is .
The results from this study cannot confirm nor rule out the unitarity corrections of ChPT, but the upper limits obtained are the the most restrictive yet achieved on and as well as on . The E949 experiment has been shown to be suitable for the study of in the momentum region close to the end point. The experimental uncertainty is limited by statistics; additional data is required to more stringently test the predictions of ChPT for this decay. The possibility to observe the decay in the kinematic region, if the ChPT including unitarity corrections is correct, gives further impetus for additional data collection.
References
- [1] B. Bassalleck et al., E949 Proposal, BNL-67247, TRI-PP-00-06 (1999), [http://www.phy.bnl.gov/e949/] .
- [2] P. Kitching et al., Phys. Rev. Lett. 79 (1997) 4079.
- [3] A.J. Buras, F. Schwab, and S. Uhlig, hep-ph/0405132, and references therein.
- [4] J.F. Donoghue, E. Golowich, and B.R. Holstein, Dynamics of the Standard Model (Cambridge University Press, Cambridge, 1992), and references therein.
- [5] G. Ecker, A. Pich, and E. de Rafael, Phys. Lett. B 189 (1987) 363; Nucl. Phys. B 303 (1988) 665; L. Cappiello and G. D’Ambrosio, Nuovo Cimento A 99 (1988) 155.
- [6] G. D’Ambrosio and J. Portolés, Phys. Lett. B 389 (1996) 770; Nucl. Phys. B 492 (1997) 417; Nucl. Phys. B 533 (1998) 494.
- [7] Particle Data Group, S. Eidelman et al., Phys. Lett. B 592 (2004) 1.
- [8] G. Ecker, A. Pich, and E. de Rafael, Phys. Lett. B 237 (1990) 481; L. Cappiello, G. D’Ambrosio, and M. Miragliuolo, Phys. Lett. B 298 (1993) 423; A.G. Cohen, G. Ecker, and A. Pich, Phys. Lett. B 304 (1993) 347.
- [9] A. Alavi-Harati et al., Phys. Rev. Lett. 83 (1999) 917.
- [10] A. Lai et al., Phys. Lett. B 536 (2002) 229.
- [11] F. Gabbiani and G. Valencia, Phys. Rev. D 64 (2001) 094008; Phys. Rev. D 66 (2002) 074006.
- [12] G. Buchalla, G. D’Ambrosio, and G. Isidori, Nucl. Phys. B 672 (2003) 387.
- [13] V.V. Anisimovsky et al., Phys. Rev. Lett. 93 (2004) 031801.
- [14] M.S. Atiya et al., Nucl. Instrum. Methods Phys. Res., Sect. A 279 (1989) 180.
- [15] M.S. Atiya et al., Nucl. Instrum. Methods Phys. Res., Sect. A 321 (1992) 129.
- [16] J. Doornbos et al., Nucl. Instrum. Methods Phys. Res., Sect. A 444 (2000) 546.
- [17] E.W. Blackmore et al., Nucl. Instrum. Methods Phys. Res., Sect. A 404 (1998) 295.
- [18] I-H. Chiang et al., IEEE Trans. Nucl. Sci. 42 (1995) 394; T.K. Komatsubara et al., Nucl. Instrum. Methods Phys. Res., Sect. A 404 (1998) 315.
- [19] D.A. Bryman et al., Nucl. Instrum. Methods Phys. Res., Sect A 396 (1997) 394.
- [20] O. Mineev et al., Nucl. Instrum. methods Phys. Res., Sect. A 494 (2002) 362.
- [21] T. Yoshioka et al., IEEE Trans. Nucl. Sci. 51 (2004) 334.
- [22] S. Adler et al., Phys. Rev. D 65 (2002) 052009.
- [23] T. Yoshioka, Ph.D. thesis, University of Tokyo, 2005.
- [24] S. Adler et al., Phys. Rev. Lett. 88 (2002) 041803; S. Adler et al., Phys. Rev. Lett. 84 (2000) 3768; S. Adler et al., Phys. Rev. Lett. 79 (1997) 2204.
- [25] G.J. Feldman and R.D. Cousins, Phys. Rev. D 57 (1998) 3873.
- [26] J. Trampetić, hep-ph/0212309; B. Melić, K. Passek-Kumerički, and J. Trampetić, hep-ph/0507231.
| Source | background level | two sets of cuts | |
|---|---|---|---|
| accepted region (,,) | selection | ||
| accepted region (,) | |||
| accepted region (,,) | |||
| range-momentum relation | |||
| delay in the target | RS - Č timing | ||
| Acceptance factors | UC | w/o UC | samples |
|---|---|---|---|
| Trigger | MC, | ||
| reconstruction and fiducial cuts | MC, | ||
| accepted region (,,) | MC | ||
| stop without nuclear interaction | MC | ||
| or decay-in-flight | |||
| and kinematic cuts | , | ||
| cuts | |||
| reconstruction and fiducial cuts | MC, | ||
| selection cuts | MC, | ||
| Other cuts on beam and target | |||
| Total acceptance |