BOSON MASS MEASUREMENT AT THE TEVATRON
The boson mass () is a key parameter of the standard model (SM), constraining the mass of the unobserved Higgs boson. Using Tevatron collision data from 1992-1995, the CDF and DØ collaborations measured to MeV. The ongoing Tevatron Run 2 has produced a factor of 5 more collisions, promising a significant reduction in . CDF has analyzed the first 200 pb-1 of Run 2 data and determined its to be 76 MeV.
1 Introduction
The SM describes all non-gravitational interactions in terms of an gauge symmetry. Non-zero particle masses arise from the breaking of the electroweak symmetry via the Higgs mechanism. The Higgs boson is the last unobserved SM particle, and the measured electroweak parameters severely constrain its mass (). The constraint can be obtained from the radiative correction to the boson mass () :
| (1) |
The correction results predominantly from Higgs and loops in the boson propagator. Because of the precise measurements of the parameters ( at ), (), and () , the uncertainties on and dominate the uncertainty on the inferred . To obtain equal contributions in a fit to , the relation must hold . For the Run 1 of 4.3 GeV, the required is 30 MeV, close to MeV . The impending Run 2 top mass measurements will significantly reduce , making reduction of primary importance.
The study of ongoing Run 2 collisions at the Tevatron will achieve this goal. With 2 fb-1 of data, the CDF and DØ collaborations expect to complete measurements with between 40 MeV and 50 MeV . Combining with the measurement from LEP ( MeV) and the Run 2 GeV will result in % .
The CDF and DØ collaborations are currently analyzing Run 2 data, with DØ finalizing its event selection and precision calorimeter calibration, and CDF performing necessary cross-checks to its full analysis with 200 pb-1 of data. The CDF collaboration has determined the boson mass uncertainty associated with these data to be 76 MeV.
2 Measuring the Boson Mass at the Tevatron
The measurement in data uses -channel resonant bosons with leptonic decays. The transverse momentum of the decay or () can be measured with high precision and thus provides the bulk of the mass information. Additional information comes from the decay transverse momentum (), which is inferred from the measured energy imbalance in the event. Since the lepton energy is well measured, the dominant uncertainty on comes from measuring the hadrons recoiling against the produced boson. Because the boson has a similar mass and production mechanism to the boson, events with bosons can be used to calibrate and model the detector response to hadronic activity.
The best statistical power for measuring is obtained by combining and into the transverse mass, defined as:
| (2) |
The transverse mass ignores the unmeasured momentum along the beam direction (). This distribution has a peak at (if we neglect detector resolution and final-state photon radiation) and a long tail below , corresponding to events with .
3 Run 2 CDF Boson Mass Measurement
The relevant components of the CDF detector for the measurement are a large open-cell drift chamber immersed in a 1.4 T magnetic field, surrounded by a lead-scintillator sampling calorimeter. Because of the similar resolutions and acceptances for 40 GeV and , the combination of the two channels nearly doubles the effective statistics for the measurement.
The CDF strategy for the measurement proceeds as follows: Model boson production and decay; calibrate track momentum using high-statistics resonances; calibrate calorimeter energy using tracks from boson decays; model hadronic response and resolution; estimate backgrounds; and fit the transverse mass distribution to obtain .
3.1 Event Generation
There are two important components of boson production for measuring : the fractional momenta of and quarks inside the proton, and the . The and momenta determine , which affects the distribution. The and fractional momenta are constrained from global fits to high-energy data and embodied in parton distribution functions (PDFs) independently parametrized by the CTEQ and MRST collaborations. Using a CTEQ prescription for obtaining PDF uncertainties, the CDF collaboration has estimated MeV.
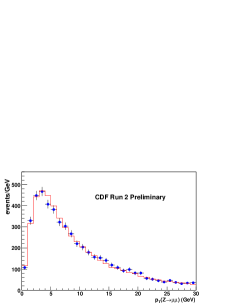
The boson distribution is predicted by an event generator (resbos ) that combines a QCD next-to-leading-log calculation with three non-perturbative parameters fit from high energy data. The dominant constraint on these parameters comes from the boson measurement in Run 1. The generator and detector simulation predict the observed Run 2 boson spectrum well (Fig. 1). The uncertainty on the resbos parameters results in MeV.
In the decay, the most important effect for the mass measurement is the radiation of a from a final-state . This radiation results in a reduced momentum, potentially affecting the inferred mass of the boson. CDF bases its simulation of final-state radiation on a QED next-to-leading order event generator (wgrad). Effects from initial-state radiation, interference, and higher-order terms are not simulated, resulting in a 20 (15) MeV uncertainty for the measurement in the () channel.
3.2 Track Momentum Calibration
A charged particle’s momentum is measured through its observed curvature in the tracker. Since the momentum is inversely proportional to curvature, the momentum scale is measured as a function of the mean inverse momentum of muons and fit to a line. The line has zero slope, verifying the applicability of the extracted scale to boson decays.
To improve momentum resolution, muon tracks from and decays use the beam position as a point in the track fit. This constraint cannot be applied to decays since they can be separated from the beam line. Instead, decays are used to verify that the beam constraint produces no bias on the momentum calibration. A systematic uncertainty of 15 MeV accounts for the observed difference in scale. Including the uncertainty due to tracker alignment, CDF estimates an uncertainty of MeV.
3.3 Calorimeter Energy Calibration
Given the momentum calibration, electron tracks from decays are used to calibrate the electromagnetic calorimeter. The calorimeter energy is scaled such that the ratio of energy to track momentum () is equal to 1. To correct for an energy-dependent scale, the distribution is fit as a function of electron and a correction applied.
The significant amount of material in the silicon detector inside the tracker affects the position of the peak. An uncertainty on the amount of material translates into an uncertainty on the measured scale. The fraction of events in the region is a measure of the material. The extent to which this region is not well modelled results in a 55 MeV uncertainty on the mass. This uncertainty dominates the total of 70 MeV.
3.4 Hadronic Recoil Measurement and Simulation
The hadronic recoil energy is measured by vectorially summing all the energy in the calorimeter, excluding that contributed by the . The detector response to the hadronic energy is defined as , where is the recoil energy of the boson. The response is measured using , since the is measured more precisely than the hadronic energy.
The hadronic energy resolution is modelled as having a component from the underlying event (independent of recoil) and a component from the recoiling hadrons. The model parameters are tuned using the resolution of along the axis bisecting the leptons. This axis is the least susceptible to fluctuations in energy. The recoil response and resolution uncertainty on the mass is 50 MeV, of which 37 MeV is due to the model of the underlying energy resolution.
3.5 Backgrounds
The backgrounds common to the and samples are: , where one is not reconstructed; ; and dijet production, with one hadronic jet misreconstructed as an . In addition, the sample includes background from cosmic rays and decays in flight. The and backgrounds are estimated using Monte Carlo. The dijet background estimation uses events with significant energy surrounding the to enhance hadronic background and obtain a background distribution. The data distribution is then fit using the and jet distributions as input. The cosmic ray background is determined using track hit timing information and the decay-in-flight background estimated by fitting the distribution to a combination of and decay-in-flight distributions. These estimates result in MeV.
3.6 Mass Fit and Systematics
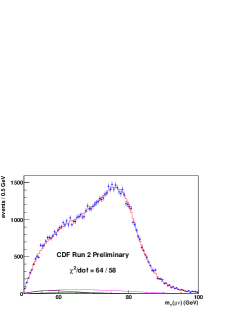
Given the energy calibrations, recoil model, and background estimation, the distribution is fit for the and channels. The predicted line shape agrees with that of the data (Fig. 1). The central value is blinded while CDF cross-checks the analysis with independent data sets and simulation. Combining the two channels (Table 1) results in MeV.
| Sytematic Uncertainty | Electrons (Run 1B ) | Muons (Run 1B ) |
|---|---|---|
| Production and Decay Model | 30 (30) | 30 (30) |
| Lepton Scale and Resolution | 70 (80) | 30 (87) |
| Recoil Scale and Resolution | 50 (37) | 50 (35) |
| Backgrounds | 20 (5) | 20 (25) |
| Statistics | 45 (65) | 50 (100) |
| Total | 105 (110) | 85 (140) |
References
References
- [1] S. Eidelman et al., Phys. Lett. B 592, 1 (2004).
- [2] G. Azuelos et al., hep-ph/0003275 (2000).
- [3] R. Blair et al., Fermilab-Pub-96-390-E (1996)
- [4] S. Abachi et al., Fermilab-Pub-96-357-E (1996).
- [5] J. Erls and P. Langacker, hep-ph/9809352 (1998).
- [6] CTEQ Collaboration, J. Pumplin et al., J. High Energy Phys. 7, 12 (2002).
- [7] A. Martin, R.G. Roberts, W.J. Stirling, R.S. Thorne, Eur. Phys. J. C 28, 455 (2003).
- [8] C. Balazs and C.P. Yuan, Phys. Rev. D 56, 5558 (1997).
- [9] T. Affolder et al., Phys. Rev. D 63, 032003 (2001).