DESY 05-065 ISSN 0418-9833
April 2005
Measurement of Deeply Virtual Compton Scattering
at HERA
H1 Collaboration
A measurement is presented of elastic deeply virtual Compton scattering made using collision data corresponding to a luminosity of 46.5 pb-1, taken with the H1 detector at HERA. The cross section is measured as a function of the photon virtuality, , the invariant mass of the p system, , and for the first time, differentially in the squared momentum transfer at the proton vertex, , in the kinematic range , and . QCD based calculations at next-to-leading order using generalized parton distributions can describe the data, as can colour dipole model predictions.
To be submitted to Eur. Phys. J. C.
A. Aktas10, V. Andreev26, T. Anthonis4, S. Aplin10, A. Asmone34, A. Astvatsatourov4, A. Babaev25, S. Backovic31, J. Bähr39, A. Baghdasaryan38, P. Baranov26, E. Barrelet30, W. Bartel10, S. Baudrand28, S. Baumgartner40, J. Becker41, M. Beckingham10, O. Behnke13, O. Behrendt7, A. Belousov26, Ch. Berger1, N. Berger40, J.C. Bizot28, M.-O. Boenig7, V. Boudry29, J. Bracinik27, G. Brandt13, V. Brisson28, D.P. Brown10, D. Bruncko16, F.W. Büsser11, A. Bunyatyan12,38, G. Buschhorn27, L. Bystritskaya25, A.J. Campbell10, S. Caron1, F. Cassol-Brunner22, K. Cerny33, V. Cerny16,47, V. Chekelian27, J.G. Contreras23, J.A. Coughlan5, B.E. Cox21, G. Cozzika9, J. Cvach32, J.B. Dainton18, W.D. Dau15, K. Daum37,43, Y. de Boer25, B. Delcourt28, R. Demirchyan38, A. De Roeck10,45, K. Desch11, E.A. De Wolf4, C. Diaconu22, V. Dodonov12, A. Dubak31,46, G. Eckerlin10, V. Efremenko25, S. Egli36, R. Eichler36, F. Eisele13, M. Ellerbrock13, E. Elsen10, W. Erdmann40, S. Essenov25, A. Falkewicz6, P.J.W. Faulkner3, L. Favart4, A. Fedotov25, R. Felst10, J. Ferencei16, L. Finke11, M. Fleischer10, P. Fleischmann10, Y.H. Fleming10, G. Flucke10, A. Fomenko26, I. Foresti41, G. Franke10, T. Frisson29, E. Gabathuler18, E. Garutti10, J. Gayler10, C. Gerlich13, S. Ghazaryan38, S. Ginzburgskaya25, A. Glazov10, I. Glushkov39, L. Goerlich6, M. Goettlich10, N. Gogitidze26, S. Gorbounov39, C. Goyon22, C. Grab40, T. Greenshaw18, M. Gregori19, B.R. Grell10, G. Grindhammer27, C. Gwilliam21, D. Haidt10, L. Hajduk6, J. Haller13, M. Hansson20, G. Heinzelmann11, R.C.W. Henderson17, H. Henschel39, O. Henshaw3, G. Herrera24, M. Hildebrandt36, K.H. Hiller39, D. Hoffmann22, R. Horisberger36, A. Hovhannisyan38, M. Ibbotson21, M. Ismail21, M. Jacquet28, L. Janauschek27, X. Janssen10, V. Jemanov11, L. Jönsson20, D.P. Johnson4, H. Jung20,10, M. Kapichine8, J. Katzy10, N. Keller41, I.R. Kenyon3, C. Kiesling27, M. Klein39, C. Kleinwort10, T. Klimkovich10, T. Kluge10, G. Knies10, A. Knutsson20, V. Korbel10, P. Kostka39, R. Koutouev12, K. Krastev35, J. Kretzschmar39, A. Kropivnitskaya25, K. Krüger14, J. Kückens10, M.P.J. Landon19, W. Lange39, T. Laštovička39,33, G. Laštovička-Medin31, P. Laycock18, A. Lebedev26, B. Leißner1, V. Lendermann14, S. Levonian10, L. Lindfeld41, K. Lipka39, B. List40, E. Lobodzinska39,6, N. Loktionova26, R. Lopez-Fernandez10, V. Lubimov25, A.-I. Lucaci-Timoce10, H. Lueders11, D. Lüke7,10, T. Lux11, L. Lytkin12, A. Makankine8, N. Malden21, E. Malinovski26, S. Mangano40, P. Marage4, R. Marshall21, M. Martisikova10, H.-U. Martyn1, S.J. Maxfield18, D. Meer40, A. Mehta18, K. Meier14, A.B. Meyer11, H. Meyer37, J. Meyer10, S. Mikocki6, I. Milcewicz-Mika6, D. Milstead18, D. Mladenov35, A. Mohamed18, F. Moreau29, A. Morozov8, J.V. Morris5, M.U. Mozer13, K. Müller41, P. Murín16,44, K. Nankov35, B. Naroska11, Th. Naumann39, P.R. Newman3, C. Niebuhr10, A. Nikiforov27, D. Nikitin8, G. Nowak6, M. Nozicka33, R. Oganezov38, B. Olivier3, J.E. Olsson10, S. Osman20, D. Ozerov25, V. Palichik8, I. Panagoulias10, T. Papadopoulou10, C. Pascaud28, G.D. Patel18, M. Peez29, E. Perez9, D. Perez-Astudillo23, A. Perieanu10, A. Petrukhin25, D. Pitzl10, R. Plačakytė27, B. Portheault28, B. Povh12, P. Prideaux18, N. Raicevic31, P. Reimer32, A. Rimmer18, C. Risler10, E. Rizvi19, P. Robmann41, B. Roland4, R. Roosen4, A. Rostovtsev25, Z. Rurikova27, S. Rusakov26, F. Salvaire11, D.P.C. Sankey5, E. Sauvan22, S. Schätzel10, F.-P. Schilling10, S. Schmidt10, S. Schmitt41, C. Schmitz41, L. Schoeffel9, A. Schöning40, V. Schröder10, H.-C. Schultz-Coulon14, K. Sedlák32, F. Sefkow10, I. Sheviakov26, L.N. Shtarkov26, Y. Sirois29, T. Sloan17, P. Smirnov26, Y. Soloviev26, D. South10, V. Spaskov8, A. Specka29, B. Stella34, J. Stiewe14, I. Strauch10, U. Straumann41, V. Tchoulakov8, G. Thompson19, P.D. Thompson3, F. Tomasz14, D. Traynor19, P. Truöl41, I. Tsakov35, G. Tsipolitis10,42, I. Tsurin10, J. Turnau6, E. Tzamariudaki27, M. Urban41, A. Usik26, D. Utkin25, S. Valkár33, A. Valkárová33, C. Vallée22, P. Van Mechelen4, N. Van Remortel4, A. Vargas Trevino7, Y. Vazdik26, C. Veelken18, A. Vest1, S. Vinokurova10, V. Volchinski38, B. Vujicic27, K. Wacker7, J. Wagner10, G. Weber11, R. Weber40, D. Wegener7, C. Werner13, N. Werner41, M. Wessels10, B. Wessling10, C. Wigmore3, Ch. Wissing7, R. Wolf13, E. Wünsch10, S. Xella41, W. Yan10, V. Yeganov38, J. Žáček33, J. Zálešák32, Z. Zhang28, A. Zhelezov25, A. Zhokin25, J. Zimmermann27, T. Zimmermann40, H. Zohrabyan38 and F. Zomer28
1 I. Physikalisches Institut der RWTH, Aachen, Germanya
2 III. Physikalisches Institut der RWTH, Aachen, Germanya
3 School of Physics and Astronomy, University of Birmingham,
Birmingham, UKb
4 Inter-University Institute for High Energies ULB-VUB, Brussels;
Universiteit Antwerpen, Antwerpen; Belgiumc
5 Rutherford Appleton Laboratory, Chilton, Didcot, UKb
6 Institute for Nuclear Physics, Cracow, Polandd
7 Institut für Physik, Universität Dortmund, Dortmund, Germanya
8 Joint Institute for Nuclear Research, Dubna, Russia
9 CEA, DSM/DAPNIA, CE-Saclay, Gif-sur-Yvette, France
10 DESY, Hamburg, Germany
11 Institut für Experimentalphysik, Universität Hamburg,
Hamburg, Germanya
12 Max-Planck-Institut für Kernphysik, Heidelberg, Germany
13 Physikalisches Institut, Universität Heidelberg,
Heidelberg, Germanya
14 Kirchhoff-Institut für Physik, Universität Heidelberg,
Heidelberg, Germanya
15 Institut für experimentelle und angewandte Physik, Universität
Kiel, Kiel, Germany
16 Institute of Experimental Physics, Slovak Academy of
Sciences, Košice, Slovak Republicf
17 Department of Physics, University of Lancaster,
Lancaster, UKb
18 Department of Physics, University of Liverpool,
Liverpool, UKb
19 Queen Mary and Westfield College, London, UKb
20 Physics Department, University of Lund,
Lund, Swedeng
21 Physics Department, University of Manchester,
Manchester, UKb
22 CPPM, CNRS/IN2P3 - Univ Mediterranee,
Marseille - France
23 Departamento de Fisica Aplicada,
CINVESTAV, Mérida, Yucatán, Méxicok
24 Departamento de Fisica, CINVESTAV, Méxicok
25 Institute for Theoretical and Experimental Physics,
Moscow, Russial
26 Lebedev Physical Institute, Moscow, Russiae
27 Max-Planck-Institut für Physik, München, Germany
28 LAL, Université de Paris-Sud, IN2P3-CNRS,
Orsay, France
29 LLR, Ecole Polytechnique, IN2P3-CNRS, Palaiseau, France
30 LPNHE, Universités Paris VI and VII, IN2P3-CNRS,
Paris, France
31 Faculty of Science, University of Montenegro,
Podgorica, Serbia and Montenegro
32 Institute of Physics, Academy of Sciences of the Czech Republic,
Praha, Czech Republice,i
33 Faculty of Mathematics and Physics, Charles University,
Praha, Czech Republice,i
34 Dipartimento di Fisica Università di Roma Tre
and INFN Roma 3, Roma, Italy
35 Institute for Nuclear Research and Nuclear Energy,
Sofia, Bulgaria
36 Paul Scherrer Institut,
Villingen, Switzerland
37 Fachbereich C, Universität Wuppertal,
Wuppertal, Germany
38 Yerevan Physics Institute, Yerevan, Armenia
39 DESY, Zeuthen, Germany
40 Institut für Teilchenphysik, ETH, Zürich, Switzerlandj
41 Physik-Institut der Universität Zürich, Zürich, Switzerlandj
42 Also at Physics Department, National Technical University,
Zografou Campus, GR-15773 Athens, Greece
43 Also at Rechenzentrum, Universität Wuppertal,
Wuppertal, Germany
44 Also at University of P.J. Šafárik,
Košice, Slovak Republic
45 Also at CERN, Geneva, Switzerland
46 Also at Max-Planck-Institut für Physik, München, Germany
47 Also at Comenius University, Bratislava, Slovak Republic
a Supported by the Bundesministerium für Bildung und Forschung, FRG,
under contract numbers 05 H1 1GUA /1, 05 H1 1PAA /1, 05 H1 1PAB /9,
05 H1 1PEA /6, 05 H1 1VHA /7 and 05 H1 1VHB /5
b Supported by the UK Particle Physics and Astronomy Research
Council, and formerly by the UK Science and Engineering Research
Council
c Supported by FNRS-FWO-Vlaanderen, IISN-IIKW and IWT
and by Interuniversity
Attraction Poles Programme,
Belgian Science Policy
d Partially Supported by the Polish State Committee for Scientific
Research, SPUB/DESY/P003/DZ 118/2003/2005
e Supported by the Deutsche Forschungsgemeinschaft
f Supported by VEGA SR grant no. 2/4067/ 24
g Supported by the Swedish Natural Science Research Council
i Supported by the Ministry of Education of the Czech Republic
under the projects INGO-LA116/2000 and LN00A006, by
GAUK grant no 175/2000
j Supported by the Swiss National Science Foundation
k Supported by CONACYT,
México, grant 400073-F
l Partially Supported by Russian Foundation
for Basic Research, grant no. 00-15-96584
1 Introduction
Measurements of the deep-inelastic scattering (DIS) of leptons and nucleons allow the extraction of Parton Distribution Functions (PDFs) which describe the longitudinal momentum carried by the quarks, anti-quarks and gluons that make up the fast-moving nucleons. While these PDFs provide crucial input to perturbative Quantum Chromodynamic (QCD) calculations of processes involving hadrons, they do not provide a complete picture of the partonic structure of nucleons. In particular, PDFs contain neither information on the correlations between partons nor on their transverse motion. This missing information can be provided by measurements of processes in which the nucleon remains intact, such as the exclusive production of light meson states in lepton-nucleon collisions, and is encoded in Generalised Parton Distributions (GPDs) [1, 2, 3, 4].
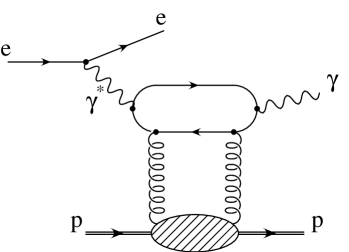
The simplest process sensitive to GPDs is deeply virtual Compton scattering (DVCS) (figure 1a), which is the diffractive scattering of a virtual photon off a proton [5, 6, 7, 9, 10, 8], . In the present analysis DVCS is accessed through the reaction:
| (1) |
This process is of particular interest as it has both a clear experimental signature and is calculable in perturbative QCD: it does not suffer from the uncertainties caused by the lack of understanding of the meson wave function that plague exclusive vector meson electroproduction.


The reaction studied receives contributions from both the DVCS process, whose origin lies in the strong interaction, and the purely electromagnetic Bethe-Heitler (BH) process (figures 1b and 1c), where the photon is emitted from the positron. The BH cross section can be precisely calculated in QED using elastic proton form factors. Here, the DVCS cross section is obtained by subtracting the BH contribution from the total cross section, which is possible since the interference contribution vanishes [10], as this measurement is integrated over azimuthal angles.
The first measurements of the DVCS cross section at high energy were obtained by H1 [11] and ZEUS [12] and the helicity asymmetry in DVCS has been measured at lower energy with polarised lepton beams by HERMES [13] and CLAS [14].
In this paper, a measurement of the DVCS cross section is presented, based on data collected with the H1 detector at HERA in the years 1996 to 2000. These data correspond to a luminosity of 46.5 , a factor of 4 larger than the luminosity used in the previous H1 publication [11], which is based only on 1997 data. The cross section is presented as a function of the photon virtuality, , the invariant mass of the p system, , and the squared momentum transfer at the proton vertex, .
2 Generalized Parton Distributions and Theoretical Predictions
The leading order diagram for DVCS in positron proton scattering is shown in figure 2a and a diagram that contributes at next-to-leading order in figure 2b. The transition from a virtual photon to a real photon forces the fractional momenta of the two partons involved to be different (“skewed”). Hence, DVCS is sensitive to the correlations between partons in the proton which are encoded in the GPDs. In the presence of a hard scale, here , the DVCS scattering amplitude factorises [3, 6, 7] into a hard part, calculable order by order in perturbative QCD, and the GPDs which contain the non-perturbative effects due to the structure of the proton.

2.1 Generalized Parton Distributions
The GPDs generalize and interpolate between the PDFs and elastic form factors. The PDFs contain information on the longitudinal momenta of the partons while form factors contain information on their transverse momenta, often in the form of sum rules related to charges, local currents and the energy-momentum tensor of QCD. GPDs have simple physical significance in light-cone coordinates (or the infinite momentum frame), where they represent the interference of two different wave functions, one of a parton having a momentum fraction and the other of a parton with a momentum fraction , as is illustrated in figure 2. Besides the longitudinal momentum fraction variables (called skewedness) and , GPDs depend on , the square of the four-momentum exchanged at the hadron vertex. GPDs are defined at a starting scale and their evolution is generated by perturbative QCD.
There are two different types of GPDs (for a quark or a gluon ) in the unpolarised case: and . While the distributions have no equivalent in the ordinary PDF approach, the reduce to the usual PDFs in the forward limit , i.e. and , where and are the ordinary parton distributions. The variable is defined in the range , with negative values corresponding to anti-quark distributions: . The gluon GPD is symmetric in in the forward limit: . The skewedness variable is related to the well known Bjorken- variable, , by , where and denotes the four-momentum of the outgoing photon111 For the DVCS process, the outgoing photon is real () and reduces to . The forward limit corresponds to the case of inclusive DIS, where and thus . . The first moments of the GPDs in are given by form factors [4].
Two different kinematic regions exist for GPDs with respect to the variables and . The DGLAP region, where [15, 16, 17, 18], corresponds to the emission and re-absorption of a quark, anti-quark or a gluon. The ERBL [20, 19] region, where , corresponds to meson or gluon pair exchange. Each region has its own evolution equations.
The recent strong interest in GPDs was stimulated by the information they contain on the spin structure of the nucleon. In particular, GPDs are so far the only known means of probing the orbital motion of partons in the nucleon through Ji’s Sum Rule [21], which relates unpolarised GPDs to the total angular momentum of the proton. DVCS measurements at HERA can provide constraints on this sum rule through their sensitivity to the GPDs.
2.2 Theoretical Predictions
The measurements presented here are compared with NLO QCD calculations and predictions made using colour dipole approaches. In NLO QCD, the DVCS cross section has been calculated [22, 23] using two different GPD parameterisations [24]. The dependence of the GPDs is taken to be . The MRST2001 [25] and CTEQ6 [26] parameterisations of the PDFs are used in the DGLAP region (). Thus , which provides the main contribution to DVCS at small , is given at the starting scale by for the quarks and for the gluons222A different ansatz for GPDs has been used in [27] in a LO calculation of the DVCS cross section.. Both the skewing and the dependence are generated dynamically. In the ERBL region (), these parameterisations have to be modified, ensuring a smooth continuation to the DGLAP region (for details see [24]). These GPD models are found to describe both the shape of the previous H1 DVCS cross section measurements [11] and the single spin asymmetry measured by HERMES [13].
The DVCS cross section has also been calculated in the colour dipole approach, which is successful in describing both inclusive and diffractive scattering in the DIS regime at high energy. These predictions are based on a factorisation of the DVCS amplitude into the wave function for the photon to fluctuate into a pair, the cross section for this pair to interact with the proton and the outgoing photon wave function. If -channel helicity is conserved in DVCS, the virtual photon must be transversely polarised. As the wave function of the transversely polarised can select large dipole sizes, whose interactions are predominantly soft, DVCS constitutes a good probe of the transition between the perturbative and non-perturbative regimes of QCD. The various calculations differ in the way the dipole cross section is parameterised. Donnachie and Dosch [28] use soft and hard pomeron exchange depending on the size of the dipole. All parameters are determined from and total cross section measurements. Favart and Machado [29] apply the saturation model of Golec-Biernat et al. [30] to the DVCS process and use DGLAP evolution [31], following the approach of Bartels, Golec-Biernat and Kowalski (BGBK) [32]. In both cases an exponential -dependence, , is assumed.
3 Experimental Procedure
3.1 H1 Detector
A detailed description of the H1 detector can be found in [33]. Here only the detector components relevant for the present analysis are described. The SpaCal [34], a lead scintillating fibre calorimeter, covers the backward333H1 uses a right-handed coordinate system with axis along the beam direction, the or “forward” direction being that of the outgoing proton beam. The polar angle is defined with respect to the axis and the pseudo-rapidity is given by . region of the H1 detector (). Its energy resolution for electromagnetic showers is . The liquid argon (LAr) calorimeter () is situated inside a solenoidal magnet. The energy resolution for electromagnetic showers is as obtained from test beam measurements [35]. The backward drift chamber (BDC), placed in front of the SpaCal, measures track segments for charged particles entering the SpaCal from the interaction region. These are used to identify the scattered positron and to determine its position with a resolution of 0.5 mm in the radial and 2.5 mm in the azimuthal direction. The main component of the central tracking detector is the central jet chamber (CJC) which consists of two 2 m long coaxial cylindrical drift chambers, with wires parallel to the beam direction. The measurement of charged particle transverse momenta is performed in a magnetic field of 1.15 T, uniform over the full tracker volume. The forward components of the detector, used here to tag hadronic activity at large pseudo-rapidity (), are the forward muon detector (FMD) and the proton remnant tagger (PRT). The FMD, designed to identify muons emitted in the forward direction, contains six planes of drift cells. It is used here to detect the particles produced when a proton dissociates and secondary interactions occur in the beampipe and adjacent material. Secondary particles, or the scattered proton, can also be detected by the PRT, which is located at 24 m from the interaction point and consists of layers of scintillator surrounding the beam pipe. The luminosity is determined from the rate of BH events measured in a luminosity monitor.
3.2 Kinematics
For DVCS, the final state photon does not originate from the positron and therefore the ratio of the DVCS to the BH cross sections is expected to increase when the photon is scattered in the forward direction. The analysis sample is thus selected by requiring a photon candidate in the LAr calorimeter and a positron candidate in the SpaCal calorimeter.
The reconstruction of the kinematic variables , and relies on the polar angle measurements of the final state positron, , and photon, :
| (2) | |||||
| (3) | |||||
| (4) |
where and are the positron and proton beam energies, respectively. For the majority of the events, the scattered positron trajectory is not measured in the CJC and the event vertex cannot be determined. The polar angles of the positron and photon are then determined assuming that they come from the nominal event vertex. The square of the four-momentum transfer to the proton, , is very well approximated by the square of the vector sum of the transverse momenta of the final state photon, , and of the scattered positron, :
| (5) |
3.3 Monte Carlo Simulation
Monte Carlo (MC) simulations are used to estimate the corrections that must be applied to the data due to the finite acceptance and resolution of the detector. Elastic DVCS events in collisions are generated using the Monte Carlo generator MILOU [36], which is based on a NLO QCD cross section calculation [22, 23, 37] (see section 2.2), and using a slope in of GeV-2. Higher order photon radiation from the incoming positron is implemented in the collinear approximation. DVCS events in which the proton dissociates into a baryonic system are also simulated with the program MILOU using a slope of GeV-2 [38]. The Monte Carlo generator COMPTON 2.1 [39, 40] is used to simulate both elastic and inelastic BH events. Hadronisation processes in inelastic BH events are simulated using the SOPHIA model [41]. Diffractive and meson events are generated with the DIFFVM Monte Carlo program [42]. The events generated using all these programs are passed through a detailed simulation of the H1 detector and are subject to the same reconstruction and analysis chain as the data.
3.4 Event Selection
The data were obtained with the H1 detector when the HERA collider was operated with 820 GeV (1996-1997) and 920 GeV (1999-2000) protons and 27.6 GeV positron beams. The data sample corresponds to an integrated luminosity of 46.5 , 11.5 of which were accumulated in 1996-1997 and 35 in 1999-2000. The event trigger used is based on the detection of an energy deposition greater than 6 GeV in the electromagnetic section of the SpaCal calorimeter. Due to the different trigger settings, selected events in the 1996-1997 period are in the kinematic range GeV2 while those in the 1999-2000 period are in the range GeV2.
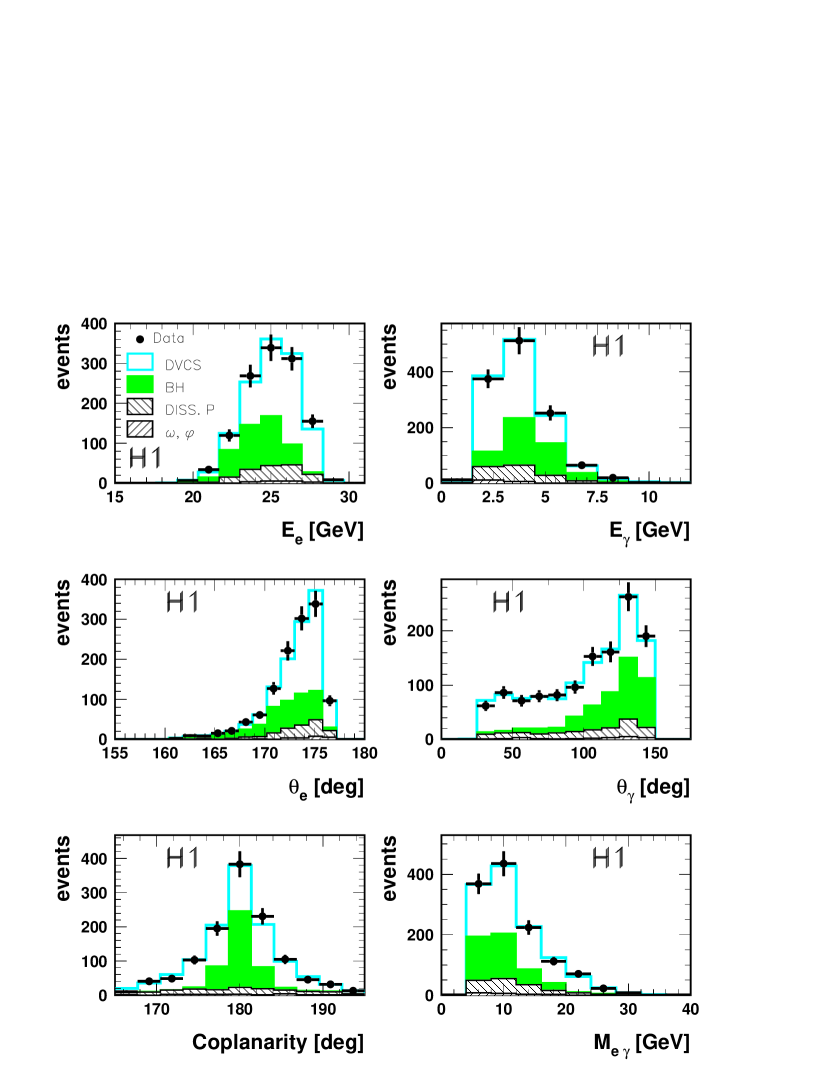
The DVCS event selection requires that the following criteria be fulfilled. The scattered positron must be detected in the SpaCal, have an energy larger than and be validated by a track segment in the BDC. The photon must be measured in the LAr calorimeter with a transverse momentum (1996-1997) or (1999-2000) and a polar angle between and . The scattered proton escapes undetected through the beam pipe. Events with more than one central track are rejected while events with one central track are only kept if that track is associated with the scattered positron. In order to reject inelastic and proton dissociation events, no further energy deposition in the LAr calorimeter with energy above is allowed and no activity above the noise level is allowed in the PRT and FMD. The influence of QED radiative corrections is reduced by the requirement that the longitudinal momentum balance . Here, denotes the energy and the momentum along the beam axis of the final state particles and the sum runs over all such particles. To enhance the DVCS signal with respect to the BH contribution and to ensure a large acceptance, the kinematic domain is explicitly restricted to , and .
The selected sample contains 1243 events and is dominated by the DVCS contribution, but also contains contributions from the elastic BH process and from the (inelastic) BH and DVCS processes with proton dissociation, , where the baryonic system of mass is not detected in the forward detectors.
As in previous H1 DVCS analyses [11, 43], a control sample of BH events is also selected. Here, it is required that the positron be detected in the LAr and the photon in the SpaCal. It has been verified that the COMPTON MC correctly describes the normalisation and the shapes of the distributions of the kinematic variables for these events within an uncertainty of 5%. Using events with a signal in the forward detectors, and subtracting the inelastic BH contribution, obtained from the COMPTON MC, the contribution of proton dissociation to the DVCS event sample is estimated to be for the 1996-1997 data (lower ) and for the 1999-2000 data. The other backgrounds considered are diffractive and production, with decay modes to final states including photons. The main backgrounds originate from the decays and followed by the decay . The contribution of these processes to the DVCS sample is estimated to be below 3.5% for the data taken in 1996-1997 and below 1% for that taken in 1999-2000.
In figure 3 the data are compared with the sum of the MC expectations. The BH contributions and the and backgrounds are normalised to the luminosity. The DVCS contribution is normalised such that the sum of the DVCS, BH and diffractive vector meson contributions is equal to the total number of events in the data. The distributions of the energy and polar angle of the positron and the photon are shown in figures 3a-d. The coplanarity, shown in figure 3e, is defined to be the difference of the azimuthal angles of the electron and photon directions. It is related to the -balance of the positron-photon system. The distribution of the invariant mass of the positron and the photon is presented in figure 3f. The sum of the MC contributions gives a good description of the shapes of the data distributions.
3.5 Cross Section Measurement Method
To extract the cross section, the selected data are corrected for detector efficiencies, acceptance, bin-to-bin migrations and for initial state radiation from the positron using the Monte Carlo simulation. The inelastic BH contribution is subtracted bin by bin using the COMPTON Monte Carlo program. The contribution of DVCS events with proton dissociation is subtracted bin by bin using the MILOU Monte Carlo simulation. A 5% correction is applied to correct for the loss of elastic DVCS events due to the requirement that there be no signal in the forward detectors. The background contributions from diffractive and production are also subtracted using the MC simulations.
In the leading twist approximation, the main contribution resulting from the interference of the BH and DVCS processes is proportional to the cosine of the azimuthal angle of the photon444The azimuthal angle of the photon is defined as the angle between the plane formed by the incoming and scattered positron and that formed by the and the scattered proton.. Since the present measurement is integrated over this angle, the overall contribution of the interference term is negligible. The elastic BH cross section can therefore be subtracted from the total cross section in order to obtain the contribution from DVCS processes. This contribution is then converted to the cross section using the equivalent photon approximation555After integrating over azimuthal angles only transversely polarised contribute to the DVCS process.:
| (6) |
where the transverse photon flux is given by [44],
| (7) |
Here, is the square of the centre-of-mass energy.
The dependence is factorised according to:
| (8) |
The cross section is extracted from equations 6 and 8 using an iterative procedure and fitting the integrated cross section with the form:
| (9) |
where , and are free parameters and is fixed by the integration of equation 6. More details can be found in [43].
The same method is used to extract as a function of and of .
3.6 Systematic Errors
The main sources of systematic errors and their resulting uncertainty on the DVCS cross section measurements are:
-
the subtraction of the DVCS proton dissociation background (typically 11% in 1996-1997, 8% in 1999-2000 and up to 20% in the highest bin) estimated using MC simulations with GeV-2 and an dependence ;
-
the uncertainty on the acceptance correction factors (typically and up to in the highest bin) calculated by varying between and GeV-2;
-
the uncertainty on the determination of and used for the bin centre corrections (which ranges between and );
-
the uncertainty on the BH subtraction (up to for the highest bin);
-
the uncertainties on the vertex position and the measurement of the scattered positron/photon angles (each contribution leading to up to in the highest bin);
-
the uncertainties on the positron/photon energies (each contribution leading to up to in the highest bin);
-
the noise in the CJC (typically ), and in the FMD (up to 2%);
-
the luminosity measurement (typically ).
The total systematic error is found to be typically .
4 Results
4.1 Cross Sections
The cross sections are determined separately for the two data taking periods, which cover different ranges in , and are then combined. The 1996-1997 period covers the kinematic range GeV2 and , the 1999-2000 period GeV2 and ; in both cases .
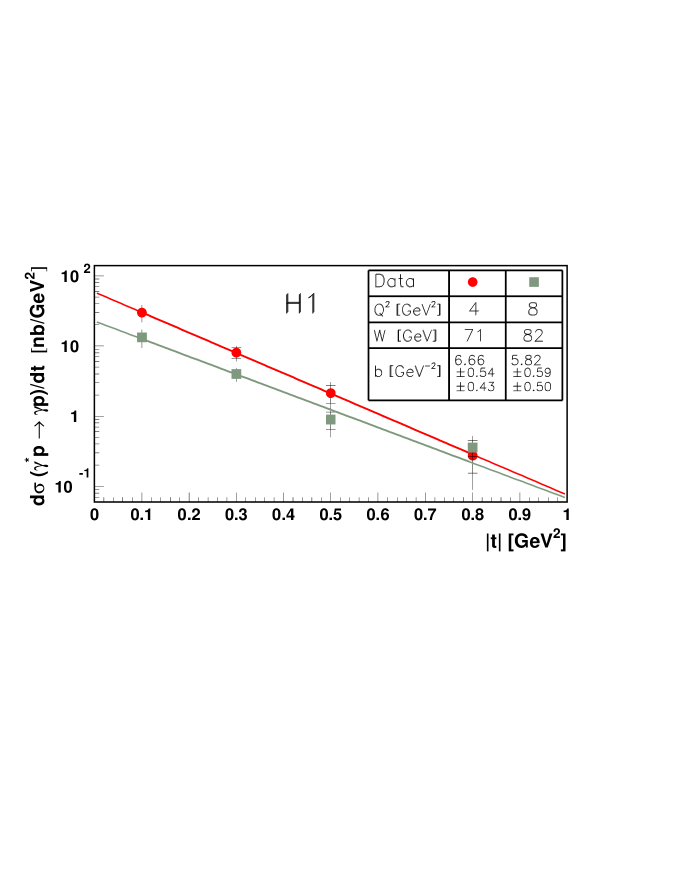
The cross section is shown differentially in in figure 4 and given in table 1 for GeV2 and GeV (using the 1996-1997 data) and GeV2 and GeV (using the 1999-2000 data). The data points are fitted with the exponential form , which gives GeV-2 at GeV2 where the first error is statistical and the second systematic. At GeV2, a value of GeV-2 is obtained. The two cross sections are averaged after correcting the 1996-1997 results to GeV2 and GeV using equation 9 (see table 1). The slope is then measured to be GeV-2.
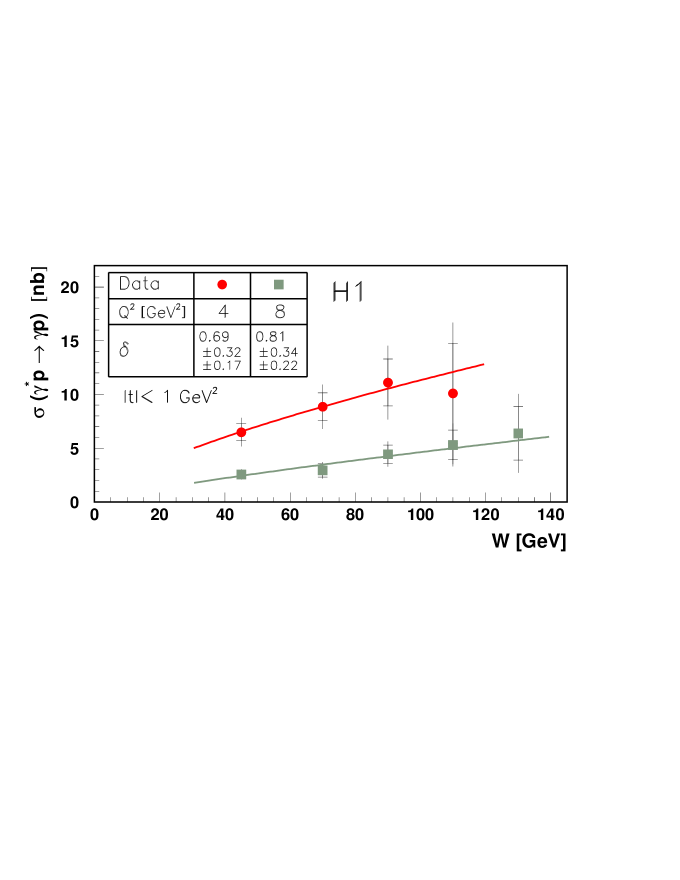
The cross section as a function of is shown in figure 5 and given in table 2 for GeV and GeV2. Fitting the dependence with the form gives . The dependence of the cross section is also given for a fixed value of in table 2, in the restricted range accessible for fixed .
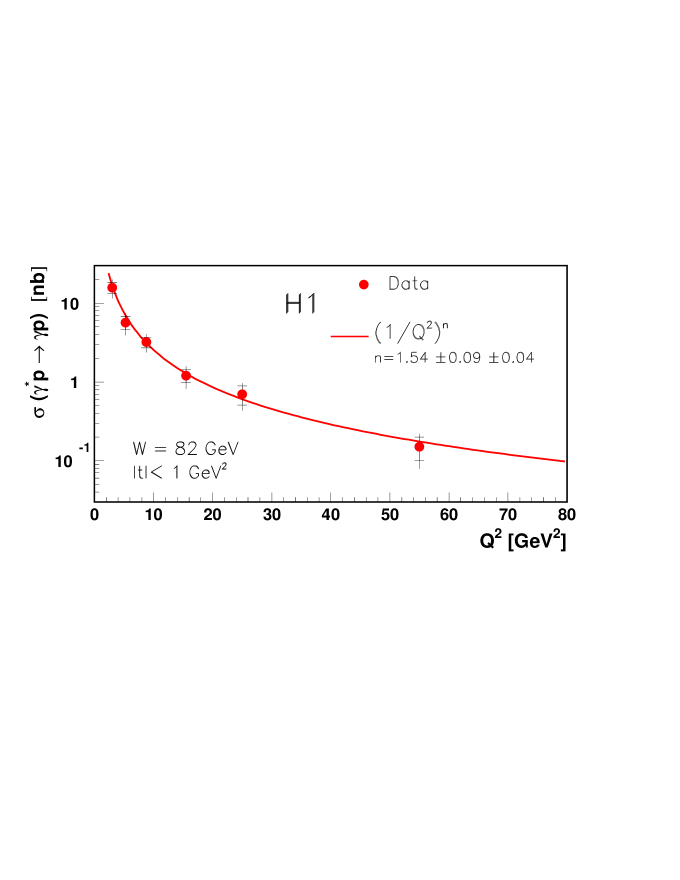
The cross section as a function of is shown in figure 6 and given in table 3 for GeV2 and GeV2; in both cases GeV2. The data are fitted using the form which gives at GeV2 and at GeV2. The two measurements are combined as explained above and the resulting cross section is given in table 3 at GeV2. Fitting the combined sample with the form gives . The steep rise of the cross section with is a strong indication of the presence of a hard scattering process, the value of being comparable to that measured in exclusive production [45, 46].
The extracted values of , and are summarised in table 4.
4.2 Discussion
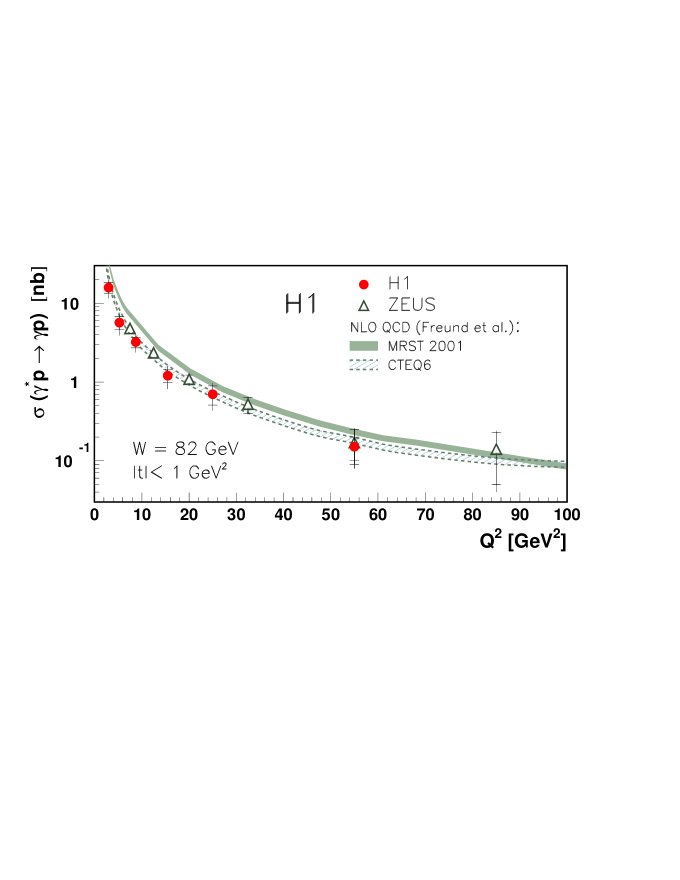
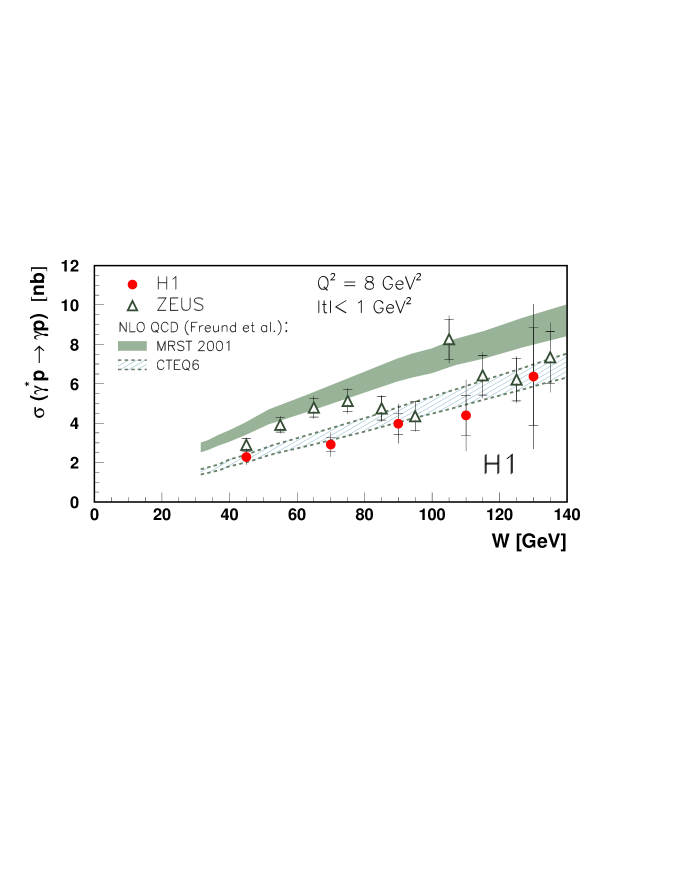
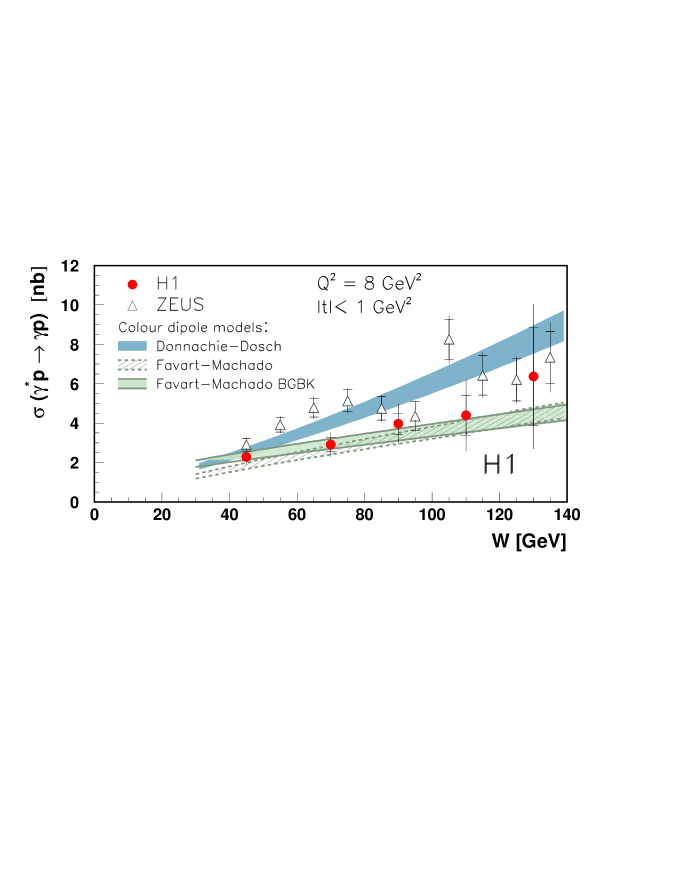
The cross section measurements from the combined data sample are shown with ZEUS measurements666The ZEUS measurements, for GeV, have been rescaled to GeV and from GeV2 to GeV2 using the parameter values and as quoted by ZEUS. [12] and theoretical predictions as a function of in figure 7a and as a function of in figure 8a. All predictions are made assuming an exponential dependence on , using the measured value GeV-2. The error represents the total uncertainty of the slope which is reflected in the band associated with each of the predicted curves. The H1 and ZEUS measurements are seen to be consistent. The NLO QCD calculations of Freund et al. use two different GPDs, based on MRST 2001 and CTEQ6, for the diagonal distributions in the DGLAP domain. These two parameterisations show similar behaviour in and in and differ mainly in the normalisation, which reflects the relative size of the quark singlet and gluon distributions for each set. The H1 data are better described by the parameterisation based on CTEQ6, but it must be noted that the prediction also depends on the parameterisation of the ERBL region.
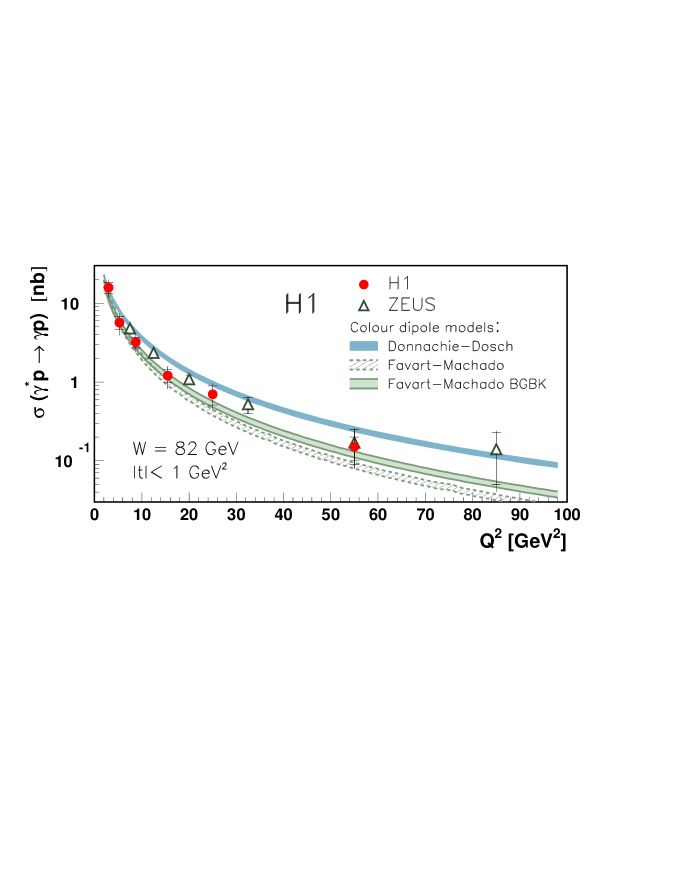
As shown in figures 7b and 8b, colour dipole models also provide a reasonable description of the data, both in shape and in normalisation. The dependence is better described by the Favart-Machado prediction when DGLAP evolution of the dipole (BGBK) is included. As regards the dependence, the H1 data are consistent with both the Donnachie-Dosch and the Favart-Machado predictions, while the ZEUS measurements slightly favour the Donnachie-Dosch prediction.
5 Conclusion
The DVCS process has been studied in the kinematic region GeV, GeV2 and GeV2 using data taken with the H1 detector in the years 1996 to 2000. The cross section has been measured as a function of and as a function of , and for the first time differentially in . The dependence of the cross section on is well reproduced by the shape with at GeV. The dependence can be described by a fit of the form yielding at GeV2. The fall of the cross section differential in can be described by the form with GeV-2 at GeV2. This first measurement of the dependence of DVCS constrains the normalisation of the theoretical predictions. NLO QCD calculations give a good description of the normalisation as well as of the and dependence of the measured cross section using a parameterisation of the GPDs based on the CTEQ6 parton distribution functions. The calculations rely on ordinary (unskewed) parton distributions in the DGLAP region and generate the skewedness dynamically. Colour dipole model predictions also give a good general description of the data. This is particularly true for a saturation model in which the DGLAP equation is used to describe the evolution of the dipole.
Acknowledgements
We are grateful to the HERA machine group whose outstanding efforts have made and continue to make this experiment possible. We thank the engineers and technicians for their work in constructing and now maintaining the H1 detector, our funding agencies for financial support, the DESY technical staff for continual assistance and the DESY directorate for the hospitality which they extend to the non-DESY members of the collaboration. We are grateful to M. Diehl and A. Freund for valuable discussions. We thank A. Freund and M. McDermott for providing the NLO QCD predictions used in this analysis.
| 1996-1997 | 1999-2000 | All data | |||||||
| GeV2 | GeV2 | GeV2 | |||||||
| GeV | GeV | GeV | |||||||
| 0.1 | |||||||||
| 0.3 | |||||||||
| 0.5 | |||||||||
| 0.8 | |||||||||
| GeV | ||||||
|---|---|---|---|---|---|---|
| 3.0 | ||||||
| 5.25 | ||||||
| 8.75 | ||||||
| 15.5 | ||||||
| 25.0 | ||||||
| 55.0 | ||||||
| 1996-1997 | 1999-2000 | All data | |||||||
| GeV2 | GeV2 | GeV2 | |||||||
| 45 | |||||||||
| 70 | |||||||||
| 90 | |||||||||
| 110 | |||||||||
| 130 | |||||||||
| [GeV-2] | |||
|---|---|---|---|
| 4 GeV2 | 6.66 0.54 0.43 | 0.69 0.32 0.17 | |
| 8 GeV2 | 5.82 0.59 0.50 | 0.81 0.34 0.22 | 1.54 0.09 0.04 |
| All data, 8 GeV2 | 6.02 0.35 0.39 | 0.77 0.23 0.19 |
References
- [1] D. Müller et al., Fortsch. Phys. 42 (1994) 101 [hep-ph/9812448].
- [2] X. Ji, Phys. Rev. Lett. 78 (1997) 610 [hep-ph/9603249].
- [3] A.V. Radyushkin, Phys. Rev. D 56 (1997) 5524 [hep-ph/9704207].
- [4] For a review see e.g. M. Diehl, Phys. Rep. 388 (2003) 41, DESY-THESIS-2003-018 [hep-ph/0307382].
- [5] X. Ji, Phys. Rev. D 55 (1997) 7114 [hep-ph/9609381].
- [6] J.C. Collins and A. Freund, Phys. Rev. D 59 (1999) 074009 [hep-ph/9801262].
- [7] X. Ji and J. Osborne, Phys. Rev. D 58 (1998) 094018 [hep-ph/9801260].
- [8] J. Blümlein and D. Robaschik, Nucl. Phys. B 581 (2000) 449 [hep-ph/0002071].
- [9] L. Mankiewicz et al., Phys. Lett. B 425 (1998) 186 [hep-ph/9712251].
- [10] A.V. Belitsky, D. Müller, L. Niedermeier and A. Schäfer, Phys. Lett. B 474 (2000) 163 [hep-ph/9908337].
- [11] C. Adloff et al. [H1 Collaboration], Phys. Lett. B 517 (2001) 47 [hep-ex/0107005].
- [12] S. Chekanov et al. [ZEUS collaboration], Phys. Lett. B 573 (2003) 46 [hep-ex/0305028].
- [13] A. Airapetian et al. [HERMES Collaboration], Phys. Rev. Lett. 87 (2001) 182001 [hep-ex/0106068].
- [14] S. Stepanyan et al. [CLAS Collaboration], Phys. Rev. Lett. 87 (2001) 182002 [hep-ex/0107043].
- [15] V.N. Gribov and L.N. Lipatov, Yad. Fiz. 15 (1972) 781 [Sov. J. Nucl. Phys. 15 (1972) 438].
- [16] L.N. Lipatov, Yad. Fiz. 20 (1974) 181 [Sov. J. Nucl. Phys. 20 (1975) 94].
- [17] G. Altarelli and G. Parisi, Nucl. Phys. B 126 (1977) 298.
- [18] Y.L. Dokshitzer, Zh. Eksp. Teor. Fiz. 73 (1977) 1216 [Sov. Phys. JETP 46 (1977) 641].
- [19] A.V. Efremov and A.V. Radyushkin, Phys. Lett. B 94 (1980) 245.
- [20] G.P. Lepage and S.J. Brodsky, Phys. Lett. B 87 (1979) 359.
-
[21]
X. Ji, Phys. Rev. Lett. 78 (1997) 610 [hep-ph/9603249];
P. Hoodbhoy, X. Ji and W. Lu, Phys. Rev. D 59 (1999) 014013 and 074010 [hep-ph/9808305]. - [22] A. Freund and M.F. McDermott, Phys. Rev. D 65 (2002) 091901 [hep-ph/0106124].
- [23] A. Freund and M.F. McDermott, Phys. J. C 23 (2002) 651 [hep-ph/0111472].
- [24] A. Freund, M.F. McDermott and M. Strikman, Phys. Rev. D 67 (2003) 036001 [hep-ph/0208160].
- [25] A.D. Martin, R.G. Roberts, W.J. Stirling and R.S. Thorne, Eur. Phys. J. C 28 (2003) 455 [hep-ph/0211080].
- [26] D. Stump, J. Huston, J. Pumplin, W.-K. Tung, H.L. Lai, S. Kuhlmann and J.F. Owens, JHEP 0310 (2003) 046 [hep-ph/0303013].
- [27] A.V. Belitsky, D. Müller and A. Kirchner, Nucl. Phys. B 629 (2002) 323 [hep-ph/0112108].
- [28] A. Donnachie and H.G. Dosch, Phys. Lett. B 502 (2001) 74-78 [hep-ph/0010227].
- [29] L. Favart and M.V. Machado, Eur. Phys. J. C 29 (2003) 365-371 [hep-ph/0302079].
- [30] K. Golec-Biernat and M. Wüsthoff, Phys. Rev. D 60 (1999) 114023 [hep-ph/9903358].
- [31] L. Favart and M.V. Machado, Eur. Phys. J. C 34 (2004) 429 [hep-ph/0402018].
- [32] J. Bartels, K. Golec-Biernat and H. Kowalski, Acta Phys. Polon. B 33 (2002) 2853 [hep-ph/0207031].
- [33] I. Abt et al. [H1 Collaboration], Nucl. Instrum. Meth. A 386 (1997) 310 and 348.
- [34] R.D. Appuhn et al. [H1 SPACAL Group], Nucl. Instrum. Meth. A 386 (1997) 397.
- [35] B. Andrieu et al. [H1 Calorimeter Group], Nucl. Instrum. Meth. A 350 (1994) 57.
- [36] E. Perez, L. Schoeffel and L. Favart, DESY-04-228 [hep-ph/0411389].
- [37] A. Freund, Phys. Rev. D 68 (2003) 096006 [hep-ph/0306012].
- [38] X. Janssen, Ph.D. Thesis, Université Libre de Bruxelles, 2003, DESY-THESIS-2003-004, available through: http://www-h1.desy.de/publications/theses_list.html.
- [39] A. Courau, S. Kermiche, T. Carli and P. Kessler, Quasi-Real QED Compton Monte Carlo, Proceedings of the Workshop on Physics at HERA, eds. W. Buchmüller, G. Ingelman, Vol. 2: p. 902, Hamburg 1991.
- [40] V. Lendermann, Ph.D. Thesis, Universität Dortmund, 2002, DESY-THESIS-2002-004, available through: http://www-h1.desy.de/publications/theses_list.html.
- [41] A. Mücke et al., Comput. Phys. Commun. 124 (2000) 290 [astro–ph/9903478].
- [42] B. List and A. Mastroberardino, DIFFVM: A Monte Carlo generator for diffractive processes in ep scattering, Proceedings of the DESY workshop on Monte Carlo Generators for HERA Physics, eds. A. T. Doyle, G. Grindhammer, G. Ingelman and H. Jung, DESY-PROC-1999-02, p. 396.
- [43] R. Stamen, Ph.D. Thesis, Universität Dortmund, DESY-THESIS-2001-057, available through: http://www-h1.desy.de/publications/theses_list.html.
- [44] L.N. Hand, Phys. Rev. 129 (1963) 1834.
- [45] C. Adloff et al. [H1 Collaboration], Eur. Phys. J. C 10 (1999) 373 [hep-ex/9903008].
- [46] S. Chekanov et al. [ZEUS Collaboration], Eur. Phys. J. C 24 (2002) 345 [hep-ex/0201043].
- [47] C. Adloff et al. [H1 Collaboration], Eur. Phys. J. C 13 (2000) 371 [hep-ex/9902019].
- [48] J. Breitweg et al. [ZEUS Collaboration], Eur. Phys. J. C 6 (1999) 603 [hep-ex/9808020].