CLEO Collaboration
Branching fraction measurements of decay to baryon-antibaryon final states
Abstract
Using 3.08 million decays observed in collisions by the CLEO detector, we present the results of a study of the decaying into baryon-antibaryon final states. We report the most precise measurements of the following eight modes: , , , (first observation), (first observation), and , and place upper limits for the modes, and .
pacs:
13.25.Gv, 13.60.Rj, 14.20.JnThe study of production in and its subsequent decay into two hadrons provides a test of the predictive power of QCD hel , including information on gluon spin, quark distribution amplitudes in baryon-antibaryon pairs, and total hadron helicity conservation. The decays are predicted to proceed via the annihilation of the constituent into three gluons or a virtual photon. This model leads to the prediction that the ratio of the branching fraction into a specific final state to the branching fraction of the into that same state should be a constant value of approximately 13, the corresponding ratio for the dilepton final state rule . This rule, which was previously refereed to as the “12% rule”, is roughly obeyed for several channels, but fails for others obey . This Letter concentrates on the investigation of the two-body decays of the into a baryon-antibaryon pair. Previous measurements pdg of the decaying into these final states have very large statistical uncertainties. The CLEO cleoc detector, with the advantage of good charged and neutral particle detection efficiencies, together with secondary and tertiary vertex reconstruction, gives us the opportunity to make the most precise measurements yet of these branching fractions.
The data used in this analysis were collected at the CESR storage ring, which has been reconfigured to run near threshold by inserting 6 wigglers cleoc . Our analysis is based on 3.08 decays which corresponds to the total integrated luminosity of 5.63 pb-1. Approximately half of the data (2.74 pb-1) were taken with the CLEO III detector configuration cleo and the remainder (2.89 pb-1) of the data, and all the continuum data (20.70 pb-1, ) were taken with the reconfigured CLEO-c detector cleoc . We generated 10,000 Monte Carlo events using simulations of each of the two detector configurations for each of the eight decay modes, using a GEANT-based geant detector modeling program. For all modes we generated Monte Carlo samples with a flat distribution in , where is the angle of the decay products in the center-of-mass system (in colliding beam experiments this angle is measured relative to the beam axis). For spin 1/2 baryons in the baryon octet, we then weighted the Monte Carlo samples with a angular distribution, in agreement with the naive expectation. Possible deviations from these angular distributions will be one source of systematic uncertainty in our measurements.
We begin by reconstructing the hyperons in the following decay modes (branching fractions pdg are listed in parentheses): (63.9), (51.6), (100.0), (99.9), (99.5), (51.6), and (67.8). To discriminate between protons, kaons, pions, and electrons, we combined specific ionization () measured in the drift chamber cleo and log-likelihoods obtained from the RICH sub-detector cleo to form a joint log-likelihood difference: , where the more negative , the higher the likelihood that the particle is a proton compared to a pion. Our requirement on these quantities varies in value from mode to mode depending upon background considerations. Further details of this procedure may be found elsewhere pkkpi . For protons in the and decay modes we require and (3 separation), and for those in the mode we require additional criteria as, in this case alone, electrons are a potentially significant background. For protons that are the daughters of decays we make the looser requirements of and , which are both very efficient. Kaons from decays are strongly identified with and . Pions are only required to have energy loss measurements consistent with the pion identity. Photon candidates were identified in the CsI calorimeter.
The analysis procedure for reconstructing and closely follows that presented earlier pkkpi . The reconstruction follows the steps of the reconstruction by replacing a pion by a kaon. hyperons are reconstructed by combining a with a photon and requiring the photon energy in the crystal calorimeter to be in excess of 50 MeV, not matched to a charged track, and consistent in shape to that from a photon. and hyperon reconstruction is complicated by the fact that there is no direction information from the CsI photon clusters for the reconstruction. A kinematic fit is made to the hypothesis that the parent hyperon started at the beamspot, and decayed after a positive pathlength to a decay vertex which is the origin of the decay. A cut was placed on the of the fit to this topology, which includes the fit to the mass from the newly found hyperon decay vertex. The candidate is reconstructed by vertexing a positively charged pion candidate, consistent with coming from the beamspot, with the already found . All hyperon candidates were required to have vertices significantly separated from the beamspot, with the flight distance of the measured from the parent (, , or ) decay vertex, to be positive. In Figure 1 we show the inclusive hyperon yields in the data. We observed 48 candidate events in the data as shown in Fig 1(a) with a fitted width () found to be 1.53 MeV/, consistent with Monte Carlo estimates. The fitted yields (widths) in Fig. 1(b) and (c) for and candidates are approximately 3 (4.0 MeV/) and 1 (4.7 MeV/), respectively. Invariant mass distributions for the and are shown in Fig. 1(d) and (e), respectively. The fit yielded approximately 2.7 and 1.2 for the signal events and 2.4 MeV/ and 3.6 MeV/ for widths for the and candidates, respectively. The fits in Fig. 1(f) and (g) yielded 115 (4.69 MeV/) and 47 (2.69 MeV/) events (width) for the and spin 3/2 baryons. Hyperon candidates within of their nominal masses are considered for further analysis. We then combined the 4-momenta of these baryons with the corresponding 4-momenta of their charge conjugates and formed candidates.

We note that baryon-antibaryon pairs produced by decays have a back-to-back topology, and each decaying baryon has exactly the beam energy. Momentum conservation is imposed on the reconstructed baryon-antibaryon pairs by demanding the vector sum of the total momentum in an event be less than 0.04. This eliminates background, via or (n 0,1, and 2), which have extra tracks or showers.
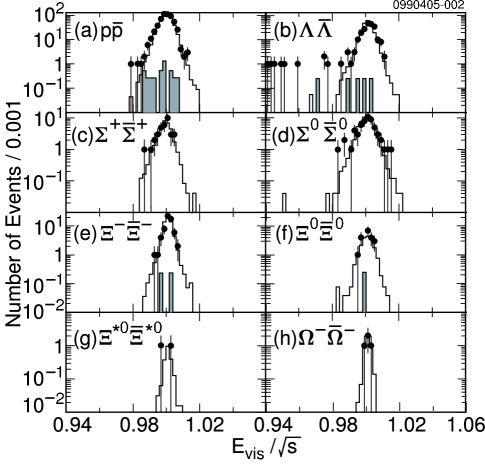
For each baryon-antibaryon candidate event, we calculated the scaled visible energy, , where is the energy observed in an event and is the center of mass energy. We define our signal region be , and two sideband regions of 0.94-0.98 and 1.02-1.06 as representative of the combinatorial background.
We also studied the continuum data to check for a possible contribution to our signals from this source. This was found to be non-negligible for four of the decay modes as shown in Table 1. We multiplied the yield from the continuum data by a scaling factor which was calculated taking into account the differences in luminosity (0.2720), a correction (0.9572) for baryons hel , and the values of the efficiencies in the CLEO III and CLEO-c detector configurations before subtracting it from the yields. This scaling factor was 0.2547 for the case and similar for the other modes.
Other possible background sources are the daughters from the decay combined with the charged or neutral transition pions which can produce possible cross-feed in the signal region. To estimate this cross-feed we generated corresponding Monte Carlo samples of 20,000 events and looked for events which passed our selection criteria for the modes concerned.
Figure 2 shows the scaled energy distribution for each of the decay modes. In all cases, clear signals are seen, with widths as expected from Monte Carlo simulation, and very little combinatorial background in the sideband regions. In each mode we calculate the number of decays to each final state (“signal yield”) (where is the total number of events in the signal region, events in the scaled sidebands, is the contribution from the cross-feeds, and is the scaled continuum contribution with scaled sidebands subtracted). These yields are shown in Table 1. The efficiencies, calculated using a weighted average of results from CLEO III and CLEO-c detector simulations, are also shown.
| Modes | Q() | |||||||
|---|---|---|---|---|---|---|---|---|
| 557 | 0.5 | 4.06 | 0 | 66.6% | 2.870.120.15 | 13.61.1 | 1.50.370.13 | |
| 208 | 4.5 | 0.86 | 0 | 20.1% | 3.280.230.25 | 25.23.5 | 2.0 90 CL | |
| 35 | 0.5 | 0 | 0.3 | 4.1% | 2.570.440.68 | - | - | |
| 58 | 0 | 0 | 0 | 7.2% | 2.630.350.21 | 20.74.2 | - | |
| 63 | 0 | 0.46 | 0 | 8.6% | 2.380.300.21 | 13.22.2 | 3.5 90 CL | |
| 19 | 0 | 0.49 | 0 | 2.4% | 2.750.640.61 | 14 90 CL | ||
| 2 | 0 | 0 | 0.6 | 0.6% | - | - | ||
| (3.2 90 CL) | ||||||||
| 4 | 0 | 0 | 0 | 1.9% | - | - | ||
| (1.6 90 CL) |
We evaluated the following systematic uncertainties to our measured branching fractions: 3 uncertainty on the number of decays in our sample; 1 uncertainty in the simulation of our hardware trigger; 1 uncertainty in the reconstruction in each charged track in the event; 1 uncertainty for proton identification of tracks coming from the beamspot, and 2 for proton and kaon identification of tracks coming from the secondary vertices; 1 and 2 uncertainties for photon detection and reconstruction, respectively; and 1 for background subtraction in mode. The detection efficiency also depends upon the angular distribution of the hyperons. We find a 10 change in efficiency when we change from a flat distribution in to one of the form (where ). The value of may not be strictly 1 because of effects due to finite charm quark mass model and hadron mass effect from and higher twist corrections to the effective QCD Lagrangian. We compare the detection efficiencies for spin one-half baryon generated samples as discussed above with that obtained by the E835 collaboration e835 and assign the difference, 3.3, as the systematic uncertainty. We assign a 10 uncertainty in angular distribution to spin 3/2 baryons, which covers all reasonable possibilities. The systematic uncertainty in the hyperon efficiency was estimated from a comparison of the efficiency of the various requirements in a data and Monte Carlo sample. This is largest for the and modes where the agreement is less satisfactory. In all modes the uncertainty in the reconstruction is doubled as there are two hyperons per event.
Table 2 displays the breakdown of our systematic uncertainties. The last column tabulates the total systematic uncertainty added in quadrature for each mode.
| Modes | Bkg. Sub. | Trigger | Tracking | Particle ID | Hyperon | / | Ang. Dist. | Total | |
|---|---|---|---|---|---|---|---|---|---|
| 3 | - | 1 | 2 1.0 | 2 1 | - | - | 3.3 | 4.2 | |
| 3 | 1 | 1 | 4 1.0 | 2 2 | 2 1.0 | - | 3.3 | 7.7 | |
| 3 | - | 1 | 2 1.0 | 2 2 | 2 12.8 | 2 2 | 3.3 | 26.5 | |
| 3 | - | 1 | 4 1.0 | 2 2 | 2 1.5 | 2 1 | 3.3 | 8.1 | |
| 3 | - | 1 | 6 1.0 | 2 2 | 2 1.5 | - | 3.3 | 9.0 | |
| 3 | - | 1 | 4 1.0 | 2 2 | 2 10.5 | - | 3.3 | 22.2 | |
| 3 | - | 1 | 8 1.0 | 2 2 | 2 2.0 | - | 10 | 14.4 | |
| 3 | - | 1 | 6 1.0 | 2 2+2 2 | 2 2.0 | - | 10 | 15.0 |
In Table 1, we show the measured branching fractions of decays to baryon-antibaryon modes. The branching fractions for octet baryons are in the range of 0.02 - 0.035 . Our measured branching fractions for hyperon modes are 50 higher than those in the PDG pdg which are based on lower statistics (12 and 8 events in the and modes, respectively). We note that isospin partners, and and also and , have similar branching ratios in agreement with naive expectations. Furthermore, we note that addition of strangeness does not greatly change the branching fraction, demonstrating the flavor symmetric nature of gluons. The eighth column in Table 1 shows the ratio of these results to those from measurements pdg . Two of the results follow the 12 rule closely, but two of them differ by approximately a factor of two. The last column in Table 1 shows the background subtracted continuum cross-section at GeV. We quote upper limits 90CL for the , , and production in continuum, owing to marginal signal. A 20 correction (upward) is included to account for the initial state radiation isr .
In conclusion, we have analyzed CLEO III and CLEO-c data corresponding to 3.08 decays. We have presented the first observation of the decaying to and final states, and give improved (high statistics) branching ratios for the decaying to , , , and modes. We also give new upper limits on and final states.
We gratefully acknowledge the effort of the CESR staff in providing us with excellent luminosity and running conditions. This work was supported by the National Science Foundation and the U.S. Department of Energy.
References
- (1) G.R. Farrar and R. D. Jackson, Phys. Rev. Lett. 35, 1416 (1975); B. L. Ioffe, Phys. Lett. B 63, 425 (1976); A. I. Vainshtein and V. I. Zakharov, Phys. Lett. B 72, 368 (1978); S. J. Brodsky and G. P. Lepage, Phys. Rev. D 24, 2848 (1981).
- (2) W. S. Hou and A. Soni, Phys. Rev. Lett. 50, 569 (1983); W. S. Hou, Phys. Rev. D 55, 6952 (1992); Y. F. Gu and X. H. Li, Phys. Rev. D 63, 114019 (2001).
- (3) BES Collaboration, J. Z. Bai et al., Phys. Rev. D 67, 052002 (2003); BES Collaboration, J. Z. Bai et al., Phys. Rev. D 69, 072001 (2004); BES Collaboration, M. Ablikim et al., Phys. Rev. D 70, 112003 (2004); BES Collaboration, M. Ablikim et al., Phys. Rev. D 70, 112007 (2004); CLEO Collaboration, N. E. Adam et al., Phys. Rev. Lett 94, 012005 (2005).
- (4) S. Eidelman et al., Phys. Lett. B 592, 1 (2004).
- (5) CESR-c Taskforce, CLEO-c Taskforce, and CLEO-c Collaboration, R. A. Briere et al., Report No. CLNS 01/1742 (revised 10/01), 2001.
- (6) G. Viehhauser et al., Nucl. Instrum. Methods A 462, 146 (2001); D. Peterson et al., Nucl. Instrum. Methods Phys. Res. A 478, 142 (2002); M. Artuso et al., Nucl. Instrum. Methods A 502, 91 (2003).
- (7) R. Brun et al., CERN Report No. DD/EE/84-1, 1987.
- (8) CLEO Collaboration, I. Danko et al., Phys. Rev. D 69, 052004 (2004).
- (9) M. Claudson, S. L. Glashow and M. B. Wise, Phys. Rev. D 25, 1345 (1982); C. Carimalo, Int. J. Mod. Phys. A 2, 249 (1987); F. Murgia and M. Melis, Phys. Rev. D 51, 3487 (1995).
- (10) E835 Collaboration, M. Ambrogiani et al., Phys. Lett. D 610, 177 (2005).
- (11) C. M. Carloni Calame et al., in Proceedings of the Workshop on Hadronic Cross-Section at Low-Energy (SIGHAD03), 8-10 October 2003, Pisa, Italy, edited by M. Incagli and G. Graziano (Elsevier, Amsterdam, 2004), p. 258.