CLEO RESULTS ON TRANSITIONS IN HEAVY QUARKONIA aaa Presented at 40th Rencontres De Moriond On QCD And High Energy Hadronic Interactions, 12-19 Mar 2005, La Thuile, Aosta Valley, Italy.
Recent CLEO results on electromagnetic and hadronic transitions in charmonium and bottomonium systems are reviewed.
1 Introduction
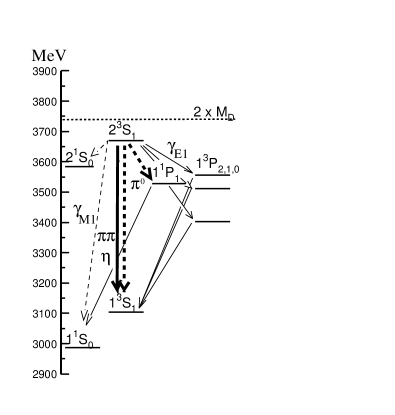
Heavy quarkonia states ( and ) below the open flavor threshold live long enough that their excitation level can be changed by emission of a photon or soft gluons turning into light hadrons. The triplet- states () can be directly formed in annihilation at the electron-positron storage rings. Then the other excitations levels can be observed via one or more transitions (Fig. 1). The CLEO-III experiment collected large samples at the end of CESR operations at the threshold region (, and million resonant decays respectively). These data samples are about a factor of 10 larger than previously available. Then the CESR beam energy was lowered to the threshold region. Three million resonant decays were recorded, split about equally between the CLEO-III and CLEO-c detectors (the latter has a small wire chamber replacing the CLEO-III silicon vertex detector). Even though this is not the world’s largest sample, it is nevertheless unique, since CLEO is the first detector studying the charmonium system with excellent detection of both charged particles and photons. Excellent particle identification capabilities of the CLEO detector are also important for some results presented here.

2 Observation of State
Spin-spin forces in heavy quarkonia are predicted to be short-range. Thus, while significant hyperfine splitting is observed for charmonium -states (e.g., 116 MeV for ), the mass splitting between the singlet state () and the center-of-gravity of the spin-triplet states () is expected to be small. The was sighted previously twice in annihilation at two different masses with marginal statistical significance. Higher statistics searches disproved these observations. We present highly significant evidence for this state, settling the question about its mass.
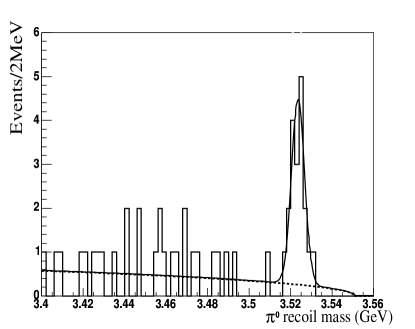
We have observed the state in isospin violating transitions from the resonance, followed by a highly favored E1 photon transition, (see Fig. 1a). Two essentially statistically independent approaches are used. In the inclusive approach, the is allowed to decay to anything. This approach results in a higher signal efficiency but also higher backgrounds. After imposing consistency of the reconstructed pair with the to transition, the -recoil mass is plotted (Fig. 2a). The photon four-vectors in the decay are constrained to the mass, substantially improving the recoil mass resolution. A peak of events, with a significance of 3.8 standard deviations, is observed.
In the second, exclusive, approach the is reconstructed in one of the following decay modes: , , , , , . Particle ID capabilities of the CLEO detector (RICH and dE/dX) are critical in this analysis. The reconstruction was optimized on the hindered M1 photon transitions: (see Fig. 1a). This approach results in excellent background suppression, but also in smaller signal efficiency. The recoil mass for the exclusive analysis is plotted in Fig. 2b. A peak of events is observed at the mass consistent with the inclusive analysis. The probability of the background fluctuating up to produce this peak is equivalent to a signal significance of 6.1 standard deviations.

The average of the inclusive and exclusive mass measurements, MeV, is MeV below the center-of-gravity of the states, confirming the conventional picture of spin-spin interactions. The measured product branching ratio, , is in the midrange of the theoretical predictions , which vary by 2 orders of magnitude due to difficulties in predicting the transition width.
3 Survey of to Transitions
We have performed a survey of to transitions, tagging by its annihilation to electron or muon pairs (). The is measured from the peak observed in the inclusive di-lepton mass distribution. Transition branching ratios for individual channels are measured by full reconstruction of the following exclusive event samples: , , , , (see Fig. 1a). The backgrounds are small and dominated by feed-across between the transition modes. They are subtracted using Monte Carlo simulations. The large statistics, the small backgrounds and the large, well-understood detector acceptance result in the precision measurements. The results are compared to previous measurements in Table 1. A more detailed description of this analysis can be found elsewhere . These are the most precise measurements to date. The difference between the inclusive and the sum over exclusive branching ratios is , leaving little room for other, yet undetected modes. Unlike previous measurements, the rate is half of the rate, as expected from the isospin symmetry. The branching ratios for two-photon cascades via the states are significantly higher than previously measured, which leads to significantly larger rates for .
| Channel | (%) | (%) | |||
|---|---|---|---|---|---|
| CLEO | PDG 2004 | E835 | CLEO | BES | |
4 First Evidence for Transitions
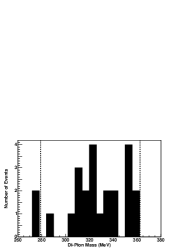
The transitions have been previously observed in the system between the states (). Such transitions are also expected among the states. We are presenting the first evidence for these transitions. The states are produced by the E1 photon transitions from the resonance (see Fig. 1b). The states are recognized by E1 photon transition to the , followed by annihilation to . We look for the transitions for or , which are expected to have the largest rate. The dominant backgrounds come from the other transitions in the system, , , (hereafter ) in particular (see Fig. 1b). The fully reconstructed events provide good background suppression but suffer from the small signal efficiency (), since the soft pions often curl-up and escape detection in the tracking system. Therefore, we have also selected events with only one detected pion (). For the di-pion events we define the signal, and other-backgrounds regions by cuts on the energy of the lower-energy photon (identifying the states) and the – recoil mass-difference (identifying the states). For the single-pion events the latter is replaced by a cut on the missing-mass of the event (reflecting the mass of the undetected pion). The observed event yields are compared to the estimated background rates in Table 2. After the background estimates are tuned to describe the observed background levels in the other-backgrounds sidebands, the observed event yields in the regions are also well reproduced. In contrast, the signal region contains an excess of events, which corresponds to a statistical significance of 6 standard deviations. The mass distribution in the signal region is plotted in Fig. 3. All results presented in this section are preliminary.
| Region | ||
|---|---|---|
| di-pion sample | ||
| other-backgrounds | 36 | |
| 10 | ||
| signal | 7 | |
| single-pion sample | ||
| other-backgrounds | 13 | |
| 26 | ||
| signal | 17 | |
Table 2.: The results for . Number of the observed () and estimated background events () are given in the other-backgrounds, and signal regions (see the text).
5 Photon transitions
We have analyzed inclusive photon spectra in the , and data for monochromatic photons due to E1 and M1 photon transitions (see Fig. 1). The results have been published and can be found elsewhere .
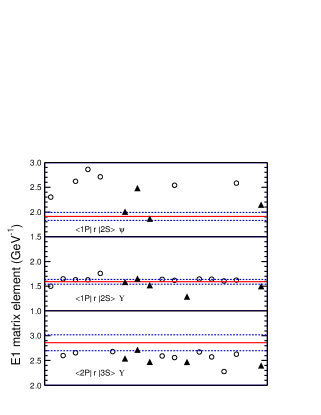
From the measurements of photon energies in the dominant E1 transitions, , ratios of the fine splittings in the triplet- states, , are determined with a high precision: ( ), ( ) and ( ). Somewhat surprisingly, the latter two are essentially equal.
In the non-relativistic limit, the E1 matrix elements for these transitions are independent. Thus, a ratio of the branching ratios () corrected for the phase-space factors () is expected to be 1 for any combination of values. The results are summarized in Table 3. While the ratios in the system reproduce this expectation, the rates to the state are lower. Relativistic corrections were predicted to be, in fact, the largest for the transitions to state . The ratios in the system are far from the non-relativistic prediction, apparently affected by the lighter quark mass and the mixing.
| Final state | (J=2)/(J=1) | (J=0)/(J=1) | (J=0)/(J=2) |
|---|---|---|---|
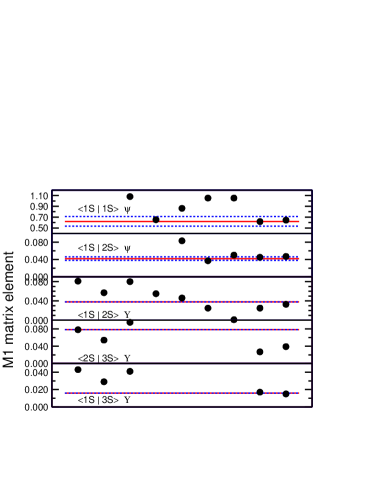
The absolute values of the branching ratios are also significantly below the non-relativistic predictions for the system. Relativistic corrections are needed to explain the observed rates, as illustrated in Fig. 4a. In contrast, the relativistic correction in the system are not large and even non-relativistic calculations give a reasonable description of the data. This is true only for the dominant E1 transitions. The E1 matrix elements for the transitions are expected to be small, reflecting large cancellations in the integral of the dipole operator between the and states. The relativistic corrections, and therefore the dependence, are expected to be large. We have measured the rate for the first time. The theoretical predictions are scattered in a wide range and only a few models match our data well .
While we have confirmed the hindered M1 transition , previously observed by Crystal Ball , their signal for the direct M1 transition is not observed in our data. This is not surprising in view of the recent mass measurements , which are inconsistent with the mass claimed by Crystal Ball. Searches for hindered M1 transitions in the system resulted in upper limits only, thus no singlet state has been observed to date. Only the most recent theoretical estimates of the expected M1 rates are consistent with all and data, and only marginally so with our limit on (see Fig. 4b).
Acknowledgments
The author thanks his CLEO colleagues for the input to this article. This work was supported by the National Science Foundation and the U.S. Department of Energy.
References
References
- [1] Quarkonium Working Group, N. Brambilla et al., hep-ph/0412158.
- [2] CLEO Collaboration, Y. Kubota et al., Nucl. Instrum. Meth. A 320, 66 (1992); G. Viehhauser et al., Nucl. Instrum. Meth. A 462, 146 (2001); D. Peterson et al., Nucl. Instrum. Meth. A 478, 142 (2002).
- [3] M. Artuso et al., Nucl. Instrum. Meth. A 502, 91 (2003).
- [4] R704 Collaboration, C. Baglin et al., Phys. Lett. B 171, 135 (1986); E760 Collaboration, T. A. Armstrong et al., Phys. Rev. Lett. 69, 2337 (1992).
- [5] Y. P. Kuang, Phys. Rev. D 65, 094024 (2002); S. Godfrey, J.L. Rosner, Phys. Rev. D 66, 014012 (2002); P. Ko, Phys. Rev. D 52, 1710 (1995).
- [6] CLEO Collaboration, N. E. Adam et al., arXiv:hep-ex/0503028.
- [7] Particle Data Group, S. Eidelman et al., Phys. Lett. B 592, 1 (2004).
- [8] BES Collaboration, M. Ablikim et al., Phys. Rev. D 70, 012003 (2004).
- [9] E835 Collaboration, M. Andreotti et al., Phys. Rev. D 71, 032006 (2005).
- [10] CLEO Collaboration, M. Artuso et al., Phys. Rev. Lett. 94, 032001 (2005); S. B. Athar et al., Phys. Rev. D 70, 112002 (2004).
- [11] P. Moxhay, J. L. Rosner, Phys. Rev. D 28, 1132 (1983); R. McClary, N. Byers, Phys. Rev. D 28, 1692 (1983).
- [12] Crystal Ball Collaboration, J.E. Gaiser et al., Phys. Rev. D 34, 711 (1986).
- [13] Crystal Ball Collaboration, C. Edwards et al., Phys. Rev. Lett. 48, 70 (1982).
- [14] Belle Collaboration, S.K. Choi et al., Phys. Rev. Lett. 89, 102001 (2002); CLEO Collaboration, D.M. Asner et al., Phys. Rev. Lett. 92, 142001 (2004); BaBar Collaboration, B. Aubert et al., Phys. Rev. Lett. 92, 142002 (2004).
- [15] CLEO Collaboration, G.S. Adams et al., Phys. Rev. Lett. 94, 012001 (2005).
- [16] The following predictions for the E1 matrix elements are displayed in Fig. 4a: D. Pignon, C. A. Piketty, Phys. Lett. B 74, 108 (1978); E. Eichten, K. Gottfried, T. Kinoshita, K. D. Lane, T. M. Yan, Phys. Rev. D 21, 203 (1980); W. Buchmuller, G. Grunberg, S.-H. Tye Phys. Rev. Lett. 45, 103 (1980), Phys. Rev. D 24, 132 (1981); C. Quigg, J. L. Rosner, Phys. Rev. D 23, 2625 (1981) (2 entries: , potential respectively); J. Baacke, Y. Igarashi, G. Kasperidus, Z. Phys. C 13, 131 (1982); R. McClary, N. Byers, Phys. Rev. D 28, 1692 (1983); P. Moxhay, J. L. Rosner, Phys. Rev. D 28, 1132 (1983); H. Grotch, D. A. Owen, K. J. Sebastian, Phys. Rev. D 30, 1924 (1984); S. N. Gupta, S. F. Radford, W. W. Repko, Phys. Rev. D 26, 3305 (1982), Phys. Rev. D 30, 2424 (1984); S. N. Gupta, S. F. Radford, W. W. Repko, Phys. Rev. D 34, 201 (1986); M. Bander, D. Silverman, B. Klima, U. Maor, Phys. Lett. B 134, 258 (1984), Phys. Rev. D 29, 2038 (1984), Phys. Rev. D 36, 3401 (1987); W. Kwong, J. L. Rosner, Phys. Rev. D 38, 279 (1988); L. P. Fulcher, Phys. Rev. D 37, 1259 (1988); S. N. Gupta, W. W. Repko, C. J. Suchyta III, Phys. Rev. D 39, 974 (1989); L. P. Fulcher, Phys. Rev. D 42, 2337 (1990); A. K. Grant, J. L. Rosener, E. Rynes, Phys. Rev. D 47, 1981 (1993); T. A. Lahde, Nucl. Phys. A 714, 183 (2003); M1 matrix elements in Fig. 4b: V. Zambetakis, N.Byers, Phys. Rev. D 28, 2908 (1983); H. Grotch, D. A. Owen, K. J. Sebastian, Phys. Rev. D 30, 1924 (1984) (2 entries: scalar and vector confinement potential); S. Godfrey, N. Isgur, Phys. Rev. D 32, 189 (1985) (2 entries: based on quoted transition moments and wave functions, respectively); X. Zhang, K. J. Sebastian, H. Grotch, Phys. Rev. D 44, 1606 (1991) (2 entries: scalar-vector and pure scalar confinement potential); D. Ebert, R. N. Faustov, V. O. Galkin Phys. Rev. D 67, 014027 (2003); T. A. Lahde, Nucl. Phys. A 714, 183 (2003). Values of the M1 matrix elements are displayed for the photon energies and quark mass assumed in S. Godfrey, J. L. Rosner, Phys. Rev. D 64, 074011 (2001), Erratum-ibid. 65, 039901 (2002).