Measurement of the scattering length from a new structure in the Dalitz plot
We report here the results of a study of a partial sample of decays recorded in 2003, showing an anomaly in the invariant mass () distribution in the region around where is the charged pion mass. This anomaly has never been seen in earlier experiments. It can be interpreted as an effect of the charge exchanging scattering process .
1 Beams, detectors and reconstruction
During the years 2003-04, the experiment NA48 at CERN SPS has collected a sample of fully reconstructed decays in order to study direct CP violation by comparing the Dalitz plot distributions of and . The experiment makes use of two overlapping simultaneous focused kaon beams of opposite charge and momentum of , selected by a system of “achromat” magnets and collimators. The two beams enter in a 114 m long decay volume and the final state is reconstructed by combining the signals coming from a spectrometer and from a liquid Krypton calorimeter (LKr) . The spectrometer, consisting of four drift chambers and a dipole magnet located between the second and the third chamber, allows to track the charged pion and to measure its momentum. The resolution is , where is in GeV. The calorimeter is used to reconstruct the decays. The resolution on energy is . The space resolution on the transverse coordinates can be parametrized as cm (E in GeV). Events with at least one charged particle track and at least four energy clusters in the LKr are selected for further analysis. The distance between any two -rays in the LKr is required to be larger than 10 cm and, in addition, the distance between each -ray and the impact point of any track on LKr must exceed 15cm. Other cuts ensure full containment of the electromagnetic shower in the LKr. The constraint of a common decay vertex for the two is used to pair the four photons. From now on the correct pairing is assumed to be (1,2) and (3,4). Momentum conservation and small angle approximation allow to compute the distance D of the decay vertex to the LKr and the two invariant mass as:
| (1) |
where are the energies of the i-th and j-th -ray and is their transverse distance at the LKr plane, is the mass. Note that both and computation involve only quantities measured by the LKr and no charge track parameters are used. This fact implies that even in the case of decays in flight, is correctly computed. Figure (1,left) shows the invariant mass distribution of the system . The distribution is dominated by the peak, as expected. Tails originate from decays in flight. The selection requires that the invariant mass differs from the nominal mass quoted in the PDG by no more than MeV. The fraction of events with wrong -ray pairing is as estimated by a Montecarlo simulation.


2 invariant mass distribution
Figure (1,middle) and (1,right) show the two neutral pions invariant squared mass . The r.m.s of the resolution curve increases with , varying between and at the end of the allowed range. This excellent resolution is the result of the intrinsic energy and spatial resolution of LKr. A sudden change in the slope (Cusp) near can be clearly seen. At this point the resolution on is . Such an anomaly has not been observed in previous experiments.
3 Interpretation of the cusp
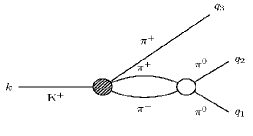
The observed sudden change of the slope suggests the presence of a threshold “Cusp” effect from the decay contributing to amplitude through the charge exchange reaction . This phenomenon has been recently discussed by Cabibbo who computed the amplitude taking into account the 1-loop diagram shown in figure 2. The diagram produces a discontinuity when the looping charged pions pair flips from off to on mass shell at the value . The PDG parametrization for the decay amplitude is given by
| (2) |
is the Lorentz-invariant variable where , and are the 4-momentum vectors respectively of the initial Kaon and of the three outgoing pions; and of course . In the Cabibbo theory, the diagram in figure 2 is responsible for a new term in the amplitude proportional to the difference between the and S-wave scattering lengths. The term changes from real to imaginary at . The distructive interference of and in the total amplitude is responsible for the cusp and for the apparent lack of event below the threshold. More recently Cabibbo and Isidori have extended the amplitude calculation at 2-loops level suggesting a precise way to extract the parameter from the data. The most recent theoretical prediction is given in reference .
4 Fit and results
| Model | |
|---|---|
| à la PDG (full region) | 15000/139 |
| à la PDG (above cusp) | 240/198 |
| Cabibbo 1-loop | 463/149 |
| Cabibbo-Isidori 2-loops | 159/147 |
| 2-loops and pionium | 154/146 |
Table 1 shows the obtained when the experimental spectrum is fitted against various model. The naive PDG description cannot account for the cusp structure observed and it gives a “crazy” although it seems to fit reasonably above the cusp. The Cabibbo 1-loop theory is still not adequate to fit the spectrum while the 2-loop calculation is quite satisfactory.
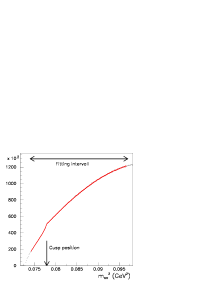

Figure 3 at left shows the best fit to data in the interval obtained by slightly modifying the Cabibbo-Isidori model to account for a small excess of event located exactly at on top of the observed cusp. This excess can be interpreted as formation of pionium. The pionium is the electromagnetic bound state which is expected to decay mainly in with a time constant sec. Figure 3 at right shows the distribution of the difference between data and fit when the pionium contribution is set to zero in the fit. A fixed amount of pionium derived by the estimation published in has been used for the final fit. The value found for the scattering length parameter is where the error is only statistical.
| Source | Error |
|---|---|
| skipping pionium | |
| Cut on photon to track distance | |
| Dependence on vertex position | |
| difference | |
| total |
A very conservative estimation of the systematic uncertainties is given in table 2. We tried to exclude 10 points around the cusp from the fit to reduce the sensitivity to the pionium component. Other checks have been performed by changing the cut on the minimum distance between photons and charged pion at the LKR or by selecting events in different region of the decay vertex. As a preliminary result we quote the value
The theoretical error, equal to the of the central value, has been suggested by Cabibbo and Isidori as the achieved accuracy in their model.
5 Conclusions
The invariant mass () measured from a sample of fully reconstructed decays collected by NA48/2 experiment at the CERN-SPS shows an anomaly at . This anomaly can be explained by a simple model based on contribution from the decay through the charge exchange reaction . A high-statistics measurement of the distribution could be used therefore to provide a precise determination of the scattering parameter . The expected increase of the event sample statistics by more than a factor 5 coming from the data collected in 2004 should provide a substantial reduction of the conservative systematics quoted here. The quality of the data calls for an improved theory including isospin breaking effects and radiative corrections.
References
- [1] I. Augustin, Nucl. Instrum. Methods A367, 88 (1995).
- [2] D.Béderède, Nucl. Instrum. Methods A403, 472 (1998).
- [3] N. Cabibbo, Phys. Rev. Lett. 93, 121801 (2004).
- [4] N. Cabibbo and G. Isidori, JHEP 503, 21 (2005).
- [5] G. Colangelo, Nucl. Phys. B 603, 125 (2001).
- [6] Z.K. Silagadze, JETP Lett. 60, 689 (1994).