Present address: ]University of Michigan, Ann Arbor, MI 48109, USA. HyperCP Collaboration
Search for the Lepton-Number-Violating Decay
Abstract
A sensitive search for the lepton-number-violating decay has been performed using a sample of hyperons produced in 800 GeV/ -Cu collisions. We obtain at 90% confidence, improving on the best previous limit by four orders of magnitude.
pacs:
13.30.Ce, 11.30.Hv, 14.20.Jn, 14.60.StThe conservation of lepton and lepton-family numbers (the latter notably violated by neutrino mixing) is one of the fundamental puzzles in physics thbackground . These conservation laws, while satisfied in the standard model, are based on no known deeper principle. For example, lepton-number conservation, unlike such global conservation laws as that for electric charge, is not associated with any local gauge invariance. With neutrino oscillation now established experimentally neutosc , models incorporating neutrino mass and lepton-family-number nonconservation must be considered. These typically feature lnv-models Majorana neutrinos, whose exchange changes the total lepton number by two units. Conversely, the observation of processes could imply the existence of massive Majorana neutrinos lnv-maj . Experimental searches for lepton-number nonconservation are thus of fundamental importance.
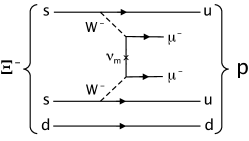
The most stringent limits on lepton-number nonconservation come from searches for neutrinoless double-beta () decay, the best being y (C.L.=90%) for 76Ge dbdec:heidelmoscow . However, searches for , where are hadrons, can provide complementary information. Figure 1 shows a possible mechanism. Predicting rates for such decays is challenging, since they depend sensitively on details of the underlying dynamics of neutrino mixing and of the hadronic matrix element littenberg2 ; shrock . These rates are unconstrained by limits on decays and by conversion rates of muons to electrons in nuclear interactions littenberg . Limits have been set on such processes in , , and decays at branching-ratio sensitivities ranging from to PDG . However, in the baryon sector, experimental knowledge on such decays is meager. The only available limits are PDG and littenberg ; the latter, based on 8150 events observed with the Brookhaven National Laboratory 31 in bubble chamber bnl74 , remains until now the best limit on processes in the hyperon sector.
We report a search for in the HyperCP experiment (Fermilab E871) based on decays — a vastly larger sample than previously available. The experimental arrangement (Fig. 2) and muon selection criteria are described in hypercp-kmumu .
In brief, a negatively charged secondary beam was formed by the interaction of 800 GeV/ primary protons from the Tevatron in a copper target, with the sign and momenta of secondaries selected by a 6.096-m-long curved collimator within a 1.667 T dipole magnetic field. The mean momentum of the secondaries was about 160 GeV/, with % FWHM momentum spread. The typical secondary-beam rate was 13 MHz at the exit of the collimator. Hyperon decays occurring within a 13-m-long evacuated pipe (the “vacuum decay region” of Fig. 2) were reconstructed in three dimensions in a series of high-rate multiwire proportional chambers (C1–C8), with wire spacings increasing from 1 to 2 mm. A pair of dipole magnets (“analyzing magnets”) deflected charged particles horizontally with a transverse-momentum kick of 1.43 GeV/. A pair of muon detector stations consisted of planes of vertical and horizontal proportional tubes with 2.54 cm pitch, interspersed with three layers of 0.75-m-thick iron absorber, followed by vertical and horizontal scintillation hodoscopes.
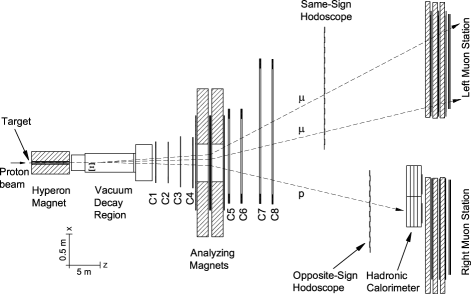
The trigger for online data acquisition used two scintillation-counter hodoscopes (“same-sign” and “opposite-sign hodoscopes” in Fig. 2), located sufficiently far downstream of the analyzing magnets that the hyperon decay products were well separated from the secondary beam. At least one hodoscope hit from a negative (same-sign) track in coincidence with one from a positive (opposite-sign) track was required for a trigger. To suppress muon and low-energy backgrounds, the trigger also required a minimum energy deposit in the hadronic calorimeter. The calorimeter energy threshold was set sufficiently low that the calorimeter trigger was more than % efficient for protons from decays within the secondary-beam momentum range.
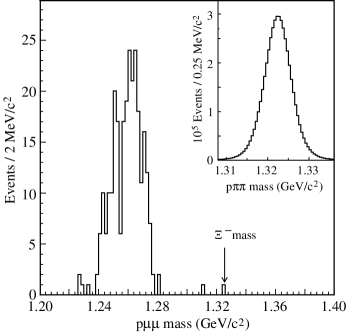
The decay gives two like-sign muon tracks and a proton track originating from a common vertex. The first stage of data reduction selected events with three tracks, at least one being a muon track. A muon track was one with hits in at least two of three muon proportional-tube planes in both the and views. Figure 3 shows the invariant-mass distribution, which is entirely dominated by background due to misidentified pions. In the next analysis stage, the muon requirement was tightened by requiring in-time hits in the muon hodoscopes corresponding to hits in the proportional tubes, and two negative muon tracks were required as well as a third track of opposite sign (assumed to be the proton). The total momentum of the three tracks was required to be between 120 and 250 GeV/, consistent with the momentum spectrum of the secondary beam.
Next, requirements were imposed on the decay vertex, which was reconstructed by fitting the three tracks to a common vertex using only the hits in C1–C4. To reduce backgrounds from interactions near in the collimator material and windows, and in windows near cm, the reconstructed vertex was required to lie well within the vacuum decay region (i.e., between 65 and 1285 cm downstream of the end of the collimator). To suppress the copious backgrounds due to two-vertex hyperon decay (such as the , decay chain with both pions misidentified as muons due to in-flight decay or punch-through in the muon detectors), requirements were imposed on the of the single-vertex fit, as well as on the average distance in the – plane between pairs of tracks at the position of the fitted vertex. (This average separation was calculated from the wire hits in C1–C4 without imposing the single-vertex constraint.) Based on the vertex- and average-separation distributions of clean decays, candidates were accepted if the was less than 2.5 and the average separation was less than 0.2 cm. To ensure that the parent hyperon was produced in the target, the parent-particle trajectory was traced back to the target and required to originate within 0.5 cm of the target center in both and (corresponding to 7 (5.6) standard deviations () of the resolution).

For further background rejection, events passing the above requirements were subjected to three invariant-mass requirements (, , and vetoes, respectively): (1) events with invariant mass between 473 and 513 MeV/ (corresponding to of the mass resolution) under the hypothesis were rejected as being decays; (2) if the invariant mass for either pair of oppositely charged tracks was between 1100 and 1125 MeV/ ( of the resolution), the event was rejected as having a ; (3) if the invariant mass under the hypothesis was between 1315 and 1330 MeV/ ( of the resolution) the event was rejected as being a , decay. These requirements were based on the observed sample and Monte Carlo (MC) simulations of the signal decay that indicated, for example, that decays interpreted as would yield a parent mass exceeding 1330 MeV/. In addition, since decays on average give a lower value of positive-track momentum than do decays, the positive-track momentum was required to exceed 56% of the total three-track momentum. This requirement was estimated to be 91% efficient for decays while rejecting over 90% of decays.
Events that passed all of the above requirements were reconstructed under the hypothesis. Figure 4 shows the resulting invariant-mass distribution.
There is one event within the 11-MeV/-wide search region corresponding to about the 1321.31 MeV/ PDG mass. We treat this event as background in determining an upper limit on . Since there is one event in the 11-MeV/-wide sideband below the search region and zero in that above the search region, the background is estimated as events.
The normalizing mode for this search was , recorded using the same trigger as the signal mode. It was studied in a “prescaled” sample: only every 100th event passing the first stage of data reduction was fully analyzed. The selection requirements were the same as for the signal mode, except that the - and -veto, single-vertex, and muon requirements were not made and the -decay vertex was allowed to lie beyond the vacuum decay region. The resulting invariant-mass distribution is shown in Fig. 4 (inset). The total number of reconstructed events that would have passed these requirements had every event been analyzed was , the error arising from the uncertainty in the background subtraction.
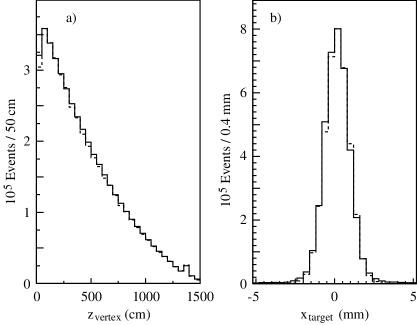
The MC simulation was verified by comparing the simulated events with data. Distributions of the reconstructed production point, momentum, decay vertex, and daughters’ spatial positions downstream of the analyzing magnets, for MC events and data, were compared and found to match well (see Fig. 5). The ’s were generated at the target in identical fashion for both the signal and normalizing modes. Since a theoretical calculation of the decay distribution is not available, it was simulated according to three-body phase space. The spectrometer acceptances for the signal and normalizing modes (for hyperons emerging from the downstream collimator aperture) were estimated to be 9.3% and 27.4% respectively, and the respective selection efficiencies (including detection and trackfinding efficiencies) were 31.7% and 81.1% decay-model . Table 1 shows the effect on MC and data events (in the mass range 1.315–1.330 GeV/) as the selection requirements are imposed.
| % surviving in | ||||
|---|---|---|---|---|
| Requirement | MC calculation | data | ||
| momentum | 82.6 | 89.9 | ||
| 73.6 | 58.7 | |||
| Single-vertex criteria | 59.1 | 8.43 | ||
| 59.1 | 7.29 | |||
| veto | 53.7 | 0.67 | ||
| and vetoes | 34.9 | 0.15 | ||
| Proton momentum fraction | 31.7 | 0.02 | ||
No signal was observed, and our result is dominated by statistical uncertainty. Nonetheless, we carried out studies of possible systematic effects. The largest systematic uncertainty, contributing less than %, was due to variations in relative acceptance between the signal and normalizing modes due to fluctuations in the position of the beam. The uncertainty due to imperfections in the MC simulation of the signal and normalizing modes was estimated by varying the parameters in the production model; the resulting rms variation in relative acceptance was found to be less than . Variations in muon-detector efficiencies were studied using data and the systematic effect on the muon-detection efficiency estimated at . There is also a % contribution to the normalization uncertainty due to our imperfect knowledge of PDG . (The contribution due to the uncertainty of is negligible PDG .) The combined systematic uncertainty in our measurement is thus %. To derive the 90%-C.L. upper limit on the signal branching ratio, we used a Monte Carlo simulation of a large sample of hypothetical experiments that took into account the Poisson fluctuation in the number of signal events observed along with the uncertainty of the background estimate and the uncertainty of the normalizing factor (both treated as Gaussian-distributed) Poisson-MC . The resulting upper limit was events.
The signal-mode branching fraction is thus
| (2) |
Here, denotes the number of events observed and and are the acceptance and efficiency, with subscripts sig designating the signal mode and norm the normalizing mode .
In summary, based on data from the 1997 run of HyperCP, we see no signal for the lepton-number-violating decay . We set an upper limit on the branching ratio at the 90% confidence level. Our measurement improves upon the existing limit by four orders of magnitude.
Acknowledgements.
We are indebted to the Fermilab staff for their hard work and dedication and to R. Shrock for valuable discussions. This work was supported by the U.S. Dept. of Energy and the National Science Council of Taiwan, R.O.C. D.M.K. acknowledges support from the U.K. Particle Physics and Astronomy Research Council and the hospitality of Imperial College London while this paper was in preparation. E.C.D. and K.S.N. were partially supported by the Institute for Nuclear and Particle Physics of the University of Virginia. K.B.L. was partially supported by the Miller Institute for Basic Research in Science.References
- (1) L. Wolfenstein, in Proc. XIth Int. Conf. on Neutrino Physics and Astrophysics, ed. K. Kleinknecht and E. A. Paschos (World Scientific, Singapore, 1984), p. 730; A. Zee, Phys. Lett. B 93, 389 (1980), A. Zee ibid. 95, 461(E) (1980); P. Langacker and D. London, Phys. Rev. D 38, 907 (1988); E. Witten, Nucl. Phys. Proc. Supp. 91, 3 (2001); B. Kayser, in Neutrino Mass, ed. G. Altarelli and K. Winter, Springer Tracts in Modern Physics Vol. 190 (Springer-Verlag, Heidelberg, 2003), p. 1.
- (2) Y. Fukuda et al., Phys. Rev. Lett. 82, 2644 (1999); Q. R. Ahmad et al., ibid. 89, 011302 (2002); K. Eguchi et al., ibid. 90, 021802 (2003).
- (3) S. Weinberg, Phys. Rev. Lett. 43, 1566 (1979); R. Barbieri, J. Ellis, and M. K. Gaillard, Phys. Lett. B 90, 249 (1980); M. Gell-Mann, P. Ramond, and R. Slansky, in Supergravity, ed. P. Van Nieuwenhuizen and D. Freedman (North Holland, Amsterdam, 1979); T. Yanagida, Prog. Theor. Phys. 64, 1103 (1980); J. L. Chkareuli and C. D. Frogatt, Phys. Lett. B 484, 87 (2000).
- (4) J. Schechter, J. W. F. Valle, Phys. Rev. D 25, 2951 (1982); see also C. Barbero, G. Lopez Castro, and A. Mariano, Phys. Lett. B 566, 98 (2003).
- (5) L. Baudis et al. , Phys. Rev. Lett. 83, 41 (1999); see also F. T. Avignone III, C. E. Aalseth, and R. L. Brodzinski, ibid. 85, 465 (2000).
- (6) L. Littenberg and R. Shrock, Phys. Lett. B 491, 285 (2000).
- (7) While the experimental limit presented here is of interest independently of any model, has been estimated in the -parity-violating SUSY model of littenberg2 to be , although other physics could possibly enhance it (R. Shrock, private communication).
- (8) L. S. Littenberg and R. E. Shrock, Phys. Rev. D 46, 892 (1992).
- (9) S. Eidelman et al., Phys. Lett. B 592, 1 (2004).
- (10) N. Yeh et al., Phys. Rev. D 10, 3545 (1974).
- (11) H. K. Park et al., Phys. Rev. Lett. 88, 111801 (2002); see also R. A. Burnstein et al., hep-ex/0405034 (2004), to appear in Nucl. Instrum. Meth.
- (12) The signal-mode acceptance times efficiency () is given for the assumed uniform-phase-space decay model, as is standard practice in the absence of a theoretical model; see, e.g., A. Alavi-Harati et al., Phys. Rev. Lett. 93 021805 (2004) and B. Aubert et al., Phys. Rev. Lett. 92, 121801 (2004). In five bins of dimuon mass from 0.2 to 0.4 GeV/, the values decrease monotonically from 10.3% at low mass to 1.9% at high mass.
- (13) R. D. Cousins and V. L. Highland, Nucl. Instrum. Methods A 320, 331 (1992); J. Conrad, O. Botner, A. Hallgren, and C. Perez de los Heros, Phys. Rev. D 67, 012002 (2003).