ELECTROWEAK MEASUREMENTS AT TEVATRON
Recent Run 2 experimental results on electroweak physics from the CDF and DØ collaborations at Tevatron are reviewed. We present measurements of the inclusive W and Z boson cross-sections times leptonic branching ratio as well as the forward-backward asymmetry and the charge asymmetry for collisions at TeV . The first Run 2 studies for the W width and W mass measurements are also reported. The di-boson production results are presented elsewhere .
1 Introduction
The Run 2 of the Tevatron is well underway and the accelerator, which collides protons against anti-protons at a center-of-mass energy of 1.96 TeV had delivered at the beginning of 2005 around of integrated luminosity to the two experiments CDF and DØ. CDF and DØ are analyzing these data to precisely study the properties of the and bosons performing an extensive electroweak program. This program starts by the measurements of the single W and Z production cross-sections with the boson decaying leptonically which allows to test Standard Model predictions. The decay channel also allows to demonstrate the ability of the experiments to identify ’s.
Measuring forward-backward asymmetry provides further tests of the Standard Model, while the charge asymmetry measurement provides constraints on the parton distribution functions (PDFs) of the proton. Another important part of the Tevatron electroweak program consists in measuring the W width and mass since a precise determination of the W mass together with the top mass measurement leads to an indirect determination of the mass of the still undiscovered Higgs boson.
Studying diboson production also gives constraints on new physics beyond the Standard Model. The Tevatron results on this subject is discussed elsewhere .
2 W and Z cross-sections measurements
2.1 W and Z cross-sections in electron(s) and muon(s) decay channels
The W and Z productions provide clean, abundant and well known signals. These signals both allow to test the Standard Model by performing cross-section ratios and are extensively used to calibrate and understand the detectors response as well as to measure identification efficiencies. The precise measurements of these cross-sections can also provide an independent cross-check of the luminosity measurement mainly determined by the total rate of inelastic collisions. At the Tevatron, single W and Z bosons are predominantly produced in the s-channel via quark anti-quark fusion. Due to the high level of QCD background, the signal from bosons decaying in the electron or muon channel is easier to identify.
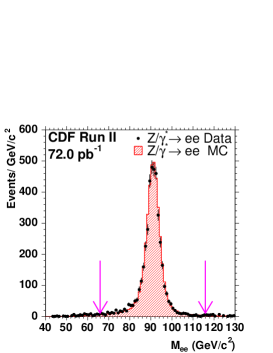
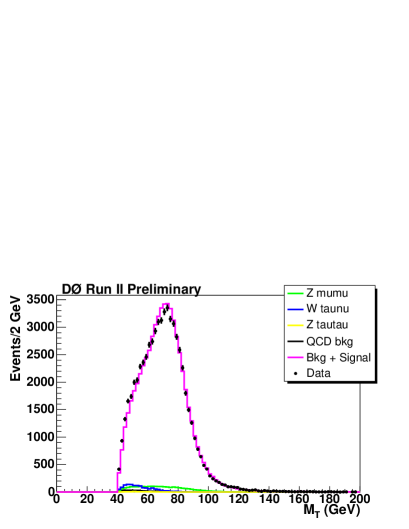
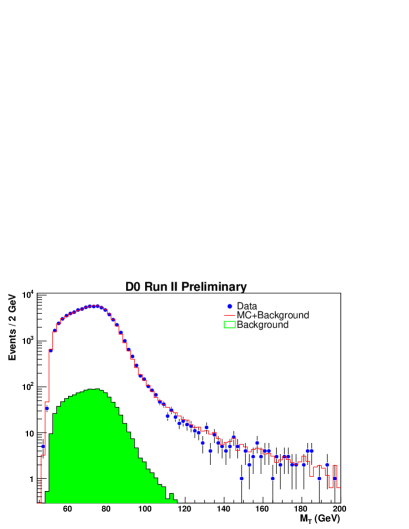
The and signals are characterized by at least one high transverse momentum charged lepton ( 15 to 25 GeV). In addition, the decay leads to a second high charged lepton while the decay generates large missing transverse energy ( 15 to 25 GeV) due to the undetected neutrino. Figure 1 shows an example of invariant mass and transverse mass distributions.
The main sources of background for those signals are QCD dijet events (where either the jets are faking or emitting a charged lepton or where jets are faking missing transverse energy) and electroweak background (W and Z decaying into (s) and for the W signal when one lepton escapes detection). The QCD background is evaluated using data and represents 1 to 2% while the electroweak background is evaluated using Monte Carlo simulation (1 to 6 %).
Tables 1 and 2 summarize CDF and DØ results. It can be seen that the largest error comes from the luminosity determination (around 6%). Apart from this one, the cross-section measurements are limited by systematic uncertainties. The main source of systematic uncertainties comes from the PDFs error (around 1.5%).
| Process | Integrated luminosity used | .Br in pb measured in CDF |
| (central) | ||
| (plug) | ||
| Process | Integrated luminosity used | .Br in pb measured in DØ |
|---|---|---|
Using these results, one can compute the R ratio of the W to Z cross-sections in the electron or muon channel (see equation 1) where the luminosity uncertainties cancel. CDF reports the following R ratio for the combined electron and muon channel using 72 :
DØ reports a R ratio in the electron channel using 177 :
This ratio is related to the total W width in the following way:
| (1) |
Taking the NLO calculation for the ratio of the production cross-sections , the Z to charged lepton branching ratio from the world average (dominated by LEP measurements) and the theoritical value for the W partial width into lepton , one can extract the W total width . CDF made this extraction and reported GeV compatible with the world average GeV and the Standard Model expectation GeV.
2.2 and cross-sections into tau(s)
In a hadronic environment, the reconstruction of leptons is challenging. Measuring the W and Z cross-sections in the channel proves the ability of the detector to reconstruct ’s in addition to provide test of the Standard Model. Final states into leptons are also interesting as they are predicted and sometimes even enhanced in models of new physics.
DØ has measured the cross-section with one decaying into a muon () on which one can trigger and the other one into hadrons . A neural network technique is used to identify the ’s decaying hadronically depending of their decay products (single , multiple ’s or decay). The main backgrounds for this channel arise from QCD events (around 50%) and or (around 6%). The main systematic uncertainties come from trigger efficiency determination (3.5%) and QCD background determination performed on data (3.5%). The result using of data is:
| (2) |
CDF has measured the cross-section when the is decaying hadronically. The is reconstructed as one or three charged tracks that match a narrow calorimeter cluster. The main backgrounds for this channel come again from QCD dijet events (15%) and from (4%). The main source of systematic uncertainty is the identification efficiency determination (5.5%). Using of data, the result is:
| (3) |
2.3 Cross-section summary
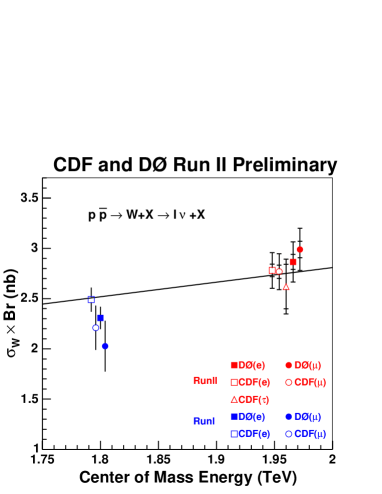
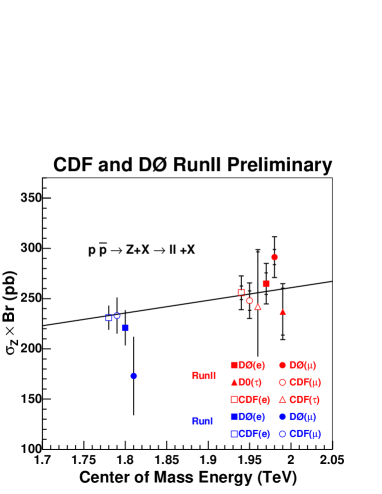
All the Tevatron inclusive W and Z cross-section measurements are summarized in Figure 2.
The ratio of the and cross-sections or the ratio of the and cross-sections provide test of the lepton coupling universality to the W boson. CDF has for instance reported a ratio that is well compatible with lepton universality:
3 forward-backward asymmetry
The vector and axial-vector nature of the fermion couplings to the leads to an asymmetry in the decay lepton angle in the process . If is the angle between the incoming quark and the outgoing lepton in the rest frame of the dilepton pair, the dilepton production cross-section can be written as:
| (4) |
where and are constant and is the forward-backward asymmetry which can be defined as:
| (5) |
This asymmetry can be measured by counting the normalized difference between the number of events with positive () and negative () . Besides the ability to probe the relative strength of couplings between the boson and the quarks, is also sensitive to additional non-SM contribution to the process that are predicted by Z’ or extra-dimension models for instance. Measuring at the Tevatron is then complementary to direct searches in the high dilepton invariant mass region above LEP sensitivity.
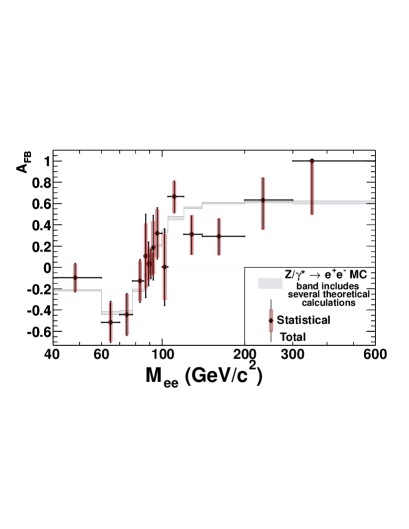
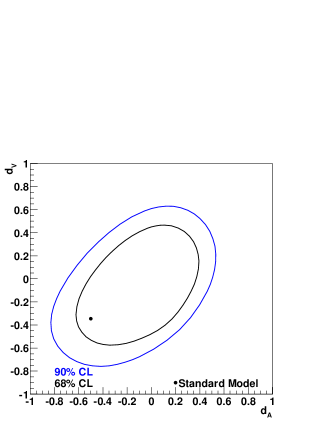
CDF made the measurement using selecting high dielectrons both in the central and plug (forward) calorimeters . The main background in the sample comes from dijet events (around 3%). An unconstrained unfolding method is used to take into account the acceptance and the bin migration effects due to radiation and detector energy resolution. The result of the measurement is shown in Figure 3 (left). Expressing in term of -quark and -electron coupling constants, one can extract the values of these couplings from the measurement. The results are shown in Figure 3 (right) for the d quark couplings. Finally performing a fit where the quark and electron couplings to the are expressed as a function of gives with . These results are compatible with the SM predictions but are currently statistically limited. They will improve with higher statistics.
4 charge asymmetry
As we have seen for the cross-section measurements (section 2), many of the precision measurements at a hadron collider are limited by the PDFs uncertainties. Improving the knowledge of these PDFs is then an important task. One way to achieve this is to measure the charge asymmetry which then gives an input on the u and d components of the proton.
As the u quark carries on average a higher fraction of the proton momentum than the d quark, the produced via the process tends to be boosted in the proton direction (u direction). This leads to a forward-backward charge asymmetry for the bosons defined as:
| (6) |
where is the rapidity of the W boson and the differential production cross-sections. The W rapidity is sensitive to the difference between the u and d quark momenta. As it is not possible to measure directly the rapidity of the W bosons due to the unknown longitudinal momentum of the escaping neutrino from the W decay, one instead measures the pseudo-rapidity of the decay lepton .
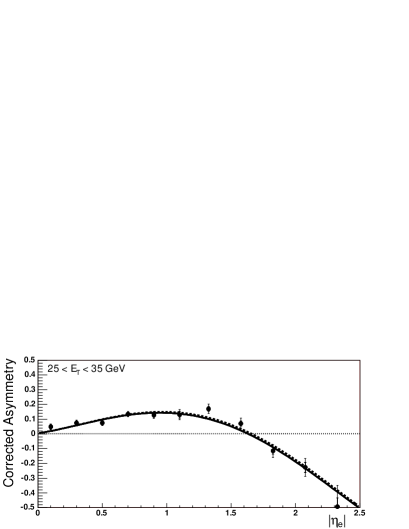
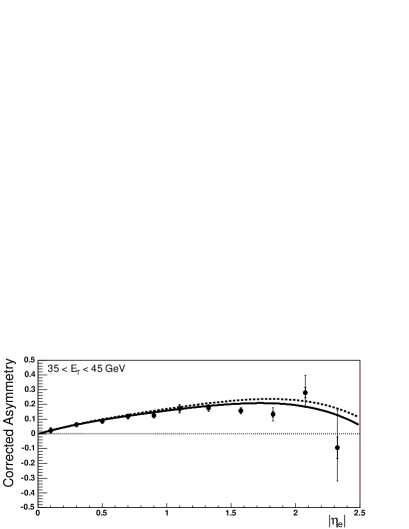
CDF reports a measurement of the charge asymmetry in the electron channel using . Here the main experimental challenge is to measure the charge misidentification in the forward region i.e. to understand the tracking system in the forward region where the PDFs are less constrained. The main background in this channel comes from dijet events (2% in the central part and 15% in the forward calorimeter).
The results are shown in Figure 4 after correction for the charge misidentification and after background subtraction. As no indication of CP asymmetry between positive and negative values is found, the results are shown as a function of . The shape of the curves comes from two competing effects: first the boost of the in the proton direction as explained above and second the V-A nature of the coupling that favors a positron emission opposite to the direction in the rest frame. Future inclusion of these results in the PDF fits will allow to reduce PDFs uncertainties.
5 width and mass
Precise measurements of the W mass and couplings test the nature of the electroweak symmetry breaking. The top, W and Higgs masses are actually related through the following formula:
| (7) |
where the electroweak loop corrections are hidden in ( is the electromagnetic coupling constant and the Fermi coupling constant measured in muon decay). depends on the top and Higgs masses in the following way and . So measuring and yields indirect constraints on the Higgs mass .
As the longitudinal momentum of neutrino in the process is not known, the W mass (resp. width) is extracted from the Jacobian edge (resp. high mass tail) of the W transverse mass defined as . These measurements require the best possible knowledge of the detector reponses.
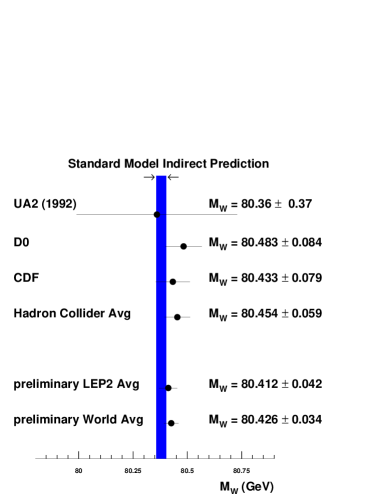
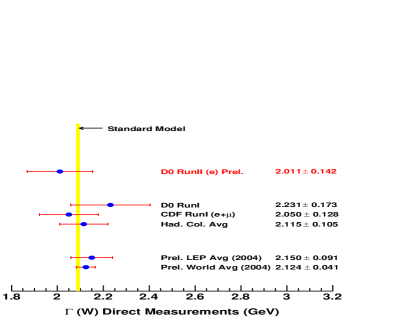
The final Tevatron Run 1 CDF and DØ combined W mass and width measurements have been published last year leading to the results shown in Figure 5.
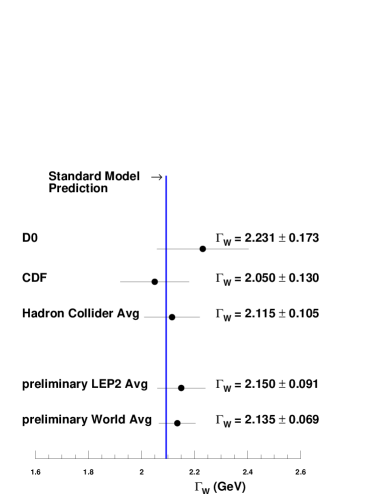
5.1 W width measurement
DØ has performed a first direct measurement of the W width using of Run 2 data in the electron channel. The method is to fit the W transverse mass distribution in the region GeV. This method requires a simulation program that takes well into account the electromagnetic calorimeter response and resolution observed in the data. Figure 6 (left) shows the data and Monte Carlo agreement. The main systematic uncertainties in the measurement come from hadronic response and resolution (64 MeV), on modelling of the underlying event (47 MeV) and electromagnetic calorimeter response (30 MeV). The obtained result is:
Figure 6 shows that the achieved uncertainty is comparable to the Run 1 error.
5.2 W mass analysis
CDF has performed a first pass of the W mass analysis using of Run 2 data by determining the uncertainties in both the electron and muon channels. For this analysis, the muon momentum scale is set using and signals and the electron energy scale is set using the ratio of the energy measured in the calorimeter with the electron momentum measured in the tracking. This electromagnetic energy scale is corrected for non-linearity. The invariant mass is used to tune and cross-check this energy scale. The modelling of the hadronic system that recoils against the W boson is tuned using events. At large Z transverse momentum , the hadronic resolution is dominated by jet resolution while at low , it is dominated by the modelling of underlying event. This underlying event is modelled using minimum bias data.
The list of systematic uncertainties in both the electron and muon channels is shown in Table 3. Combining all these uncertainties leads to a global systematic error of 76 MeV which is already lower than the CDF Run I systematic error (79 MeV). We expect the first Run 2 W mass measurement soon.
| e channel | channel | |
|---|---|---|
| Lepton energy scale and resolution | 70 | 30 |
| Recoil scale and resolution | 50 | 50 |
| Statistics | 45 | 50 |
| Production and decay model | 30 | 30 |
| Background | 20 | 20 |
6 Conclusion
The Tevatron has an extensive electroweak program that is well underway. All the inclusive single boson cross-sections have been determined including the ones with in the final state. The /Drell-Yan forward-backward asymmetry as well as the charge asymmetry has been measured and the W mass program is in an advanced stage. All the results found are currently consistent with the Standard Model expectations.
We expect CDF and DØ to provide higher precision measurements in the incoming years as the recorded luminosity is growing.
References
References
- [1] G. De Lentdecker, Di-boson production at the Tevatron, These Proceedings.
- [2] D. Acosta et al. (CDF Collaboration), Phys. Rev. Lett. 94, 091803 (2005).
-
[3]
A. D. Martin et al., hep-ph/0308087;
P.J. Sutton, A. D, Martin, R.G. Roberts and W. J. Stirling, Phys. Rev. D45, 2349 (1992);
P. J. Rijken and W. L. van Neerven, Phys. Rev. D51, 44 (1995);
R. Hamberg, W. L. van Neerven and W. B. Kilgore, Nucl. Phys. B359, 343 (1991);
R. V. Harlander and W. B. Kilgore, Phys. Rev. Lett. 88, 201801 (2002). - [4] K. Hagiwara et al., Phys. Rev. D66, 010001 (2002).
- [5] S. Eidelman et al., Phys. Lett. B592, 1 (2004).
- [6] V.M. Abazov et al. (DØ Collaboration), Phys. Rev. D71, 072004 (2005).
- [7] C.R. Hamberg, W. L. van Neerven and T. Matsuura, Nucl. Phys. B359, 343 (1991).
- [8] D. Acosta et al. (CDF Collaboration), hep-ex/0411059, submitted to Phys. Rev. D.
- [9] D. Acosta et al. (CDF Collaboration), Phys. Rev. D71, 051104 (2005).
- [10] J. Pumplin, D. R. Stump, J. Huston, H. L. Lai, P. Nadolsky and W. K. Tung, JHEP 0207:012 (2002).
- [11] A. Martin, R. Roberts, W. Stirling and R. Thorne, Eur. Phys. J. C 4, 463 (1998).
- [12] F. Landry, R. Brock, P. M. Nadolsky, C. P. Yuan, Phys. Rev. D67, 073106 (2003).
- [13] LEP Electroweak Working Group, http://lepewwg.web.cern.ch/LEPEWWG/
- [14] M. Abazov et al. (CDF and DØ Collaborations), Phys. Rev. D70, 092008 (2004).