A precision determination of the mass of the meson
Abstract
Several processes of meson production in proton-deuteron collisions have been measured simultaneously using a calibrated magnetic spectrograph. Among these processes, the meson is seen clearly as a sharp missing-mass peak on a slowly varying background in the reaction. Knowing the kinematics of the other reactions with well determined masses, it is possible to deduce a precise mass for the meson. The final result, , is significantly lower than that found by the recent NA48 measurement, though it is consistent with values obtained in earlier counter experiments.
keywords:
Eta meson production; meson massPACS:
13.75.-n, 14.40.Aq, , , , , , , , , , , , , , , , , , , , , , , , , , , , , , , , , Compared to other light mesons, the mass of the is surprisingly poorly known. Though the Particle Data Group (PDG) quote a value of in their 2004 review [1], this error hides differences of up to 0.7 MeV/c2 between the results of some of the modern counter experiments quoted. The PDG average is in fact dominated by the result of the CERN NA48 experiment, , which is based upon the study of the kinematics of the six photons from the decay of 110 GeV -mesons [2]. In the other experiments employing electronic detectors, which typically suggest a mass lighter, the was produced much closer to threshold and its mass primarily determined through a missing-mass technique where, unlike the NA48 experiment, precise knowledge of the beam momentum plays an essential part. In the Rutherford Laboratory experiment the momentum of the pion beam in the reaction was fixed macroscopically using the floating wire technique [3]. In the measurement making use of the photoproduction reaction , the energy of the electrons that were the source of the bremsstrahlung photons was fixed to a relative precision of by measuring the distance of the beam paths in the third race track microtron of the MAMI accelerator [4]. In the Saclay SATURNE experiment a high resolution, but small acceptance, spectrometer was used and, through an ingenious series of measurements on different nuclear reactions, the beam energy and spectrograph settings were both calibrated. The value of the mass was then extracted from the missing-mass peak in the reaction [5].
In an attempt to clarify the situation, we have performed an experiment at COSY in Jülich specifically designed to determine the -mass with high precision. The methodology is very similar in spirit to that used at SATURNE [5] in that several reactions were measured, thus allowing one to calibrate the accelerator beam and the detector and hence to measure the -mass with potentially a very small systematic error. The crucial difference from SATURNE is that the spectrograph (Big Karl) that we have used has a large acceptance. Therefore all the reactions could be studied simultaneously.
Following ideas already developed in Ref. [6], we have measured simultaneously the following three reactions:
| (1) | |||||
| (2) | |||||
| (3) |
where in each case it was the first particle on the right that was measured.

Charged particles were detected with the help of Big Karl, a focussing 3Q2DQ magnetic spectrograph whose principal elements are indicated in Fig. 1. It should be noted that the final quadrupole magnet was not actually used in this study. We define the beam to be incident in the -direction, with the -direction being vertical, and the -direction horizontal and perpendicular to the beam. The optics with respect to the horizontal and vertical motions are almost decoupled in Big Karl [7]. In the horizontal direction the spectrograph has a point-to-point imaging from the target to the focal plane with dispersion whereas, in the vertical direction, it operates in the point-to-parallel mode.
Tracks were measured with two packs of multiwire drift chambers (MWDCs). Each pack consists of six layers, allowing a precise determination of the position of a charged particle. The drift time measurement was started by a signal from the hodoscope layer P and an individual drift time calibration was performed for each particle type. Signals from hodoscope layers P and R, approximately 3.5 m apart, were used for a time-of-flight measurement. Together with specific energy loss in the scintillators and the momentum vector, this allowed particle identification and hence a determination of the energy of the particle. It is important to note that at a beam momentum around 1640 MeV/c all three reactions can be observed simultaneously with a single setting of the Big Karl magnetic fields. The first two reactions were used to calibrate the beam and the spectrograph with the third determining .
The precision of a missing mass measurement depends on the accuracy with which the four-momentum vectors of the incident particles in the entrance channel and of the detected particle in the exit channel are known. In order to define well the reaction vertex, a liquid deuterium target only 2 mm thick was employed [8]. The Mylar windows were only 1 m thick, thus making background reactions in the window material negligible. The target was operated at a temperature of 18.7 K which can lead to freezing out of residual gas on the windows. The target was therefore cleaned by warming it up periodically. The proton beam at COSY was electron-cooled at injection energy and then stochastically extracted, which resulted in the following beam properties (uncooled beam properties in brackets): , mrad, mrad. It can be seen that electron cooling gave an important improvement for this experiment. Another benefit from the cooling was the reduction in the beam halo and hence in the associated background.
We start by discussing the principles of a momentum measurement with the magnetic spectrograph. At any specified position in the system, an arbitrary charged particle is represented by a column vector , whose components are the positions, angles, and momentum of the particle with respect to the reference trajectory, which is chosen to be the -axis. This vector then reads:
| (4) |
where we have used the following definitions:
is the horizontal displacement of an arbitrary ray (or particle track) with respect to the assumed central trajectory.
is the tangent of the angle that this ray makes in the horizontal plane with respect to the assumed central trajectory.
is the vertical displacement of the ray with respect to the assumed central trajectory.
is the tangent of the vertical angle of the ray with respect to the assumed central trajectory.
is the path length difference between the actual ray and the central trajectory.
is the fractional momentum deviation of the ray from the assumed central trajectory which corresponds to the assumed Big Karl central momentum .
For any two different positions in the overall system, such as the target () and the focal plane (), the corresponding vectors are connected through the transport matrix
| (5) |
The matrix elements were not necessary constant and, where needed, they were expanded in powers of . The most important parameter in the transport matrix for the reconstruction of the momentum in the present case is the element , which is the dispersion. Some of the other elements are either zero or small and can be neglected, whereas others, including , must be determined using data from calibration measurements, which will be discussed now.
A low intensity 793 MeV/c proton beam and empty target were used to investigate the dependence of on . For this purpose the central momentum was changed and the proton tracks reconstructed in the drift chambers. Before each such measurement the magnetic fields in the dipoles were set and measured with nuclear magnetic resonance probes; the differences between the predicted and measured values of the field was of order . We measured in this way twice at 17 values of the central momentum.
The next calibration was based upon detecting the deuterons from the reaction, also at 793 MeV/c. At this momentum the spectrograph has full acceptance for this reaction and this momentum is close to 804.4 MeV/c, the central spectrograph momentum, where all three reactions (1), (2), and (3) fit into the acceptance. In the time-of-flight part of the set-up shown in Fig. 1 we used an additional scintillator layer, S, in the veto mode. A 5 cm aluminum absorber was placed between this and the R layer. This thickness was sufficient to stop deuterons, but not protons with the same momentum. This reduced the background originating from the direct beam protons that have a momentum close to those of detected deuterons.
Finally we studied the reaction at a beam momentum of 1642 MeV/c. The central momentum of the spectrograph was again varied and the pions measured for 12 different field settings.
From each calibration experiment the values of the possible parameters were extracted and these were used as start values to fix all the elements of the transport matrix in one least-squares fit to all of the calibration measurements.
For the production runs measuring reactions (1), (2) and (3) simultaneously, the spectrograph was set to the nominal momentum MeV/c. The experiment was performed in a series of runs that were analyzed separately. This analysis yielded an unexpected result, indicating a change in some parameters with time. One possible cause could have been a variation of the magnetic fields in the dipoles. However, this is contrary to the very high precision measurements of the fields with NMR probes and so the variation must have another origin. This was found when inspecting the target thickness as a function of time.
Although the target was rather thin, corrections were made for the energy losses of the particles. While for pions this correction is negligible, and for tritons it is modest, for ions it is significant. We then proceeded as follows. The MeV/c setting was, in a first approximation, assumed to be exact and constant with time. The beam momentum, target thickness, and -mass were then free parameters to be fit to the data. In a second step, we checked the approximations made by inverting the calibration method. The spectrograph was assumed to be at its nominal value and the missing masses of the particles were derived. This comparison yields a measure of the precision to which our method works and give us an estimate of the systematic errors.
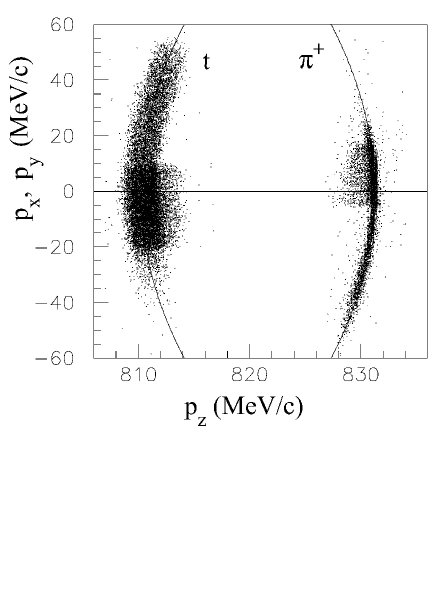
In Fig. 2 coincident events from reactions (1) and (2) are shown in terms of their longitudinal and transverse momentum components. The expected kinematic loci are rotational ellipsoids in three dimensions. Projections of their surfaces are shown as curves.
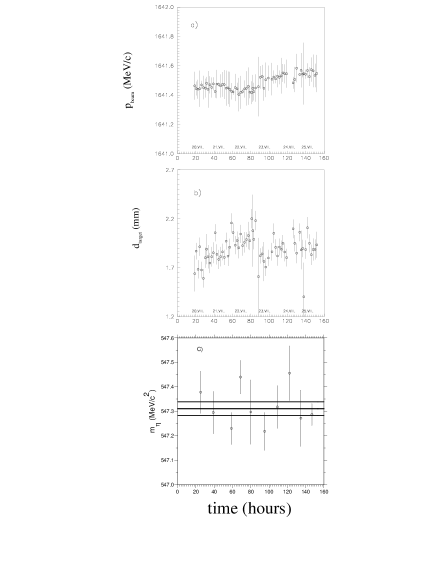
The beam momentum was deduced from the measurement of the pion four-momenta, which are almost unaffected by the target thickness (see Fig. 2). The target thickness was then deduced from the measurement of the four-momenta of the tritons. The results of these two measurements are shown in Fig. 3 as functions of the time of measurement. The beam momentum was found to be quite stable, with a variation from the beginning to the end of the experiment of only ! However, the target thickness showed a steady increase with time. Sixty hours after the beginning of the experiment there was an interruption during which the target was warmed up and any possible freeze-out on the windows was removed. It should be noted that the increase of effective target thickness corresponds to a freeze-out of m frozen air within hours. As shown in Fig. 3b, after the interruption at 88 hours the effective target thickness may have started to increase once again.
We are now in a position to extract the value of from the missing mass distribution in the reaction using the four-momenta of the -ions measured simultaneously with reactions (1) and (2). Our extracted values of the mass are shown as a function of measuring time in Fig. 3c where, because of the limited count rate, several runs have been grouped together. No correlation is visible with the other two reconstructed observables. Also shown is the mean value and the uncertainty. The combined missing mass distribution for all events is shown in Fig. 4, together with a fit in terms of a Gaussian peak on top of an almost constant linear background corresponding to multipion production. The width of the peak is in accord with Monte Carlo simulations of this reaction.

To get an estimate of some of the systematic errors, we investigated the influence of the assumption that the mean momentum setting of the spectrograph is known. For this purpose we applied the deduced parameters and kept the mass of the measured particle as a variable. In the case of the direct beam this is of course zero whereas for at 793 MeV/c it is the and for at 1642 MeV/c it is the deuteron. The deviations from the , and masses are shown in Fig. 5.

The mean mass differences are keV/c2 for protons, keV/c2 for pions, and keV/c2 for deuterons. The average of these, which is one measure of the systematic error, is keV/c2, and this interval is shown in Fig. 5. Now there seems to be a stronger deviation of the missing mass from the true value for larger positive values of but it is important to note that the -mass was determined at the position where the deviation is minimal.
Another systematic error arises from the uncertainty in the liquid deuterium density depending on the target temperature. This uncertainty was studied with the help of the codes GEANT3 [9] and SRIM [10], gives only an additional 0.004 MeV/c2 to the systematic error.
The final result of our measurement is
| (6) |

Our value of the mass of the meson is compared in
Fig. 6 with the results of all other measurements
taken into consideration in the current PDG
compilation [1]. Though significantly smaller than that
reported in the NA48 experiment [2], it is in excellent
agreement with the other results. This is very puzzling in that
the NA48 experiment yields an excellent value for the mass,
also through the decay, though the statistics were then
much higher and the systematics not completely identical.
The quality of the beam necessary for the success of this work is due mainly to the efforts of the COSY operator crew. Support by Internationales Büro des BMBF (IND 01/022), SGA, Slovakia (1/1020/04), and the Forschungszentrum Jülich is gratefully acknowledged.
References
- [1] Particle Data Group: S. Eidelman et al, Phys. Lett. B 592 (2004) 1.
- [2] A. Lai et al., Phys. Lett. B 533 (2002) 196.
- [3] A. Duane et al., Phys. Rev. Lett. 32 (1972) 425.
- [4] B. Krusche et al., Z. Phys. A 351 (1995) 237; B. Krusche, Habilitationsschrift, Justus-Liebig-Universität Gießen (1995).
- [5] F. Plouin et al., Phys. Lett. B 276 (1992) 526.
- [6] M. G. Betigeri et al. (The GEM Collaboration), Nucl. Instrum. Methods A 426 (1999) 249.
- [7] M. Drochner et al. (The GEM Collaboration), Nucl. Phys. A 643 (1998) 55.
- [8] V. Jaeckle et al., Nucl. Instrum. Methods A 349 (1994) 15.
- [9] GEANT3 manual, CERN Program Library, W5013.
- [10] J. F. Ziegler and J. P. Biersack, Program SRIM2003, www.srim.org.