Deceased]
To whom correspondence should be addressed.
Electronic address: ragomes@ifi.unicamp.br]
Permanent address: ]C.P.P. Marseille/C.N.R.S., France
Observation of the Decay
Abstract
The muon semi-leptonic decay has been observed for the first time with nine identified events using the KTeV beam line and detector at Fermilab. The decay is normalized to the beta decay mode and yields a value for the ratio of decay rates of . This is in agreement with the SU(3) flavor symmetric quark model.
pacs:
13.30.Ce, 14.20.JnWe report the first observation of the muon semi-leptonic decay, , and measurement of its decay rate normalized to the topologically identical beta decay, . This measurement was performed at the KTeV experiment at Fermilab, using methods similar to the first observation of the beta decay affolder . The present observation is a new contribution to the study of hyperon semi-leptonic decays, whose study elucidates the structure of hadrons csw .
The flavor symmetric quark model with the Cabbibo-Koboyashi-Maskawa ckm matrix elements and form factors obtained from Baryon semi-leptonic decays can be used to predict garcia the decay rate of , where = or . Lepton flavor symmetry (traditionally called universality in this context) requires that the and mode decay rates differ only through the differing charged lepton mass values which appear in phase space factors, radiative corrections and terms higher order in , where is the difference between initial and final baryon masses. A calculation using the form factors described in Ref. garcia and the latest value for the mass from Ref. pdg yields . Therefore the observation of the muonic decay mode and its ratio to the electron mode serves as a test of the Standard Model description of these decays and the assumption of lepton universality.
The observation reported here is based on the 1999 data set collected during the E799-II (rare decay) configuration of KTeV arisaka . The experiment, while mostly known as a high precision investigation of CP violation with an extensive rare kaon decay program, also afforded the opportunity of studying neutral hyperons ( and ). The KTeV beam line and detector used for these hyperon studies have been extensively described in Ref. affolder , therefore only the main components are recalled. An intense 800 GeV/ proton beam from the Tevatron was directed onto a BeO target at a vertical angle of 4.8 mrad. Photons were converted by a lead absorber 20 m from the target and charged particles were swept out of the beam by a series of dipole magnets. Collimators defined two secondary neutral beams that entered a 65 m long vacuum tank, which determined the decay region beginning at 94 m from the target. The integrated magnetic field from the sweeping magnets in the beam line delivered hyperons polarized (with about 10% polarization) in the positive or negative vertical direction. Reversing the polarity of a magnet called the spin rotator dipole regularly gave a net polarization of zero for the data discussed here. There were about and decays in the decay region. The momentum of the was peaked at 290 GeV/.
The charged particle spectrometer consisted of two pairs of drift chambers with a dipole magnet in between providing a transverse momentum kick of 150 MeV/. The electromagnetic calorimeter, having energy resolution better than 1% and position resolution of 1 mm, was made of 3100 independent cesium iodide (CsI) crystals. Two holes in the calorimeter allowed the beams to pass through and impact on a beam calorimeter located further downstream. In addition, various veto elements (Ring Vetos, Spectrometer Anti, Collar-Anti and Back-Anti) were used to detect particles escaping the fiducial volume of the detector.
The muon identification system was designed to stop charged pions while permitting muons to pass through. It was composed of a 10 cm thick lead wall followed by a series of three iron walls of 5 m total thickness. A large hole that enveloped both beams was in both the lead wall and first iron wall of 1 m thickness. Two scintillators in this hole were used to detect charged particles (e.g. the proton from ) in either beam. Charged pion showers outside the beams were vetoed at the trigger level by the Hadron-Anti hodoscope behind the lead wall. The second iron wall was 3 m thick and had no hole. Immediately behind this wall was a muon hodoscope of slightly overlapping scintillator paddles. Downstream of this was an additional meter of iron and two planes of muon hodoscopes (3 planes), one horizontal and another vertical.
In the reconstruction analysis, the final detectable state of is a proton, a muon and two photons, , considering the subsequent and decays. We do not detect the neutrino. The only difference in the normalizing mode final state is an electron instead of a muon, . Therefore, it was possible to include both muon and beta decay modes in the same trigger sample, allowing to cancel possible biases in event reconstruction, since they have similar secondary decays.
The trigger system of KTeV used three levels to select the events to keep on tape. The first and second levels used logical combinations of signals from the electronic hardware, while the third level carried out a fast online reconstruction allowing event selection based on physics criteria. The trigger required at least two neutral clusters (i.e. not associated with charged particle tracks) of energy deposited in the electromagnetic calorimeter, presumably by the two photons of the decay. It also required two charged particle tracks in the spectrometer; a positive one with high momentum that continues along the beam direction and goes into the calorimeter hole, and a negative one that hits the calorimeter. In addition, to avoid accidental activity, trigger vetoes required that at least 18 GeV of energy be deposited in the calorimeter, that no photon or charged particle escaped the fiducial volume of the detector and that there was no hadronic activity outside the beam region.
Additional selection criteria for both signal and normalizing mode were implemented offline in a non-blind analysis based on studying simulation data. The events were required to have a positive particle track with 150 to 450 GeV/ momentum and a negative particle track with 10 to 50 GeV/ momentum. The energy of each neutral cluster was required to be above 3 GeV, separated by more than 15 cm from each other and more than 10 cm from the track hit in the calorimeter. Using the energy and position of these neutral clusters and assuming they proceeded from a decay, we reconstructed the decay vertex of the along the positive particle (proton) track and reconstructed the four-momentum. The primary decay vertex was then defined as the point of closest approach of the extrapolated path and the negative particle track ( or ), also allowing us to reconstruct a visible four-momentum for the (missing the neutrino).
All vertices were required to fall within the decay region (95 to 158 m), and the primary vertex was required to lie within the neutral beam fiducial volume and be upstream of the vertex. The muon decay was distinguished from the beta decay by using the response of the calorimeter and the muon identification systems. The hit the calorimeter, depositing minimum ionizing energy (0.8 GeV), and was detected in the muon system by 3 or more hit paddles (at least one in each of , and planes). In addition the projected segment of the negative particle track had to match the hits in the muon system within 20 cm in the 2 plane and within 25 cm in the 3 planes (allowing for known effects from multiple scattering). The in the normalizing beta decay was identified by requiring that its energy deposited in the calorimeter did not differ by more than 6% from its measured momentum. Also, to reject backgrounds the momentum ratio between positive and negative particle tracks was required to be greater than 4.5. Further requirements were imposed on both reconstructed and momentum (160 to 500 GeV/) and the distance between the target and the primary vertex (12 lifetimes).
We also implemented some selection cuts considering specific background decays. Possible backgrounds for muon decay are: , , and decays plus accidental s (accidental clusters that pass photon identification cuts), with either or as subsequent decays, followed by and , followed by plus an accidental , and plus an accidental and missing . Here we are assuming the decays into or punches through the muon system faking a muon.
To reject background candidates, selection cuts were implemented on the reconstructed mass (1.110 GeV/) and mass (1.330 GeV/). The background was rejected using a cut on the reconstructed mass (0.600 GeV/). Furthermore in all background modes listed above (except the beta decay which is easy to distinguish from the signal when the is detected) the two charged particles originate from a single vertex. We found that a selection cut on the square of the total transverse momentum (0.018 (GeV/)2) of the two charged particles relative to a line from the target to this vertex could provide additional discrimination of these backgrounds from the signal mode.
The distribution of events that survived all selection cuts is shown in a plot of , the square transverse momentum relative to the beam, of the versus the invariant mass of the p system (Figure 1). The box is defined by the Monte Carlo simulation to accept 90% of the events. There are 9 signal events inside the box (dots) clustered around 1.189 GeV/ and 1 event outside.

| invariant | cut variation | MC | Data | |
| mass | (GeV/) | expected | observed | |
| events | events | |||
| looser | tighter | |||
| p | 1.120 | 1.100 | 9.8 to 6.8 | 9 to 6 |
| 1.322 | 1.338 | 9.6 to 5.4 | 9 to 5 | |
| 1.285-1.323 | 1.295-1.313 | 9.0 to 8.3 | 9 to 8 | |
| 0.540 | 0.660 | 9.0 to 8.7 | 9 |
In order to test the robustness of the selection of our signal events and the Monte Carlo simulation we varied the cuts on reconstructed masses by one sigma, observing how this affected the number of events in the signal box for both data and Monte Carlo events (Table 1). We found that in all cases the number of observed signal events followed the prediction of the Monte Carlo, also implying negligible background among the signal events. Moreover, the likelihood of the two-dimensional distribution of the 9 found events was compared to a toy Monte Carlo of 1,500 equivalent 9-event experiments. We found that 31% of the MC experiments had a lower likelihood than the data, indicating a high degree of correspondence between the distribution of these events and the expectation.

Two techniques were used to investigate the background decay modes. First, we used Monte Carlo to simulate several modes by generating at least ten times the expected number of events. Second, we employed a wrong-sign charge analysis using data to measure the level of charge symmetric decays as background, since it would be not feasible to simulate them by Monte Carlo due to the enormous number of required events. The wrong-sign analysis consisted of selecting events having a negative high-momentum particle in the beam satisfying the proton selection criteria and a positive low-momentum particle in the calorimeter satisfying the muon identification criteria. This technique took advantage of the symmetry between and in decay and of the suppression of anti-hyperon production at this energy; the production rate being an order of magnitude smaller than the rate monnier . There were no background events seen from the Monte Carlo or from the wrong-sign analysis inside the signal box after applying all selection criteria. Using Monte Carlo we estimate aproximately one background event outside the signal box from followed by and and no background events from all the other decay modes investigated. This estimate for background is shown in Figure 2, which shows 8 events surviving the selection cuts outside the signal region. This is from a sample of simulated decays that has ten times the expected number of events in the real experiment.

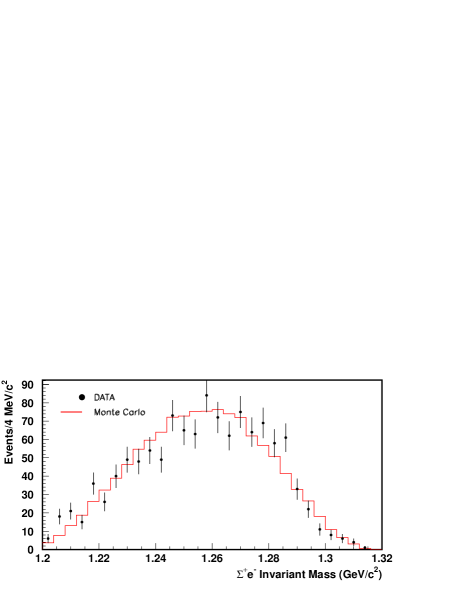
The beta decay, used for normalization, yielded 1139 events, after subtracting 54 background events within a window of 17 MeV/ around the central value of the p invariant mass distribution (Figure 3). A comparison between data and Monte Carlo of the selected events (before the background subtraction) was implemented for the invariant mass which does not reconstruct the mass since we miss the neutrino energy (Figure 4). Monte Carlo studies gave the acceptances of both signal and normalizing modes: A() = 1.36% and A() = 3.01%. The acceptances included losses due to detector geometry, trigger efficiencies, event reconstruction and particle identification.
We find the ratio of decay rates to be . The statistical uncertainties were determined at a 68% confidence level with the Feldman and Cousins method feldman . The systematic error is the quadratic sum of from the uncertainty in the number of normalizing mode decays, from the uncertainty in the ratio of acceptances and due to an 8% muon identification uncertainty. This ratio of decay rates is consistent with the calulation assuming lepton flavor symmetry.
Using the published value of the normalizing branching fraction, pdg , we find the branching fraction of the muon semi-leptonic decay to be at the 68% C.L., where the systematic error also includes the contribution due to the uncertainty of the beta decay branching fraction.
In summary, we have observed the muon semi-leptonic decay and measured its decay rate using the beta decay as normalizing mode. This observation agrees with the SU(3) flavor quark model prediction garcia and the assumption of lepton flavor symmetry.
Acknowledgements.
We gratefully acknowledge the support and effort of the Fermilab staff and the technical staffs of the participating institutions for their vital contributions. This work was supported in part by the U.S. Department of Energy, The National Science Foundation, The Ministry of Education and Science of Japan, Fundação de Amparo à Pesquisa do Estado de São Paulo (FAPESP), Conselho Nacional de Desenvolvimento Científico e Tecnológico - Brazil (CNPq) and The Ministry of Education of Brazil (CAPES). In addition, R.A.G. acknowledges the valuable discussions with P. S. Cooper.References
- (1) A. Affolder et al., Phys. Rev. Lett. 82, 3751 (1999).
- (2) N. Cabibbo, E. C. Swallow and R. Winston, Annu. Rev. Nucl. Part. Sci. 53, 39 (2003).
- (3) N. Cabibbo, Phys. Rev. Lett. 10, 531 (1963) and M. Kobayashi and T. Maskawa, Prog. Theor. Phys. 49, 652 (1973).
- (4) A. García and P. Kielanowski, The Beta Decay of Hyperons, Lecture Notes in Physics Vol. 222 (Springer-Verlag, Berlin, 1985).
- (5) A. Arisaka et al., “KTeV (Kaons at the Tevatron) Design Report”, Fermilab Report No. FN-580, 1992.
- (6) E. Monnier [KTeV Collaboration], Nucl. Phys. Proc. Suppl. 75B, 36 (1999).
- (7) G. J. Feldman and R. D. Cousins, Phys. Rev. D 57, 3873 (1998).
- (8) Review of Particle Physics, Phys. Lett. B 592, 1 (2004).