MACRO results on atmospheric neutrinos
Abstract
We discuss the final results of the MACRO experiment on atmospheric neutrino oscillations. The data concern event topologies with average neutrino energies of and GeV. Multiple Coulomb Scattering of the high energy muons was used to estimate the neutrino energy event by event. The angular distributions, the distribution, the particle ratios and the absolute fluxes all favor oscillations with maximal mixing and . Emphasis is given to measured ratios which are not affected by Monte Carlo (MC) absolute normalization; a discussion is made on MC uncertainties. A preliminary search for possible Lorentz invariance violation contributions to atmospheric neutrino oscillations is presented and discussed.
1 Introduction
MACRO was a large area multipurpose underground detector [1] designed to search for rare events and rare phenomena in the penetrating cosmic radiation [2]. It was located in Hall B of the Gran Sasso Lab at an average rock overburden of 3700 m.w.e.; it started data taking with part of the apparatus in ; it was completed in and run in its final configuration until the end of 2000. The detector had dimensions of and provided a total acceptance to an isotropic flux of particles of ; vertically it was divided into a lower part, which contained 10 horizontal layers of streamer tubes, 7 of rock absorbers and 2 layers of liquid scintillators, and an upper part which contained the electronics and was covered by 1 layer of scintillators and 4 layers of streamer tubes. The sides were covered with 1 vertical layer of scintillators and 6 of limited streamer tubes.
MACRO detected upgoing ’s via charged current interactions, ; upgoing muons were identified with the streamer tube system (for tracking) and the scintillator system (for time-of-flight). The events measured and expected for the 3 measured topologies, deviate from Monte Carlo (MC) expectations without oscillations; these deviations and the distribution point to the same oscillation scenario [2]-[7]. Here we also present the results of a preliminary search for possible Lorentz invariance violation contributions to atmospheric neutrino oscillations.
2 Atmospheric neutrinos. Monte Carlos
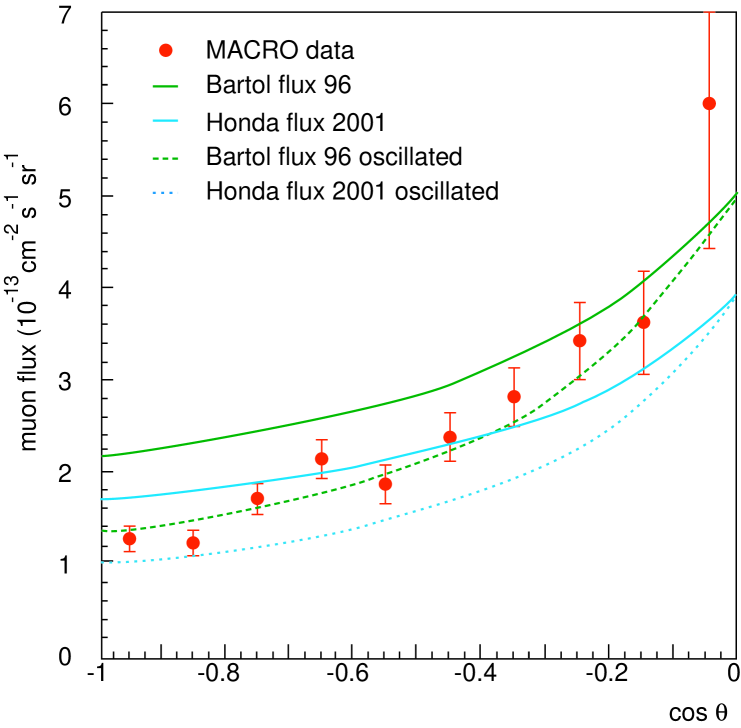
The measured upthroughgoing muon data of Fig. 1a were compared with different MC simulations. In the past we used the flux computed by the Bartol96 group [8]. The systematic uncertainty in the predicted flux was estimated at ; this is mainly a scale error that does not change the shape of the angular distribution. A similar MC (Honda95)[9] was used by the SuperK Collaboration (SK) [10]. Recently new improved MC predictions for neutrino fluxes were made available by the Honda (HKKM01) [11] and FLUKA [12] groups. They include three dimensional calculations of hadron production and decay and of neutrino interactions, improved hadronic model and new fits of the primary cosmic ray flux. The two MC yield predictions for the non oscillated and oscillated fluxes equal to within few % [7]. The shapes of the angular distributions for oscillated and non oscillated Bartol96, new FLUKA and new Honda fluxes are the same to within few %. The absolute values of our data are higher than those predicted by the new FLUKA and Honda MC, Fig. 1. A similar situation is found in the new SK data [13]. The L3C and BESS cosmic ray results presented at this workshop [14] lead to fluxes in better agreement with Bartol96 and Honda95 predictions. The evidence for neutrino oscillations is mainly due to the shape of the angular distribution and this is the same in all MCs. Also the ratios of the medium to high energy measurements and of the two low energy data samples are MC independent. Our data suggest that the FLUKA normalization should be raised by at and by at .
3 MACRO results on atmospheric ’s
The upthroughgoing muons come from interactions in the rock below the detector; muons with cross the whole detector. The corresponding ’s have a median energy of 50 GeV. Many systematic effects and backgrounds were studied [3, 7]. The data, Fig. 1a, agree in shape and absolute value with the oscillated Bartol96 MC, for = 0.0023 eV2.
versus .
The ratio Vertical/Horizontal was used to test the oscillation hypothesis versus [2] [5] [7].
The oscillations (with any mixing) are excluded at c.l. with respect to oscillations with maximal mixing [7].
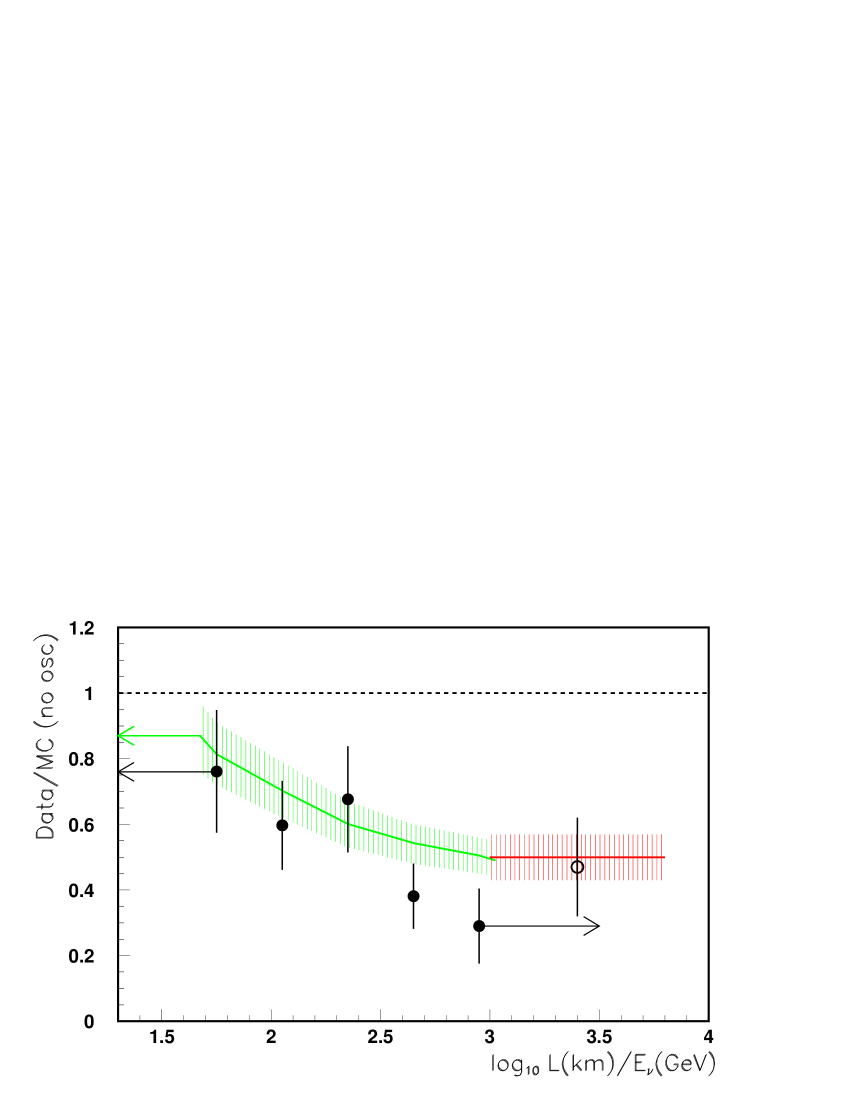
Oscillation probability as a function of the ratio . was estimated by measuring the muon energy, , by means of muon Multiple Coulomb Scattering (MCS) in the rock absorbers in the lower MACRO. The space resolution achieved was . The distribution of the ratio obtained
by this analysis is plotted in Fig. 2 versus [6].
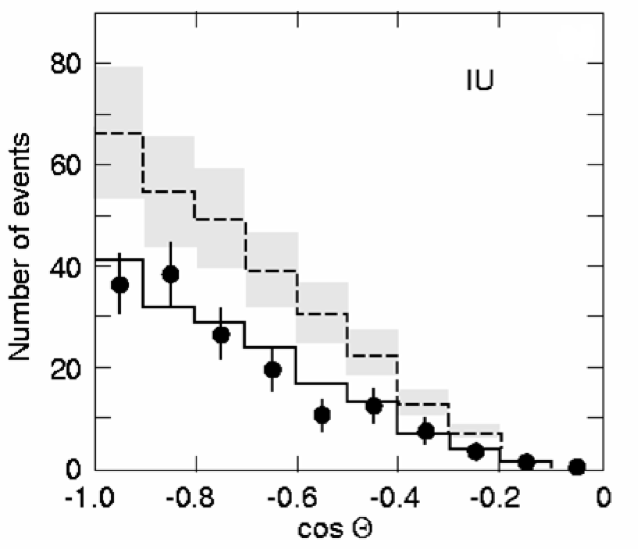
The Internal Upgoing (IU) muons come from GeV ’s interacting in the lower apparatus. Compared to the no-oscillation prediction there is a reduction in the flux, without distortion in the zenith distribution shape, Fig. 1b. The MC predictions for no oscillations in Fig. 1b is the dashed line with a systematic band.
The Upstopping (UGS) muons, due to GeV ’s interacting below the detector, yield upgoing muons stopping in the detector. The Semicontained Downgoing (ID) ’s are due to -induced downgoing ’s with vertex in the lower MACRO. The 2 types of events (not shown in Fig. 1) are identified by topological criteria.
4 Oscillation parameters.
In the past, in order to determine the oscillation parameters, we made fits to the shape of the upthroughgoing muon zenith distribution and to the absolute flux compared to the Bartol96 MC. The other data were only used to verify the consistency and make checks. The result was eV2 and maximal mixing [5] [3]. Later, also the distribution was used [6].
In order to reduce the effects of systematic uncertainties in the MC we recently used the following three independent ratios [7] and we checked that FLUKA, Honda and Bartol96 MC simulations yield the same predictions to within .
-
(i)
High Energy Data: zenith distribution ratio:
-
(ii)
High Energy Data, neutrino energy measurement ratio:
-
(iii)
Low Energy Data:
ratio .
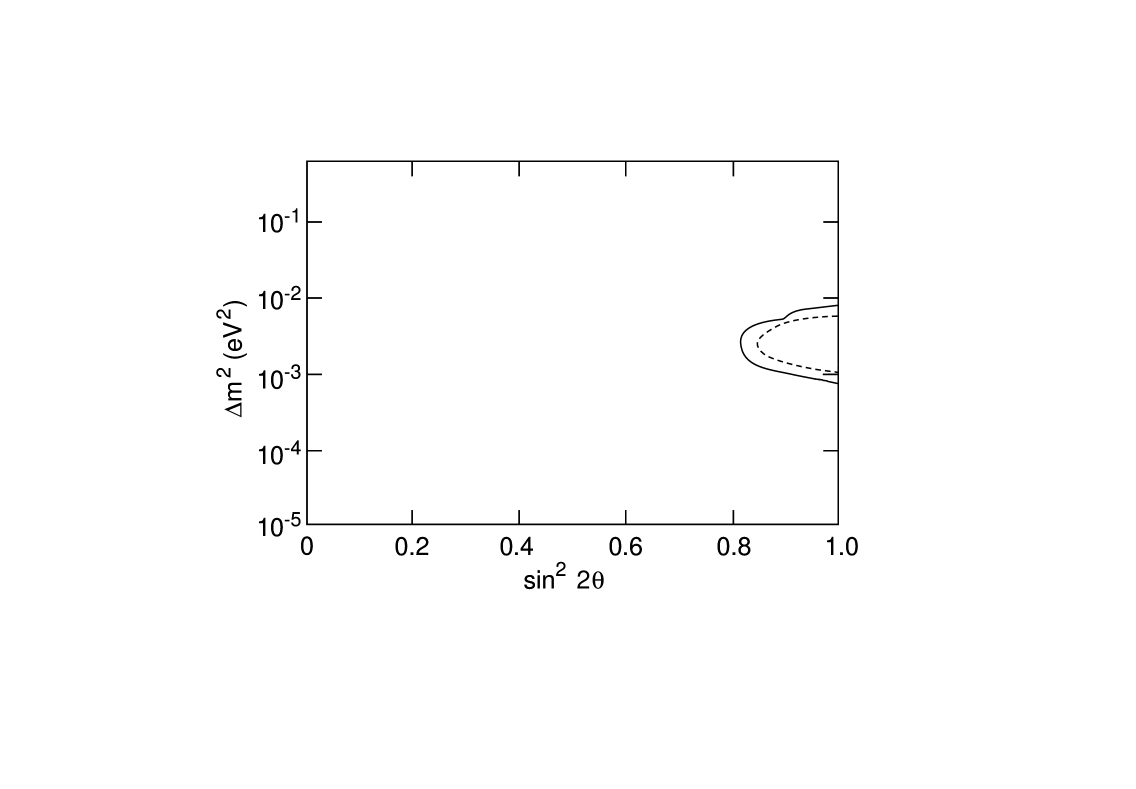
With these ratios, the no oscillation hypothesis has a probability and is ruled out by . By fitting the 3 ratios to the oscillation formulae we obtain , eV2 and the allowed region indicated by the solid line in Fig. 3.
If we use the Bartol96 flux we may add the information on the absolute fluxes of the
-
(iv)
high energy data (systematic scale error of ) .
-
(v)
low energy semicontained muons, with a systematic scale error of , .
These informations reduce the area of the allowed region (dashed line in Fig. 3), do not change the best fit values and bring the significance to .
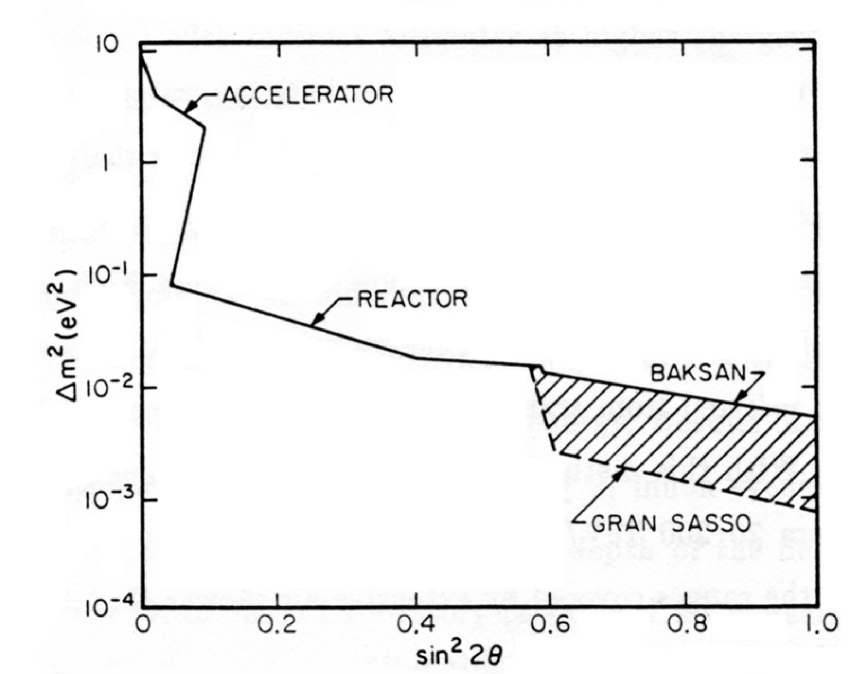
We recall that in the 1984 proposal it was stressed that the new region in that MACRO would cover is as indicated in Fig. 4, where the shape of the angular distribution of upthroughgoing ’s is very sensitive.
5 Search for possible Lorentz invariance violation contributions.
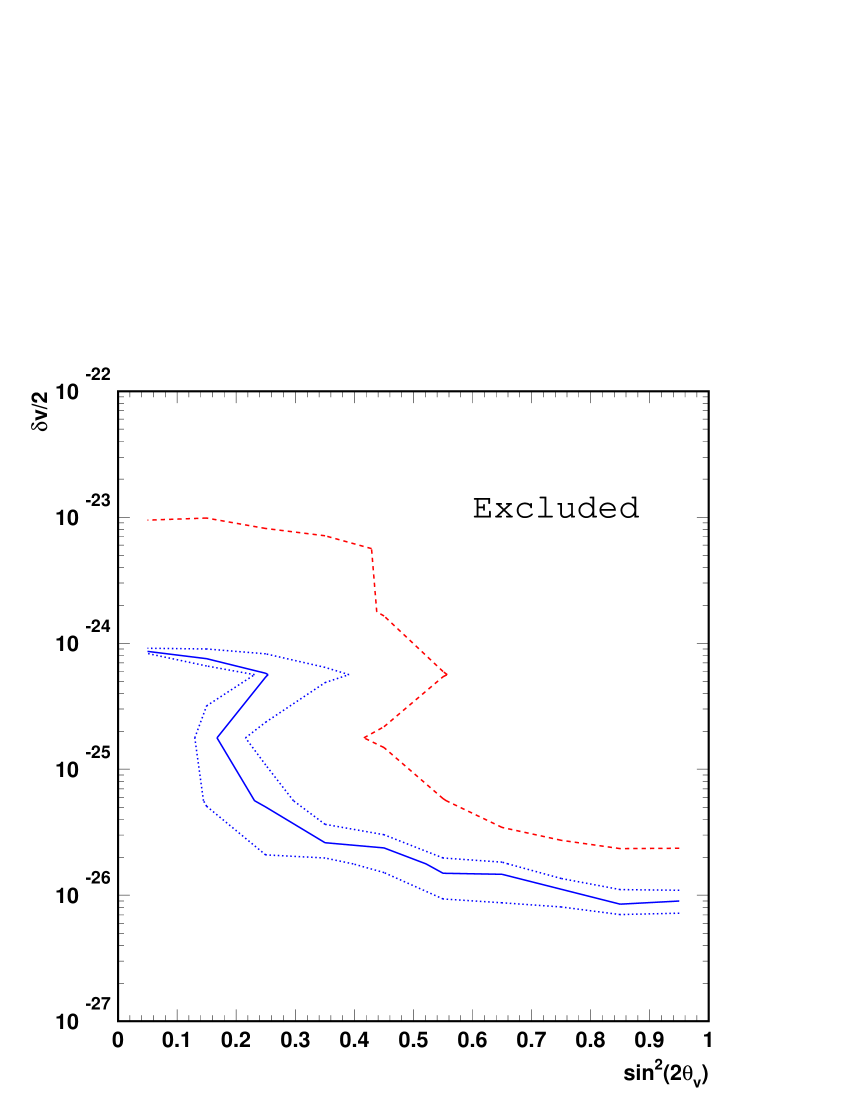
Two flavor mass-induced oscillations are strongly favored over a wide range of alternative explanations of the atmospheric data [15] [16]. In a search for possible Lorentz invariance violation (LIV) contributions, we assumed mass-induced oscillations as the leading mechanism and LIV as a sub-dominant effect [17]. In this scenario one considers 2 flavor eigenstates, 2 mass eigenstates and 2 velocity eigenstates (characterized by different maximum attainable velocities in the limit of infinite momentum). In a first analysis we considered the subsample of upthroughgoing ’s for which the energy was estimated via MCS and we used the ratio , where low and high are for events with reconstructed energies 30 and 130 GeV (average energies of 13 and 146 GeV, respectively). In the analysis we fixed the neutrino mass oscillation parameters at and and performed a minimization with respect to the LIV parameters and . The inclusion of LIV effects does not improve the of the fit and we obtain the C.L. limits shown as the continuous line in Fig. 5. The calculation was repeated for median neutrino energies of 17 and 167 GeV, dashed line in Fig. 5.
We would like to acknowledge the cooperation of the members of the MACRO collaboration and discussions with several theoretical colleagues.
References
- [1] S. Ahlen et al., Nucl. Instr. Meth. A324(1993)337. M. Ambrosio et al., Nucl. Instr. Meth. A486(2002)663.
- [2] G. Giacomelli et al., hep-ex/0211035; hep-ex/0210006; Modern Phys. Lett. A18(2003)2001; hep-ex/0407023.
- [3] M. Ambrosio et al., Astrop. Phys. 9(1998)105; hep-ex/0206027.
- [4] S. Ahlen et al., Phys. Lett. B357(1995)481. M. Ambrosio et al., Phys. Lett. B434 (1998) 451; Phys. Lett. B478(2000)5.
- [5] M. Ambrosio et al., Phys. Lett. B517(2001)59.
- [6] M. Ambrosio et al., Nucl. Instr. Meth. A492(2002)376; Phys. Lett. B566(2003)35.
- [7] M. Ambrosio et al., Eur. Phys. J. C36(2004)323.
- [8] V. Agrawal et al., Phys. Rev. D53(1996)1314.
- [9] M. Honda et al., Phys. Rev. D52 (1995) 4985.
- [10] Y. Fukuda et al., Phys. Rev. Lett. 81 (1998) 1562.
- [11] M. Honda et al., Phys. Rev. D64(2001) 053011; Phys. Rev. D70 (2004) 043008.
- [12] G. Battistoni et al., Astrop. Phys. 19(2003)269; Astrop. Phys. 19(2003)291.
- [13] Y. Ashie et al., Phys. Rev. Lett. 93 (2004) 101801.
- [14] L3C Coll., P. Le Coultre et al.; BESS Coll., T. Sanaki et al., Talks at this workshop.
- [15] S. Coleman and S. L. Glashow, Phys. Lett. B405(1997) 249; Phys. Rev. D59 (1999) 116008. S. L. Glashow, hep-ph/0407087.
- [16] G. L. Fogli et al. Phys. Rev. D60 (1999) 053006.
- [17] G. Battistoni et al., hep-ex/0503015.