Study of the Baryon-Antibaryon Low-Mass Enhancements in
Charmless Three-body
Baryonic Decays
M.-Z. Wang
K. Abe
K. Abe
H. Aihara
Y. Asano
V. Aulchenko
T. Aushev
S. Bahinipati
A. M. Bakich
I. Bedny
U. Bitenc
I. Bizjak
A. Bozek
M. Bračko
J. Brodzicka
T. E. Browder
M.-C. Chang
P. Chang
Y. Chao
A. Chen
K.-F. Chen
W. T. Chen
B. G. Cheon
R. Chistov
S.-K. Choi
A. Chuvikov
S. Cole
J. Dalseno
M. Danilov
M. Dash
A. Drutskoy
S. Eidelman
Y. Enari
F. Fang
S. Fratina
N. Gabyshev
T. Gershon
G. Gokhroo
B. Golob
A. Gorišek
J. Haba
K. Hayasaka
M. Hazumi
L. Hinz
T. Hokuue
Y. Hoshi
S. Hou
W.-S. Hou
Y. B. Hsiung
T. Iijima
A. Imoto
K. Inami
A. Ishikawa
R. Itoh
M. Iwasaki
Y. Iwasaki
J. H. Kang
J. S. Kang
N. Katayama
H. Kawai
T. Kawasaki
H. R. Khan
H. Kichimi
H. J. Kim
S. K. Kim
S. M. Kim
K. Kinoshita
S. Korpar
P. Križan
P. Krokovny
S. Kumar
C. C. Kuo
T.-L. Kuo
A. Kuzmin
Y.-J. Kwon
G. Leder
S. E. Lee
Y.-J. Lee
T. Lesiak
J. Li
S.-W. Lin
D. Liventsev
J. MacNaughton
F. Mandl
T. Matsumoto
A. Matyja
W. Mitaroff
H. Miyake
H. Miyata
R. Mizuk
G. R. Moloney
T. Nagamine
Y. Nagasaka
E. Nakano
M. Nakao
H. Nakazawa
Z. Natkaniec
S. Nishida
O. Nitoh
S. Ogawa
T. Ohshima
T. Okabe
S. L. Olsen
W. Ostrowicz
H. Ozaki
H. Palka
C. W. Park
N. Parslow
L. S. Peak
R. Pestotnik
L. E. Piilonen
N. Root
H. Sagawa
Y. Sakai
N. Sato
T. Schietinger
O. Schneider
J. Schümann
K. Senyo
M. E. Sevior
T. Shibata
H. Shibuya
B. Shwartz
V. Sidorov
J. B. Singh
A. Somov
N. Soni
R. Stamen
S. Stanič
M. Starič
K. Sumisawa
T. Sumiyoshi
O. Tajima
F. Takasaki
K. Tamai
N. Tamura
M. Tanaka
Y. Teramoto
X. C. Tian
T. Tsukamoto
S. Uehara
K. Ueno
T. Uglov
S. Uno
P. Urquijo
G. Varner
K. E. Varvell
S. Villa
C. C. Wang
C. H. Wang
M. Watanabe
Q. L. Xie
B. D. Yabsley
A. Yamaguchi
Y. Yamashita
M. Yamauchi
Heyoung Yang
J. Ying
L. M. Zhang
Z. P. Zhang
V. Zhilich
D. Žontar
Budker Institute of Nuclear Physics, Novosibirsk, Russia
Chiba University, Chiba, Japan
Chonnam National University, Kwangju, South Korea
University of Cincinnati, Cincinnati, OH, USA
Gyeongsang National University, Chinju, South Korea
University of Hawaii, Honolulu, HI, USA
High Energy Accelerator Research Organization (KEK), Tsukuba, Japan
Hiroshima Institute of Technology, Hiroshima, Japan
Institute of High Energy Physics, Chinese Academy of Sciences, Beijing, PR China
Institute of High Energy Physics, Vienna, Austria
Institute for Theoretical and Experimental Physics, Moscow, Russia
J. Stefan Institute, Ljubljana, Slovenia
Korea University, Seoul, South Korea
Kyungpook National University, Taegu, South Korea
Swiss Federal Institute of Technology of Lausanne, EPFL, Lausanne, Switzerland
University of Ljubljana, Ljubljana, Slovenia
University of Maribor, Maribor, Slovenia
University of Melbourne, Victoria, Australia
Nagoya University, Nagoya, Japan
Nara Women’s University, Nara, Japan
National Central University, Chung-li, Taiwan
National United University, Miao Li, Taiwan
Department of Physics, National Taiwan University, Taipei, Taiwan
H. Niewodniczanski Institute of Nuclear Physics, Krakow, Poland
Nihon Dental College, Niigata, Japan
Niigata University, Niigata, Japan
Osaka City University, Osaka, Japan
Osaka University, Osaka, Japan
Panjab University, Chandigarh, India
Peking University, Beijing, PR China
Princeton University, Princeton, NJ, USA
University of Science and Technology of China, Hefei, PR China
Seoul National University, Seoul, South Korea
Sungkyunkwan University, Suwon, South Korea
University of Sydney, Sydney, NSW, Australia
Tata Institute of Fundamental Research, Bombay, India
Toho University, Funabashi, Japan
Tohoku Gakuin University, Tagajo, Japan
Tohoku University, Sendai, Japan
Department of Physics, University of Tokyo, Tokyo, Japan
Tokyo Institute of Technology, Tokyo, Japan
Tokyo Metropolitan University, Tokyo, Japan
Tokyo University of Agriculture and Technology, Tokyo, Japan
University of Tsukuba, Tsukuba, Japan
Virginia Polytechnic Institute and State University, Blacksburg, VA, USA
Yonsei University, Seoul, South Korea
Abstract
The angular distributions
of the baryon-antibaryon low-mass enhancements seen in
the charmless three-body baryonic decays
,
, and are reported.
A quark fragmentation interpretation
is supported, while the gluonic resonance picture is disfavored.
Searches for the
and pentaquarks in the relevant decay modes and
possible glueball states
with 2.2 GeV/ GeV/ in the
systems
give null results. We set upper limits on the
products of branching fractions,
,
, and
at the 90% confidence level.
The analysis is based on a
140 fb-1 data sample recorded on the
resonance with the Belle detector at the KEKB asymmetric-energy
collider.
††thanks: on leave from Nova Gorica Polytechnic, Nova Gorica, Slovenia
Observations of several baryonic three-body decays have been
reported recently [1, 2, 3, 4].
One common feature of these observations is the peaking of
the baryon-antibaryon pair mass
spectra toward threshold, as originally conjectured
in Refs. [5, 6] and elaborated more recently in
Refs. [7, 8, 9]. The same peaking behavior
near threshold has been found in baryonic decays [10] as well,
indicating that this may be a universal phenomenon.
Possible explanations include intermediate
(gluonic) resonant states or non-perturbative QCD
effects of the quark fragmentation process [7, 8].
Alternatively, the dynamical picture can be replaced
by an effective range analysis with a baryon form factor [9].
To distinguish among the above hypotheses for the production
mechanism, we study the
angular distributions of the threshold enhancements
in the helicity frame for the
, and [11] modes.
We use a 140 fb-1 data sample,
consisting of 152 pairs,
collected with the Belle detector at the KEKB asymmetric energy (3.5 on 8 GeV) collider [12].
The Belle detector is a large solid angle magnetic spectrometer
that consists of a three layer silicon vertex detector (SVD), a 50
layer central drift chamber (CDC), an array of aerogel threshold
Čerenkov counters (ACC), a barrel-like arrangement of time of
flight scintillation counters (TOF), and an electromagnetic
calorimeter comprised of CsI(Tl) crystals located inside a
superconducting solenoid coil that provides a 1.5 T magnetic
field. An iron flux return located outside of the coil is
instrumented to detect mesons and to identify muons. The
detector is described in detail elsewhere [13].
The event selection criteria are based on the information obtained
from the tracking system
(SVD and CDC) and the hadron identification system (CDC, ACC, and TOF).
All primary charged tracks
are required to satisfy track quality criteria
based on the track impact parameters relative to the
interaction point (IP). The deviations from the IP position are required to be within
1 cm in the transverse (–) plane, and within 3 cm
in the direction, where the axis is opposite the
positron beam direction. For each track, the likelihood values ,
, and that it is a proton, kaon, or pion, respectively,
are determined from the information provided by
the hadron identification system. The track is identified as a proton
if and , or as a kaon if
, or as a pion if .
The proton selection efficiency is about 84% (88% for and 80% for
)
for particles with
momenta at 2 GeV/,
and the fake rate is about
10% for kaons and 3% for pions.
Candidate mesons
are reconstructed from pairs of oppositely charged tracks (both treated as
pions)
having a mass consistent with the nominal mass,
MeV/,
as well as
a displaced vertex and flight direction consistent with
an origin at the IP.
Candidate baryons are reconstructed from pairs of oppositely
charged tracks—treated as a proton and negative pion—whose mass
is consistent with the nominal baryon mass,
1.111 GeV/ GeV/. The proton-like
daughter is required to satisfy .
Candidate mesons are reconstructed in the ,
, and modes.
We use two kinematic variables in the center of mass (CM) frame to identify the
reconstructed meson candidates: the beam energy
constrained mass , and the
energy difference , where is the beam energy, and and are the momentum and
energy, respectively, of the reconstructed meson.
The candidate region is
defined as 5.20 GeV/ GeV/ and GeV
GeV. From a GEANT [14] based Monte Carlo (MC) simulation, the signal
peaks in the
subregion 5.27 GeV/ GeV/ and GeV.
The lower bound of is chosen to exclude possible contamination from
so-called “cross-feed” baryonic decays.
The background in the fit region arises solely from the continuum () process.
We suppress the jet-like continuum background events relative to the more
spherical signal events using a Fisher discriminant [15]
that combines seven event shape variables, as described in Ref. [16].
Probability density functions (PDFs) for the Fisher discriminant and
the cosine of the angle between the flight direction
and the beam direction in the rest frame
are combined to form the signal (background)
likelihood ().
The signal PDFs are determined using signal MC
simulation; the background PDFs are obtained from
the side-band data with GeV/.
We require
the likelihood ratio
to be greater than 0.7, 0.75, and 0.8 for the
, , and modes, respectively.
These selection
criteria are determined by optimization of , where
and
denote the expected numbers of signal and background events, respectively.
We use the branching fractions from our
previous measurements [2, 3] in the calculation of .
If there are multiple candidates in a single event, we
select the one with the best value from the
vertex fit.
We perform an unbinned likelihood fit that maximizes the likelihood function,
to estimate the signal yield in
5.20 GeV/ GeV/ and GeV
GeV;
here denotes the signal (background) PDF,
is the number of events in the fit, and and
are fit parameters representing the number of signal and background
events, respectively.
For the signal PDF,
we use the product of a Gaussian in and a double Gaussian in .
We fix
the parameters of these functions to values determined by MC simulation
[17].
The continuum background PDF
is taken as the product of shapes in
and , which are assumed to be uncorrelated.
We use the parameterization first used by
the ARGUS collaboration [18],
,
to model
the background, with given by and as
a fit parameter. The background shape is modeled by a linear function whose slope
is a fit parameter.
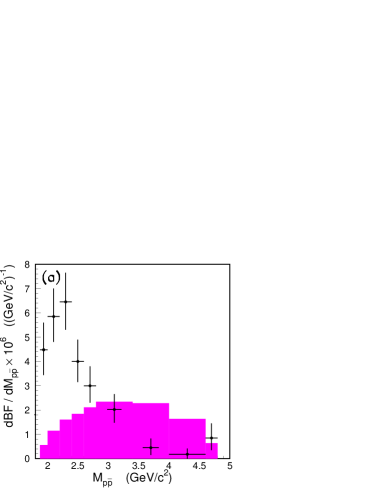
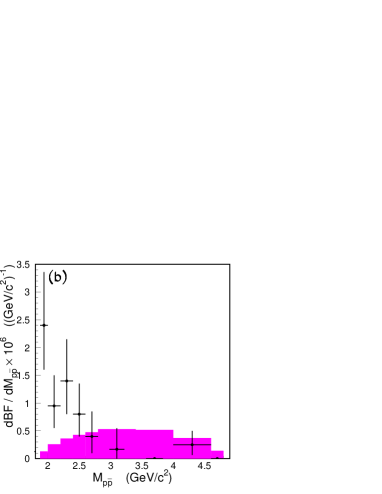
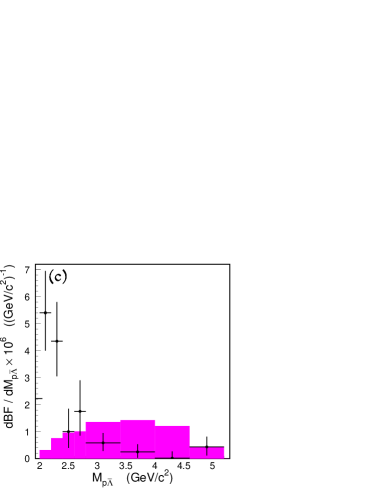
Figure 1: Differential branching fraction for (a) , (b) , and (c)
modes as a function of baryon-antibaryon pair mass. The shaded distribution
shows the expectation from a
phase-space MC simulation with area scaled to the
signal yield. A charmonium veto has been applied in (a) and (b).
The differential branching fraction as a function of the
baryon pair mass
is shown in Fig. 1.
The error bars include the statistical uncertainty from the fit
and the systematic uncertainty. Here,
the efficiency as a function of baryon pair mass for each signal mode is
determined by MC simulation.
We sum these partial branching fractions to obtain:
, ,
and which are in good agreement with
previous measurements [1, 2, 3].
These results also supersede our previous measurements with better accuracy.
Note that we have imposed a charmonium veto for the and modes:
the regions GeV/ GeV/
and GeV/ GeV/
are excluded to remove background from decay modes
containing an , ,
, , or meson.
The width of the low mass enhancement in each distribution of
Fig. 1 depends on the signal mode.
A narrow width is also observed in the newly discovered
decay [4].
Systematic uncertainties are determined using high statistics control data samples. For proton
identification, we use a sample, while for
identification we use a ,
sample.
Tracking efficiency is measured with
fully and partially reconstructed samples.
The uncertainty of reconstruction due to off-IP tracks
is determined from a
sample.
The and reconstruction efficiencies have the same
uncertainty due to off-IP tracks if the uncertainty of the daughter
proton identification criterion is not taken into account.
The continuum suppression uncertainty is estimated from
control samples with similar final states, for example,
with .
Based on these studies,
we assign a 1% error for each track, 3% for each proton identification,
2% for each kaon/pion identification, 5% for and
off-IP reconstruction
and 6% for the selection.
A systematic uncertainty of 4% in the fit yield is determined by varying
the parameters of the signal and background PDFs. The MC statistical
uncertainty contributes a 2%
error in the branching fraction determination. The error on the
number of pairs is 0.5%, where we
assume that the branching fractions of
to neutral and charged pairs are equal.
We first sum the correlated errors linearly and then combine them with the
uncorrelated ones in quadrature. The total systematic
uncertainties are 11%, 12%, and 12% for
the , , and modes,
respectively.
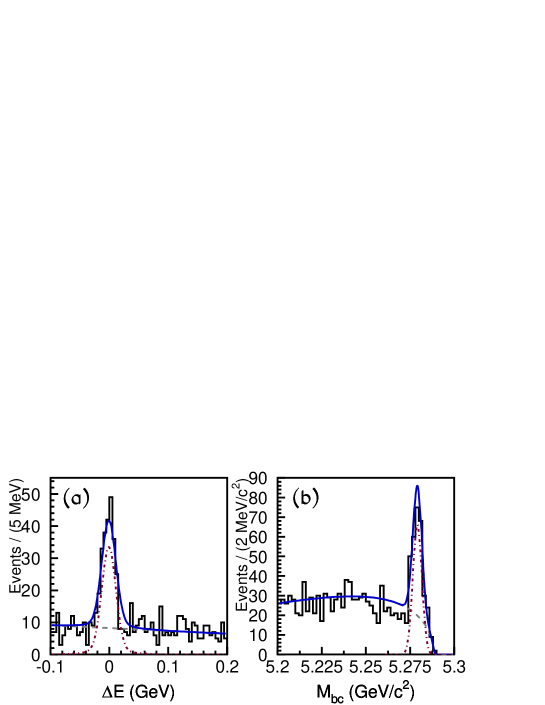
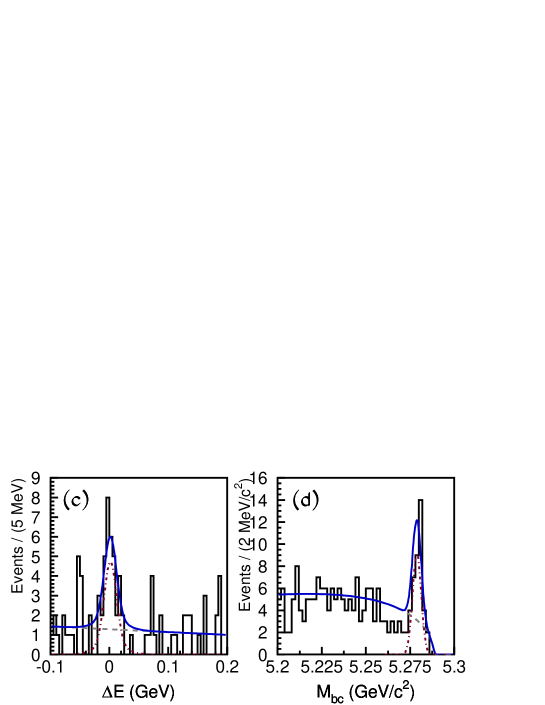
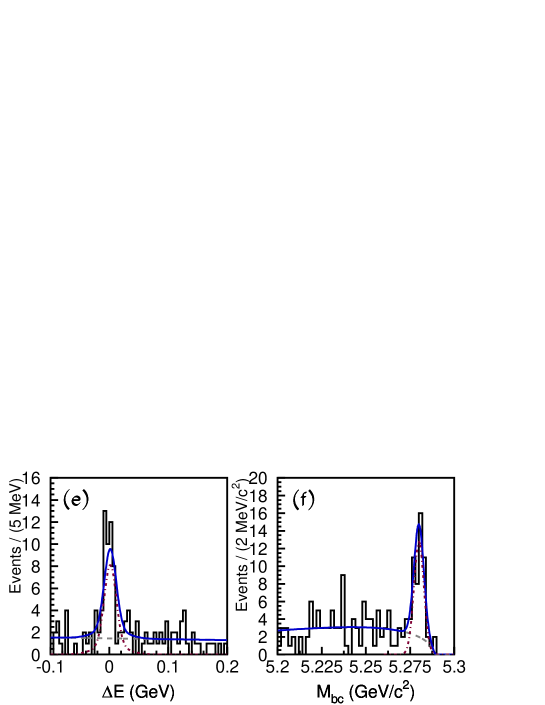
Figure 2: Distributions of and , respectively, for
(a) and (b) , (c) and (d) , and (e) and (f)
modes with baryon-antibaryon pair mass less than
2.85 GeV/.
The solid, dotted and dashed lines represent the combined fit
result, fitted signal and fitted background, respectively.
We require the mass of the baryon pair to be less than
2.85 GeV/ for the study of the threshold enhancement effect.
The distributions (with 0.05
GeV), and the distributions (with 5.27 GeV/)
for the , and modes are
shown in Fig. 2.
The projections of the fit results are shown in
Fig. 2 by solid curves.
The yields are
,
28.6 ,
and 48.8
for the , , and modes, respectively.
The measured
branching fractions by summing the partial branching fractions
in mass bins below 2.85 GeV/ are
, ,
and .
We study the proton angular distribution of the baryon-antibaryon pair system
in its helicity
frame. The angle is defined as the
angle between the proton direction and the meson direction in the
baryon-antibaryon pair rest frame.
Note that the angle is determined by and
(or and )
in the mode for definiteness.
Fig. 3(a)-(c) shows the
branching fractions as a function of .
We define the angular asymmetry as , where and
stand for the efficiency corrected yield with and
, respectively. The angular asymmetry is determined to be
for the mode.
The asymmetry of the distribution indicates that the fragmentation
picture is favored.
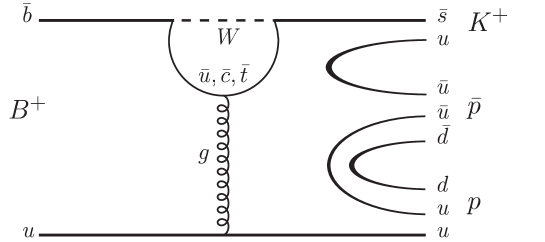
Antiprotons are emitted along
the direction most of the time, which can be explained by
a parent penguin transition followed by
fragmentation into the final state as shown in Fig. 4.
The energetic quark picks up the quark from a
pair in vacuum and the remaining quark then
drags a diquark out of vacuum.
This simple picture can describe the
angular correlation. The spectator quark and leftover
diquark form an proton.
The distribution of the mode
can not support nor refute this fragmentation interpretation because
of low statistics and no flavor information.
The distribution for the mode
is quite flat (i.e. in favor of the gluonic picture),
in contrast to that of the
mode, although both presumably share a common origin in the
transition.
In fact, this parentage suggests that it would be useful to examine
the proton angular distribution
relative to the direction in
the rest frame.
We remove the GeV/ constraint
in order to check the full angular region;
the result is shown in Fig. 3(d). It is evident
that the fragmentation interpretation is supported:
the proton tends to emerge parallel to the baryon.
As a cross check, the distribution of
for background events in the sample
is shown in Fig. 3(e). Similar distributions are obtained
for the backgrounds of the and modes. The background has
a distribution, which can be explained as
arising from the random combination of two high momentum particles from the
jets. The continuum MC simulation also confirms this feature.
Figure 3: Branching fraction vs.
in the baryon-antibaryon pair system for
(a) , (b) , and (c) modes. (d) The proton angular
distribution of the system against the direction in the mode.
(e) background yield vs. .
Figure 4:
Simple quark diagram for an illustration of the decay.
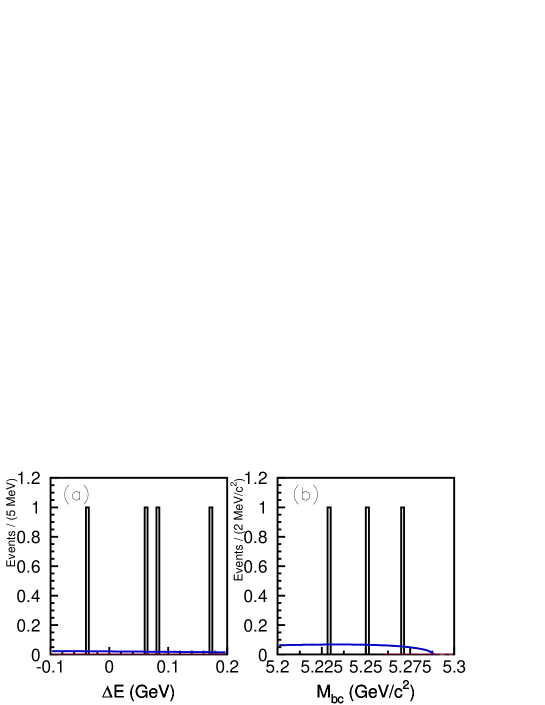
The newly observed narrow pentaquark state, [19], can
decay into . We perform a search in
by requiring GeV/ GeV/.
The and projection plots in Fig. 5 show
no evidence for a pentaquark signal. Since there are few events in the fit
window, we fix the
background shapes from sideband data.
We use the fit results to estimate the expected background ()
and compare this with the observed one event
in the signal region
to set an upper limit on the signal
yield of 3.9 events at the 90% confidence level [20, 21]. The
systematic uncertainty is included in this limit.
The related upper limit on the product of branching fractions is
.
We also perform a search for ,
which can decay to in the mode [22].
Because there are only theoretical conjectures for the existence of
such a state, we examine the wider mass region of
GeV/ GeV/. We
find no evidence for signal. Assuming this state is narrow and
centered near 1.71 GeV/, the
upper limit on the yield is 3.3 events at the 90% confidence level. The
corresponding upper limit product of branching fractions is
at the 90% confidence level.
Figure 5: Distributions of and for the mode
with GeV/ GeV/ in the region where the
pentaquark is expected.
The curves represent the fit
projections.
One theoretical
conjecture [7] suggests that a possible
glueball resonance (e.g., [23])
with mass
near 2.3
GeV/ may contribute to the threshold
peaking behavior for the mode.
Since the mass
resolution is about 10 MeV/, we scan through the
GeV/ GeV/ mass region
with a 20 MeV/ wide window. The largest upper
limit on the yield is found to be 18.9 at 2.21 GeV/.
We use this data set to set an upper limit on the product of branching
fractions of
at the 90%
confidence level for a narrow glueball state with mass
in the 2.2 – 2.4 GeV/ range. The theoretical expectation is
around .
In summary, using 152 events, we measure the
mass and the angular distributions of the baryon-antibaryon pair
system near threshold for the , and
baryonic decay modes. A quark fragmentation
interpretation is supported, while a gluonic resonant state
picture is disfavored.
Searches for a meson decaying into the pentaquark or a
glueball in the above related modes give null results.
We thank the KEKB group for the excellent operation of the
accelerator, the KEK cryogenics group for the efficient
operation of the solenoid, and the KEK computer group and
the National Institute of Informatics for valuable computing
and Super-SINET network support. We acknowledge support from
the Ministry of Education, Culture, Sports, Science, and
Technology of Japan and the Japan Society for the Promotion
of Science; the Australian Research Council and the
Australian Department of Education, Science and Training;
the National Science Foundation of China under contract
No. 10175071; the Department of Science and Technology of
India; the BK21 program of the Ministry of Education of
Korea and the CHEP SRC program of the Korea Science and
Engineering Foundation; the Polish State Committee for
Scientific Research under contract No. 2P03B 01324; the
Ministry of Science and Technology of the Russian
Federation; the Ministry of Higher Education, Science and
Technology of the Republic of Slovenia;
the Swiss National Science Foundation; the National Science
Council and the Ministry of Education of Taiwan; and
the U.S. Department of Energy.
References
[1]
K. Abe et al. (Belle Collaboration),
Phys. Rev. Lett. 88, 181803 (2002).
[2]
M.Z. Wang et al. (Belle Collaboration),
Phys. Rev. Lett. 90, 201802 (2003).
[3]
M.Z. Wang et al. (Belle Collaboration),
Phys. Rev. Lett. 92, 131801 (2004).
[4]
Y.J. Lee et al. (Belle Collaboration),
Phys. Rev. Lett. 93, 211801 (2004).
[5] W.S. Hou and A. Soni,
Phys. Rev. Lett. 86, 4247 (2001).
[6] C.K. Chua, W.S. Hou and S.Y. Tsai,
Phys. Lett. B 528, 233 (2002).
[7]
C.K. Chua, W.S. Hou and S.Y. Tsai,
Phys. Lett. B 544, 139 (2002).
[8] J.L. Rosner, Phys. Rev. D 68, 014004 (2003).
[9] B. Kerbikov, A. Stavinsky, and V. Fedotov,
Phys. Rev. C 69, 055205 (2004).
[10] J.Z. Bai et al. (BES Collaboration),
Phys. Rev. Lett. 91, 022001 (2003);
M. Ablikim et al. (BES Collaboration),
Phys. Rev. Lett. 93, 112002 (2004).
[11] Throughout this report,
inclusion of charge conjugate mode is always implied unless
otherwise stated.
[12]
S. Kurokawa and E. Kikutani,
Nucl. Instr. and Meth. A 499, 1 (2003).
[13]
A. Abashian et al. (Belle Collaboration),
Nucl. Instr. and Meth. A 479, 117 (2002).
[14]
R. Brun et al., GEANT 3.21, CERN Report No. DD/EE/84-1, 1987.
[15]
R.A. Fisher, Annals of Eugenics 7, 179 (1936).
[16]
K. Abe et al. (Belle Collaboration),
Phys. Lett. B 517, 309 (2001).
[17] There are small corrections applied to these
parameters based on the
study of the difference between data and MC in decays.
[18]
H. Albrecht et al. (ARGUS Collaboration),
Phys. Lett. B 241, 278 (1990);
ibid. B 254, 288 (1991).
[19]
See, e.g., T. Nakano et al. (LEPS Collaboration),
Phys. Rev. Lett. 91, 012002 (2003).
[20] G.J. Feldman and R.D. Cousins, Phys. Rev. D 57,
3873 (1998).
[21] J. Conrad et al.,
Phys. Rev. D 67, 012002 (2003).
[22]
T.E. Browder, I. Klebanov and D. Marlow, Phys. Lett. B 587, 62 (2004).
[23]
S. Eidelman et al. (Particle Data Group), Phys. Lett. B 592, 594 (2004).