HyperCP Collaboration
Search for S = 2 Nonleptonic Hyperon Decays
Abstract
A sensitive search for the rare decays and has been performed using data from the 1997 run of the HyperCP (Fermilab E871) experiment. Limits on other such processes do not exclude the possibility of observable rates for nonleptonic hyperon decays, provided the decays occur through parity-odd operators. We obtain the branching-fraction limits and , both at 90% confidence level.
pacs:
13.30.Eg, 14.20.Jn, 12.15.JiThe standard model allows transitions through second-order weak interactions. This approach successfully describes mixing, which is currently the only observed transition. While other processes have generally been considered too highly suppressed to be observed experimentally, it has been noted that the rate of mixing does not exclude nonleptonic hyperon decays at observable rates, provided that they proceed through new parity-odd channels Glashow ; valencia . Measurements can thus be used to set limits on parity-odd contributions to hyperon decays. It is of interest, therefore, to perform sensitive searches for such decays. There is also interest in searches for direct transitions in -meson decays Singer .
Observation of nonleptonic hyperon decays at current levels of sensitivity would strongly suggest new physics. He and Valencia valencia have parametrized the strength of any new parity-odd interaction as a ratio to the strength of the electroweak interaction. This ratio is constrained by hyperon branching ratios valencia , e.g. ,
| (1) |
where () is the strength of the new (electroweak) interaction. Current experimental limits on decays PDG include ) Bourquin and () Geweniger , both at 90% confidence level (C.L.). We report a search for these decays using data from the 1997 run of HyperCP (Fermilab Experiment 871). These data are well suited for such studies as they contain large numbers of charged hyperon decays, and decays.
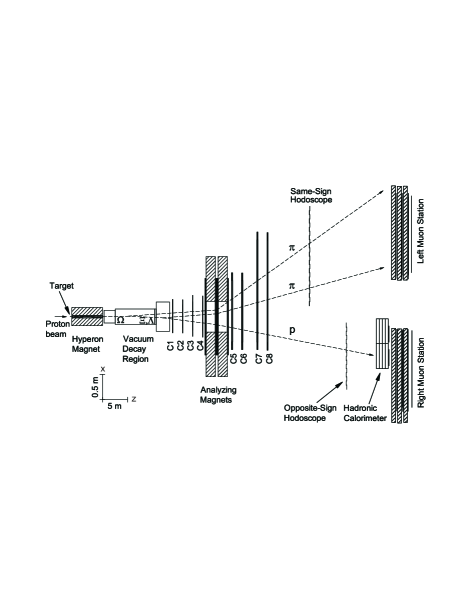
The HyperCP spectrometer is shown schematically in Fig. 1. The spectrometer (described in detail elsewhere spectrometer ) was designed to have large acceptance for the decay chain . In brief, a negatively charged secondary beam was formed by the interaction of GeV/c primary protons from the Tevatron in a copper target, with the secondaries sign- and momentum-selected by means of a 6.096-m-long curved collimator within a 1.667 T dipole magnetic field (Hyperon Magnet). The mean secondary momentum was about 160 GeV/ with momenta ranging from 120 to 250 GeV/. Hyperon decays occurring within a 13-m-long evacuated decay pipe were reconstructed in three dimensions using a series of high-rate, narrow-gap multiwire proportional chambers arrayed on either side of a pair of dipole magnets (Analyzing Magnets).
The trigger for the data acquisition system DAQ used scintillation-counter hodoscopes located sufficiently far downstream of the Analyzing Magnets so that the hyperon decay products were well separated from the secondary beam. A coincidence was required of at least one (“same-sign”) hodoscope hit consistent with a charged particle of the same sign as the secondary beam and at least one “opposite-sign” hit. To suppress muon and low-energy backgrounds the trigger also required a minimum energy deposit in the Hadronic Calorimeter.
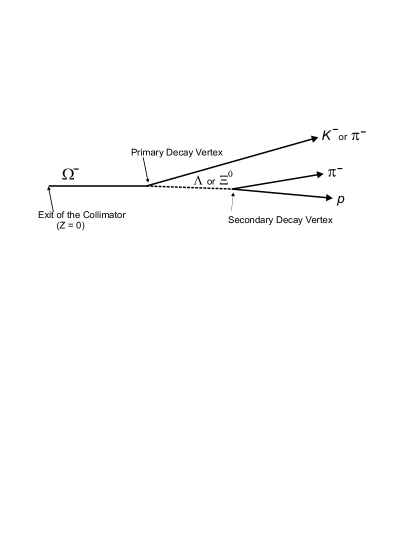
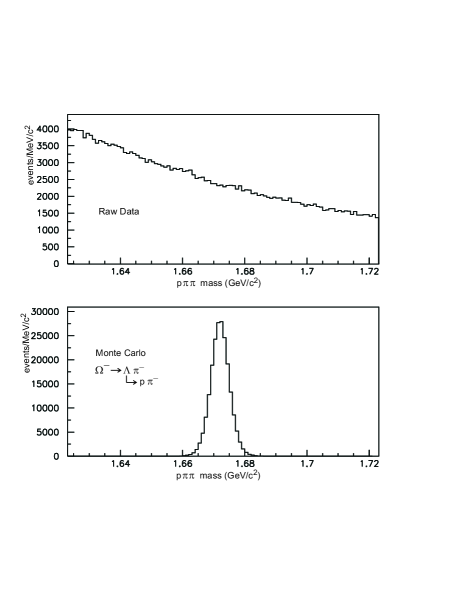
We searched for events consistent with either decay chain, , or , . Also studied were the copious events from the , decay sequence used for normalization. Such events all have the topology shown in Fig. 2, with three charged tracks forming two separated vertices. A least-squares geometric fit determined the positions of the primary and secondary vertices, as well as the chi-square () value for the event to have the required topology. The reconstructed trajectory was traced back through the Hyperon Magnet using the measured magnetic field to determine its and coordinates at the midpoint of the target. Figure 3 compares the invariant-mass distribution of all events before event selection with that of Monte Carlo-generated , events.
Selection criteria for signal events were based on Monte Carlo simulations and studies of a purified sample of , events. Events were required to have three charged tracks with two tracks on the “same-sign” side of the spectrometer and one on the “opposite-sign” side. Most events were excluded by requiring the invariant mass (treating all three charged tracks as pions) to exceed 0.500 GeV/, 3 standard deviations () above the mass PDG . Since many background events originated from secondary interactions near the exit of the collimator or at the exit windows of the Vacuum Decay Region, all events were required to have a primary-vertex position between 150 and 1180 cm from the exit of the collimator, well within the Vacuum Decay Region. The secondary vertex was required to be downstream of the primary vertex. The degree-of-freedom from the geometric fit was required to be less than 1.7; this requirement was 98% efficient for , events. Selection criteria for the projected position at the target were determined using the purified , sample. Due to differing resolutions in and at the target, an elliptical target cut was used which was 92% efficient for , .
Additional selection criteria were specific to each mode. For the , search we required the invariant mass of the combination forming the secondary vertex to be within 2.0 MeV/ ( times the rms mass resolution) of the mass PDG . Decay polar angles in the respective hyperon rest frames were calculated with respect to the parent’s lab-frame momentum vector. Background events tended to have a small decay polar angle for the pion in the center-of-mass system ( rad), thus we required rad. The invariant-mass distribution, assuming a final state, after all selection cuts is shown in Fig. 4a. No events were observed within of the expected mass.
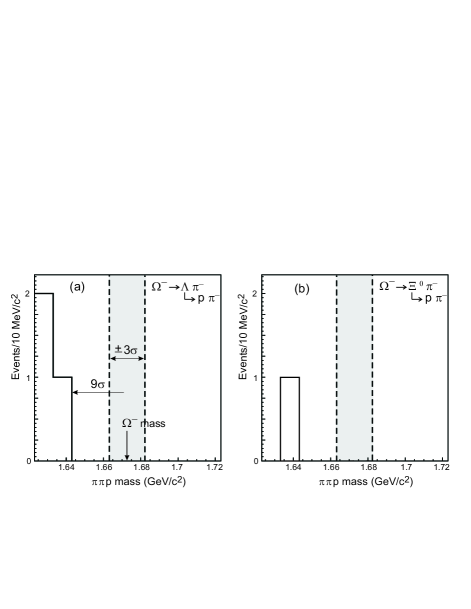
For the , search, we required that the proton momentum be more than 38% of the total momentum, that the invariant mass of the combination forming the secondary vertex be within MeV/ () of the mass PDG , that the position of the daughter-hyperon decay vertex be within the Vacuum Decay Region, and that the polar angle of the proton in the center-of-mass frame be less than rad. The invariant-mass distribution for events satisfying all selection criteria is shown in Fig. 4b. Again, no events were observed within of the expected mass.
The spectrometer acceptances for these decays were estimated using a Monte Carlo simulation. The generated momentum and position distributions at the target were tuned to match those observed in the data for a purified sample of , decays. For all decay modes, the acceptance includes the probability that the parent decay occur within the Vacuum Decay Region. The geometric acceptance of the spectrometer was determined primarily by the apertures of the Analyzing Magnets. Due to the larger values for and compared to those of and , tracks from signal-mode decays would be approximately three times more likely to miss the magnet apertures and be lost. For events accepted in the magnet apertures, the trigger efficiency ranged from 93% for candidates to 99% for events. The candidate signal- and normalizing-mode events were all accepted by the same trigger, so it was not necessary to cross-calibrate trigger efficiencies by mode. Offline event-selection efficiencies differed considerably by mode, since restrictive selection criteria to suppress background were required for the signal modes but not for the normalizing mode. To study the systematic uncertainties of the selection efficiencies, the selection criteria were varied. This produced only slight changes in the results.
The decay parameter for has recently been precisely measured and found to be small, but most likely not zero Lanchun , while the measured value for is less precise and is consistent with zero PDG . Theory predicts little parity violation in the dominant decays theory (as observed); however, we cannot exclude large decay asymmetries for . Similarly, we do not know the size of parity violation in . We therefore assign zero to the value of for and . The dependence of the acceptance on is tabulated in Table 1. The acceptance times the selection efficiency (including the maximal acceptance variation due to uncertainty in ) was % for , % for , , and ()% for .
| Rel. Acc. | Rel. Acc. | ||||||||
| 1. | 0.642 | 1.17 | 0. | 05 | 1. | 0 | 1.05 | ||
| 0. | 75 | 0.642 | 1.13 | 0. | 05 | 0. | 0 | 1.05 | |
| 0. | 50 | 0.642 | 1.09 | 0. | 05 | 1. | 0 | 1.04 | |
| 0. | 25 | 0.642 | 1.05 | 0. | 09 | 1. | 0 | 0.98 | |
| 0. | 00 | 0.642 | 1.00 | 0. | 09 | 0. | 0 | 1.00 | |
| 0. | 25 | 0.642 | 0.94 | 0. | 09 | 1. | 0 | 1.02 | |
| 0. | 50 | 0.642 | 0.87 | 0. | 23 | 1. | 0 | 0.92 | |
| 0. | 75 | 0.642 | 0.79 | 0. | 23 | 0. | 0 | 0.95 | |
| 1. | 00 | 0.642 | 0.70 | 0. | 23 | 1. | 0 | 0.98 | |
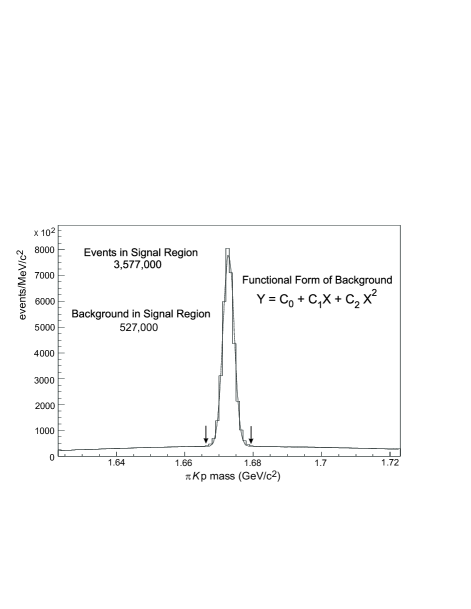
Signal-mode branching ratios were normalized using the observed , sample, whose invariant-mass distribution is shown in Fig. 5. The figure includes a fit of the mass distribution to a Gaussian plus a second-order polynomial. The number of normalizing-mode decays was estimated using three different background-subtraction methods. In all three, an estimate of the background was subtracted from the total number of events observed within of the mass. The first background estimate was the sum of all events within of the mass minus the integral of the fitted second-order polynomial over that region. In the second method, a fit was performed over a limited region () around the mass to a Gaussian plus a constant. The third method averaged the two bins at and multiplied this by the number of bins within the window. All methods gave similar results. The final estimate of the number of observed normalizing events was taken as the average of the three estimates, , with the uncertainty defined as half the difference between the largest and smallest estimates (corresponding to about , assuming Gaussian statistics). After correcting for acceptance and selection efficiencies, and accounting for the measured branching fractions, the total number of baryons exiting the collimator was .
Signal-mode branching fractions were obtained from
| (2) | |||||
| (3) | |||||
Here denotes the number of events observed and the acceptance for a given mode, with subscripts designating the signal mode in question and the normalizing mode . The number of signal events observed is zero in each case. The measured branching ratios entering into Eqs. (2) and (3) are %, %, and % PDG . Systematic uncertainties include the uncertainties of these branching ratios, that of the normalizing-mode background subtraction, and, most importantly, those associated with acceptances and event selection.
To derive 90%-C.L. upper limits for the numbers of events observed (), we included systematic uncertainties Poisson as follows:
| (4) |
Here represents the statistical limit based on the Poisson distribution with no systematic uncertainties, is the number of observed events, and is the relative systematic uncertainty. In our case (), Eq. (4) reduces to
| (5) |
The relative uncertainty (including uncertainties in the acceptance, selection, normalization, and branching ratios) was 16% for and 32% for . Upper limits on the numbers of observed events at the 90% C.L. thus determined are 2.4 events for and 2.6 for , comparable to the 2.3 events obtained from a frequentist statistical treatment of the Poisson fluctuation alone PDG . We thus obtain and , both at 90% C.L. These results represent improvements by one to two orders of magnitude over previous measurements.
Acknowledgements.
We thank the staffs of Fermi National Accelerator Laboratory and each collaborating institution for support necessary to complete these studies. This work was supported by the US Department of Energy, the National Science Council of Taiwan, ROC, and the Swiss National Science Foundation. E.C.D. and K.S.N. were partially supported by the Institute for Nuclear and Particle Physics. K.B.L. was partially supported by the Miller Institute for Basic Research in Science. D.M.K. acknowledges support from the Particle Physics and Astronomy Research Council of the United Kingdom and the hospitality of Imperial College London while this paper was in preparation.References
- (1) S. Glashow, Phys. Rev. Lett. 6, 196 (1961).
- (2) X. G. He and G. Valencia, Phys. Lett. B 409, 469 (1997); Erratum-ibid. 418, 443 (1998).
- (3) S. Fajfer and P. Singer, Phys. Rev. D 62, 117702 (2000); S. Fajfer and P. Singer, Phys. Rev. D 65, 017301 (2002).
- (4) Particle Data Group: S. Eidelman et al., Phys. Lett. B 592, 1 (2004).
- (5) M. Bourquin et al., Nucl. Phys. B 241, 1 (1984).
- (6) C. Geweniger et al., Phys. Lett. 57B, 193 (1975).
- (7) R. A. Burnstein et al., hep-ex/0405034 (2004).
- (8) Y. C. Chen et al., Nucl. Instrum. Methods A 455, 424 (2000).
- (9) Y. C. Chen et al., Phys. Rev. D 71, 051102(R) (2005).
- (10) M. Suzuki, Prog. Theor. Phys. 32, 138 (1964); Y. Hara, Phys. Rev. 150, 1175 (1966); J. Finjord, Phys. Lett. B 76, 116 (1978).
- (11) R. D. Cousins and V. L. Highland, Nucl. Instrum. Methods A 320, 331 (1992).