Simulations of neutron background in a time projection chamber relevant to dark matter searches
M. J. Carson, J. C. Davies111Corresponding author,
e-mail: j.c.davies@sheffield.ac.uk, E. Daw, R. J. Hollingworth,
J. A. Kirkpatrick, V. A. Kudryavtsev, T. B. Lawson, P. K. Lightfoot,
J. E. McMillan, B. Morgan, S. M. Paling, M. Robinson,
N. J. C. Spooner, D. R. Tovey, E. Tziaferi
Department of Physics and Astronomy, University of Sheffield, Sheffield S3 7RH, UK
Abstract
Presented here are results of simulations of neutron background performed for a time projection chamber acting as a particle dark matter detector in an underground laboratory. The investigated background includes neutrons from rock and detector components, generated via spontaneous fission and (,n) reactions, as well as those due to cosmic-ray muons. Neutrons were propagated to the sensitive volume of the detector and the nuclear recoil spectra were calculated. Methods of neutron background suppression were also examined and limitations to the sensitivity of a gaseous dark matter detector are discussed. Results indicate that neutrons should not limit sensitivity to WIMP-nucleon interactions down to a level of pb in a 10 kg detector.
Keywords: Dark matter, WIMPs, Neutron background, Neutron flux, Spontaneous fission, (,n) reactions, Radioactivity, Cosmic-ray muons underground
PACS: 14.20.Dh, 14.80.Ly, 13.60.Rj, 13.75.-n, 13.85.-t, 28.20, 25.40, 98.70.Vc
Corresponding author: J. C. Davies, Department of Physics and Astronomy, University of Sheffield, Hicks Building, Hounsfield Road, Sheffield S3 7RH, UK
Tel: +44 (0)114 2223547; Fax: +44 (0)114 2728079;
E-mail: j.c.davies@sheffield.ac.uk
1. Introduction
It is important to the sensitivity of future underground dark matter detectors to have accurate simulations of background events and to find ways to suppress or reject them. Presented here are simulations of a gas Time Projection Chamber (TPC) as a WIMP (Weakly Interacting Massive Particle) dark matter detector and the neutron background that may be expected from the detector itself and the surrounding environment. A time projection chamber is well suited for dark matter detection because it enables directional track information to be recorded, and so can be used to distinguish between postulated halo models [1]. Low pressure is necessary for a gas detector to maximise its spatial resolution. An example of this type of detector is DRIFT I [2].
Neutron background is an important issue, since neutrons can produce nuclear recoils in the same way as WIMPs. Other backgrounds that have the capability to generate false signals include sources of alphas and gammas. Simulations of these backgrounds, however, have been neglected in this study as any signals generated by alpha particles in the detector can be actively vetoed because they will be produced at the edge of the detector and have long tracks, and those due to gammas can be rejected by adjusting the energy threshold and applying appropriate cuts [2, 3, 4].
The simulations described use either the GEANT4 toolkit [5] or FLUKA [6] (versions FLUKA-2002 and FLUKA-2003) to simulate geometry, particle production, tracking and detection, with the neutron production energy spectra from spontaneous fission and (, n) reactions being calculated using SOURCES [7]. The background investigated is that of neutrons produced via spontaneous fission and (, n) reactions in and around the detector, along with muon-induced neutrons from deeply penetrating cosmic rays. The neutrons are then allowed to undergo elastic and inelastic scattering which, if within the fiducial volume of the detector, can produce nuclear recoils that are indistinguishable from the WIMP-induced nuclear recoils being searched for. These simulations, therefore, attempt to determine the rate of nuclear recoils that will be observed by the detector due to the neutron background, to estimate the amount of passive neutron shielding required to keep this rate sufficiently suppressed and to formulate requirements for the purity of materials used in the detector construction in order to gain a high sensitivity to WIMPs.
Other background simulations for underground dark matter detectors have been performed or are underway, including, for example, those for a large-scale xenon detector [8], CRESST-II at the Gran Sasso Laboratory [9], the EDELWEISS-II experiment in the Modane Underground Laboratory [10], the IGEX germanium dark matter experiment at Canfranc [11] and the CsI detectors at the CPL underground site in South Korea [12].
In contrast to the aforementioned studies, however, the simulations described here are for a low-pressure gas TPC detector. The probability for a neutron or gamma interaction in such a detector is very low and the light charged particles (i.e. electrons and muons) are hardly visible. No multiple recoil events from neutrons are expected in gas, and muons and muon-induced secondary particles may not be seen, unlike the case for other experiments. This makes the simulations for low-pressure gas detectors unique. The results of other simulations cannot be extrapolated to such TPCs. Some studies of neutron background in a gas TPC using different simulation strategy and code have recently been completed by Smith et al. [13].
2. Geometry
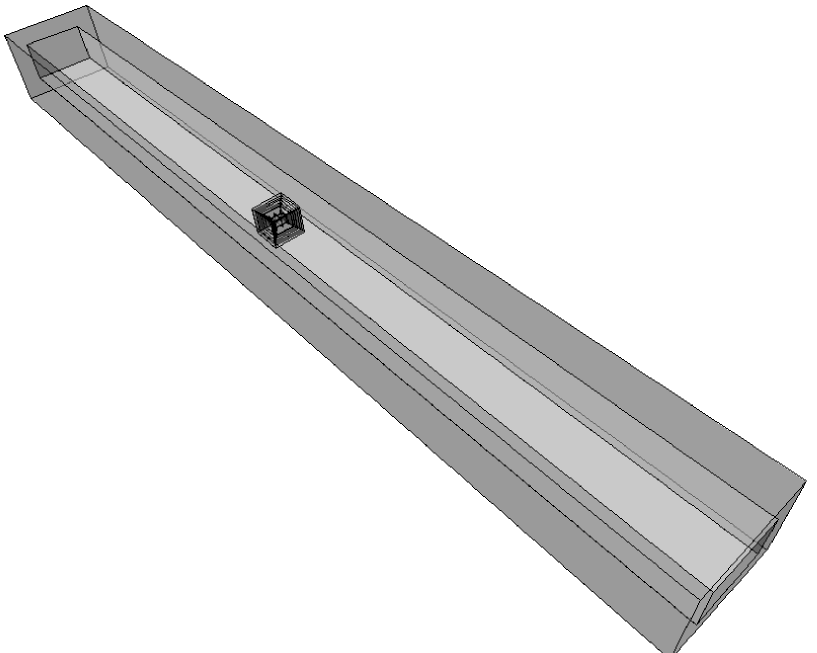
For the GEANT4 [5] simulations a laboratory area m long, similar in size to the Boulby Underground Laboratory (North Yorkshire, UK; Boulby mine is run by Cleveland Potash Ltd.), filled with air approximated at atmosphere of an nitrogen to oxygen mixture, was used (see Figure 1 for illustration). Surrounding the laboratory is rock salt (pure NaCl in these simulations) m thick on sides. The ‘tunnel ends’ were left open however, since the rock far from the detector, including the end walls, contributes very little to the neutron flux at the detector. Further reduction of the length of the simulated laboratory in the simulations to m results in a less than decrease in the number of neutrons observed in the detector placed in the middle of the cavern. Thus, to save CPU time, the cavern length was limited to m.
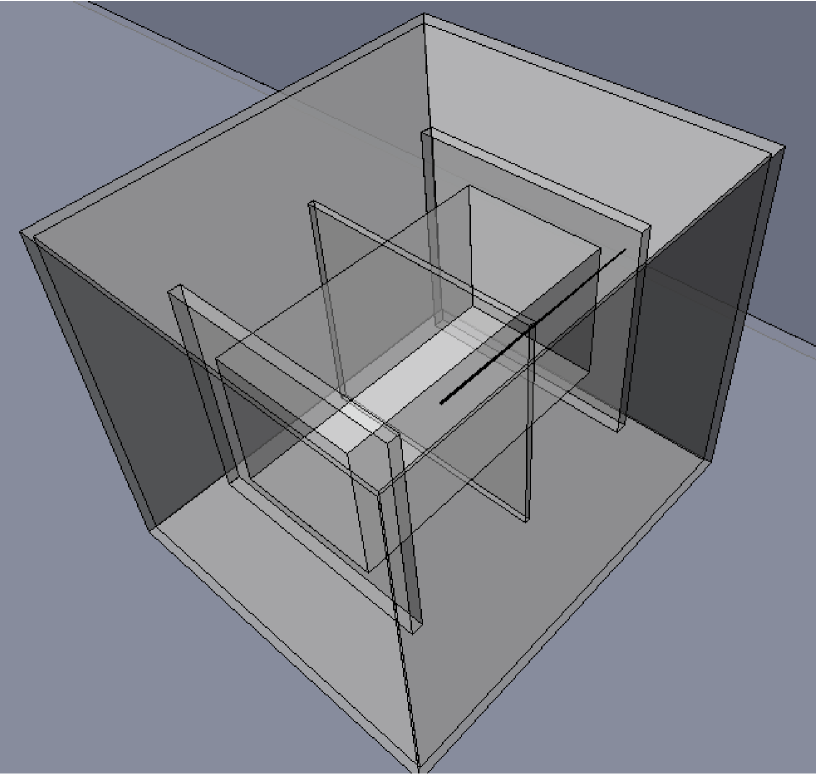
The detector itself consists of a cm thick stainless steel vessel with internal dimensions of m3 and a mass of kg (Figure 2). The cm thickness was used as an average, although a real detector of this type, such as the DRIFT I detector [2], has thinner vessel walls with support struts and thicker flanges to the front and rear of the vessel. Of more importance in this approximation is the realistic total mass of the vessel since this effects the neutron production rate in the steel. Within the vessel the detector includes a cathode frame with dimensions m3 made of perspex and mounted vertically in the centre of the detector volume, as suggested (as one of the possible designs) for a future larger scale TPC [14]. To either side of this frame are another two frames, which are used to support the two multi-wire proportional chambers (MWPCs). The dimensions of these frames are m3 and they are positioned so the inner grid wire plane sits m out to the edge from the central cathode plane. The wires themselves have not been included, since the increased complexity of the detector geometry would increase the simulation run-time significantly yet give no improvement to the overall results, as the mass of these wires and their effect are negligible when compared to other detector components. The rest of the volume within the vessel is filled with CS2 gas at a pressure of torr, with a density of kg m-3. CS2 gas is chosen for DRIFT-type detectors as it is electronegative, i.e. CS2 molecules attract free electrons and drift in an electric field towards the MWPC reducing diffusion, which is quite large for drifting electrons [15]. The gas pressure ( torr) was chosen to reduce the amount of diffusion of the ions in the gas and therefore ensure good spatial resolution and directionality. The fiducial volume within the MWPC frames is m3, which gives a target mass of kg. This is a possible design for the second generation DRIFT-type detectors [14].
An approximation of the resistor chain in the field cage of the detector is also included to simulate the neutron background from the ceramic material of the resistors. The dimensions of the resistors were approximated to a cuboid of ceramic material positioned along the long side of the fiducial volume just outside the perspex MWPC frames. The volume of ceramics was .
Varying amounts of passive neutron shielding (CH2) were added to the simulation geometry in order to evaluate the quantity required to reduce the rate of nuclear recoils due to the rock neutron background to less than one per year for a target mass of kg ( of the modules described above). This is a reasonable reduction that will allow a sensitivity comparable to other world-class dark matter detectors to be achieved.
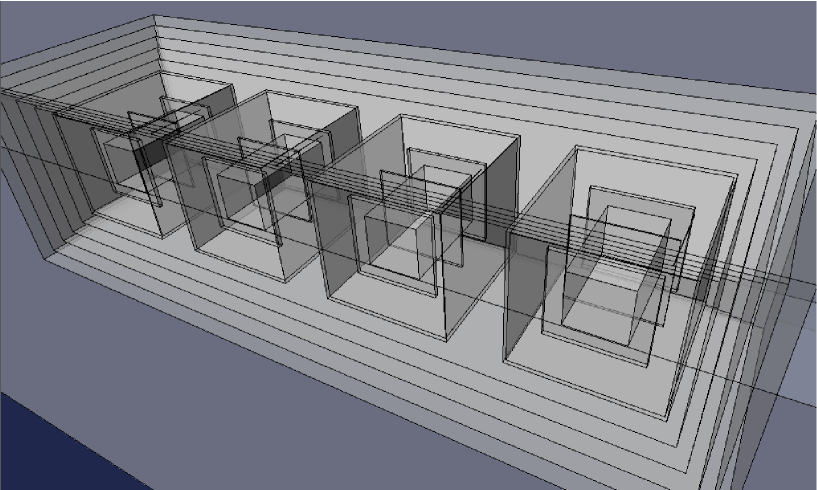
Multiple detectors were also simulated to assess the effects of other neutron background sources and shielding between detectors. To investigate this, four detectors were grouped and positioned in a row with varying amounts of CH2 neutron shielding between the vessels (see Figure 3 for illustration).
3. Neutrons from rock
Simulations of neutrons being produced in the rock surrounding the detector laboratory were performed chiefly in order to establish the amount of hydrocarbon shielding required to reduce the recoil rate observed in the detector to well below one per year. This is fundamental to gaining greater sensitivity and enhancing capabilities of observing WIMP-nucleus interactions.
Neutron production by radioactive isotopes in the decay chains of uranium and thorium was calculated using the SOURCES code [7], as follows. Spontaneous fission (of 238U mainly) was simulated using the Watt spectrum [16]. Neutron fluxes and spectra from (,n) reactions were obtained taking into account the lifetimes of isotopes, energy spectra of alphas, cross-sections of reactions as functions of alpha energy, branching ratios for transitions to different excited states, stopping power of alphas in various media, and assuming isotropic emission of neutrons in the centre-of-mass system.
The original SOURCES code provides a treatment of (,n) reactions up to MeV -energies only. The code was modified to allow treatment of alphas with higher energies [8]. Existing cross-sections were extended to MeV, taking into account available experimental data. For some materials used in detector construction, new cross-sections were added to the code. The Nuclear Data Services of the Nuclear Data Centre at the International Atomic Energy Agency [17] were used to obtain cross-sections. The branching ratios for transitions to the ground and excited states above MeV were chosen to be the same as at MeV. This resulted in a small overestimate of neutron energies for alphas above MeV, since the increased probability of transition to the higher states was neglected. If the excited levels were not in the code library, as was the case for elements for which the cross-sections were absent too, then in adding the cross-section we assumed that the transition was occurring to the ground state only.
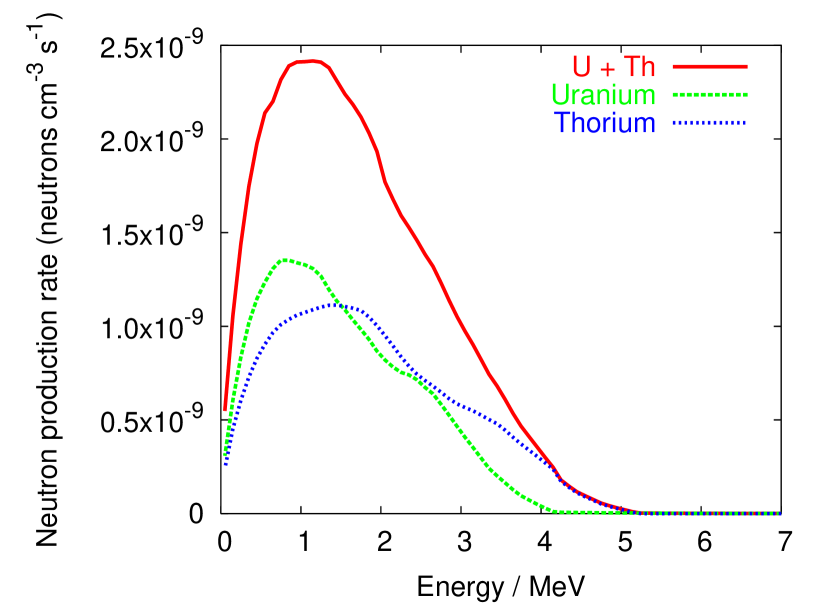
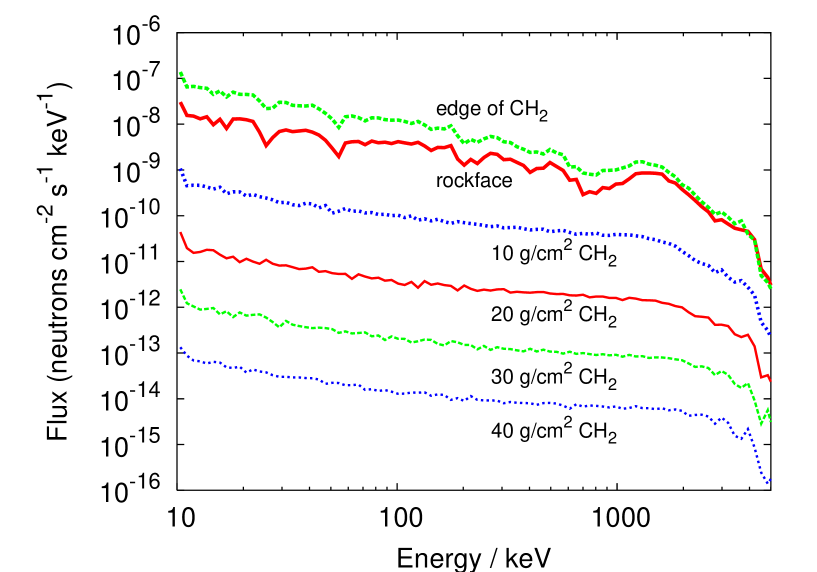
The neutron energy spectrum produced by this modified SOURCES code (shown in Figure 4) was assigned to neutrons being generated isotropically within a m thickness of rock at the edge of the laboratory volume. Values for the uranium and thorium content in the rock ( ppb and ppb, respectively) were taken from measurements [13, 18] at Boulby mine. This gives a total neutron production rate of neutrons cm-3 s-1 with a mean energy of MeV. From this input spectrum the neutrons were propagated through the rock to the laboratory cavern using the GEANT4 toolkit. At the rock-laboratory boundary the neutron positions and 4-momenta were recorded and the neutrons were terminated. The flux of neutrons at the rock-lab boundary was found to be cm-2 s-1 above keV, cm-2 s-1 above keV and cm-2 s-1 above MeV. These values are lower than reported in Ref. [8] because of the smaller contamination levels of U and Th used in the work presented here. The spectrum at this boundary was then used to begin the next stage of neutron propagation, from the rock-laboratory boundary to the detector. The volume of rock surrounding the laboratory volume was kept during this second stage to ensure that back-scattering of neutrons from the cavern walls was allowed to occur. The detector was simulated both without any shielding and also with varying thicknesses of hydrocarbon neutron shielding. In the case of the shielded detector, the neutrons were propagated through the shielding in several stages ( g cm-2 each stage) – a convenient technique to reduce the CPU time, improve statistics and, therefore, decrease statistical uncertainties. In all runs the number of events processed was large enough to ensure the statistical uncertainties were .
Two amounts of CH2 were investigated, g cm-2 and g cm-2, to evaluate the effectiveness of the shielding. The shielding tested with this simulation was CH2 with a density of g cm-3. The neutron flux through the layers of shielding in the g cm-2 simulation are shown in Figure 5. These results are similar (after re-scaling) to other simulations carried out using higher uranium and thorium contamination levels [8]. The suppression of neutron flux by the CH2 shielding agrees within a factor of 3 with the early simulations [19] carried out with the MCNP code [20], although different geometries and input neutron spectra used in the present work and in early simulations make accurate comparison difficult.
Four modules were also positioned side by side for some simulation runs and varying amounts of CH2 shielding were placed in between the vessels to study the change in background rates and the requirements for shielding between modules.
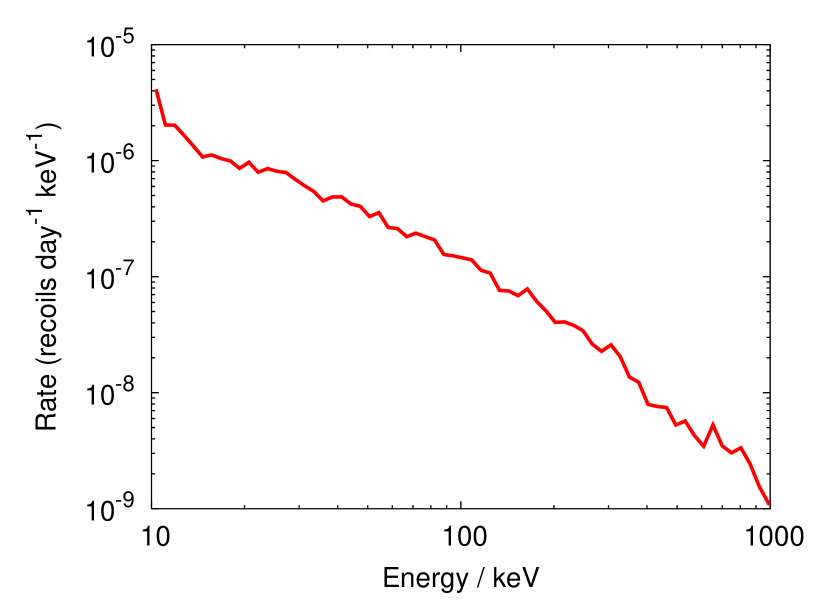
The results are summarised in Table 1 and the energy spectrum of the nuclear recoils in a TPC behind g cm-2 of CH2 is plotted in Figure 6. Passive neutron shielding of g cm-2 of a hydrocarbon material is required to suppress the nuclear recoil rate due to background neutrons to well below per year for a gas TPC detector with geometry as described above. Neutron shielding between modules does not seem to be necessary to sufficiently reduce the recoil rate due to rock neutrons, although it does appear to have a small effect in suppressing them when vessels are grouped together, since the total amount of hydrocarbon material increases.
The results quoted here can be scaled to give expected recoil rates in a similar detector with a different gas pressure or volume. A simple linear scaling is reasonable up to about torr, i.e. doubling the gas pressure, or volume, doubles the recoil rate. Above circa torr, the probability of multiple scattering becomes non-negligible to produce a bias in the results.
Some measurements suggest a harder neutron spectrum from rock than obtained from SOURCES (see Ref. [8] for comparison). In this case 5-10 g cm-2 more of CH2 may be required to ensure similar suppression of neutrons.
4. Muon-induced neutrons
For the case of muon-induced neutrons the muon spectrum and angular distribution was simulated using the MUSUN Monte Carlo code (see Ref. [21] for description). Normalisation of the muon (and neutron) spectrum was achieved using the measured value for the muon flux at the Boulby Underground Laboratory: cm-2 s-1, which corresponds to a rock overburden at vertical of m w. e. [22]. The quoted muon flux is for a spherical detector with unit cross-section. For any other experimental site at similar depth the neutron flux can be scaled roughly as the muon flux. Variation of muon energy spectrum with depth can be accounted for by using the dependence of neutron production on the mean muon energy as [21]. Changes in the neutron flux due to different rock composition around the laboratory (pure NaCl was used in this work) can be estimated following the dependence of the neutron production on the mean atomic weight of the rock as , although large fluctuations from this relation are possible due to the peculiarities in neutron production and scattering in different materials [21].
Muons were sampled on the surface of a cube of rock (NaCl) m3. The laboratory cavern of size m3 was placed inside the salt region at a depth of m from the top, and a distance of m from each vertical surface of the cube. The cavern contained , or 40 g cm-2 thick shielding made of hydrocarbon material (CH2). A TPC design similar to a single module described in the previous section was used. Assuming a practical pressure of torr the fiducial mass is equal to g. For most simulation runs the pressure was chosen to be torr ( times the assumed operational TPC pressure) and the results were re-scaled to the value of torr by dividing the rate by . Such an approach is valid since the probability of double recoils at 4000 torr pressure is still . This was checked by running simulations at lower and higher pressures. At a pressure torr more than 90% of events are single nuclear recoils and their numbers scale with density. At higher pressure the fraction of double (and triple) nuclear recoil events increases with density. The results obtained for torr can be re-scaled to lower values of pressure.
Simulations of muon propagation and interactions, development of muon-induced cascades, neutron production, propagation and detection were performed with FLUKA [6]. Tests of muon-induced neutron simulations with FLUKA can be found in [21, 23]. Recently the detailed comparison between FLUKA and GEANT4 for muon-induced neutrons has been performed [24]. It was shown that the fluxes and spectra of fast neutrons agree within 20%, and the total neutron yields do not differ by more than a factor of 2 (depending on the material).
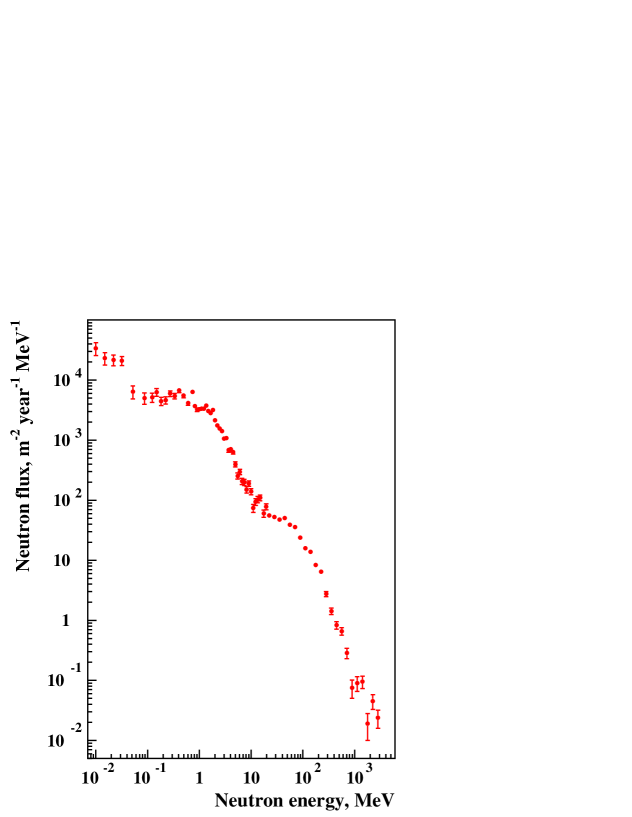
The neutron production rate in NaCl at Boulby was found to be neutrons per muon per g cm-2 of muon path. The total neutron flux at the rock-cavern boundary is cm-2 s-1 above MeV if each neutron is counted as many times as it enters the cavern (this takes into account neutrons which cross the cavern, enter an opposite wall and are scattered back into the cavern). Figure 7 shows the neutron spectrum entering the TPC volume (vessel-gas boundary).
Neutrons produced around the detector can cause nuclear recoils in the gas that mimic WIMP-induced signals. Under the assumption that DRIFT-type detectors can be made insensitive to gammas [2, 3, 4], all nuclear recoils (even those accompanied by gammas, electrons or muons) are of potential danger to the detector sensitivity.
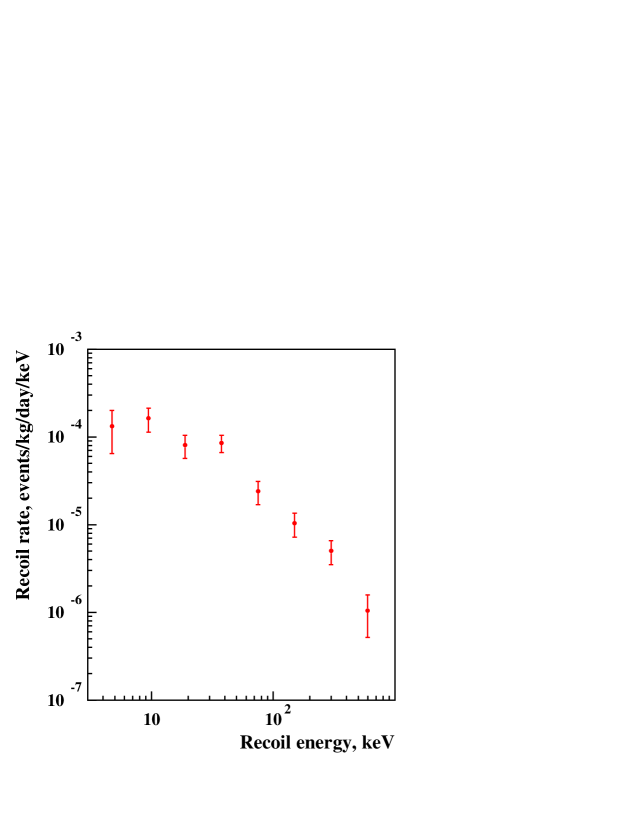
Figure 8 shows the energy spectrum of nuclear recoils originated from muon-induced neutrons in a TPC filled with CS2. More than are single recoils in torr gas. Obviously only single recoils will be detected at much smaller pressures. Note, however, that FLUKA does not generate nuclear recoils below MeV neutron energy realistically. Kerma factors, equivalent to the average energy deposition, are calculated for neutron interactions. So, the energy spectrum of recoils has larger systematic uncertainties than the total number of neutron-induced events.
More than million muons were simulated in total for various gas densities and shielding thicknesses, which corresponded to a live time of more than years for a single module with torr. Only those runs with a density no more than torr were included in further analysis (about million muons – years of running time with torr) to ensure that multiple recoil events do not add more than to the total rate. The result of this simulation yields a total of nuclear recoils per year in a g fiducial mass module shielded with 40 g cm-2 of CH2. This also includes events where nuclear recoils are in coincidence with any other form of energy deposition in the detector not associated with nuclear recoils (electrons, hadrons, muons etc.). The errors shown are purely statistical. About a half of this rate ( per year) corresponds to nuclear recoils only, without any other energy deposition. Unfortunately, it is difficult to say without full Monte Carlo of the detector response, whether a TPC will be in any way sensitive to electrons, hadrons or muons, or what the energy threshold could be, above which the energy deposition of these particles could be detected. Moreover, since the simulations were performed at a pressure that significantly exceeds the pressure for which results are quoted, the rate of stochastic interactions of photons, electrons, muons and hadrons should be re-scaled to the required pressure, and the resulting energy deposition from ionisation loss of electrons, muons and hadrons should also be corrected accordingly. So, no definite conclusion can be derived about the efficiency of rejecting neutron events by looking at the associated energy deposition of accompanying particles without full Monte Carlo of detector response at the actual operating pressure of a realistic detector. Keeping this in mind we present here two limiting cases, for which either all neutron-induced nuclear recoils are the background, or, assuming efficiency of detecting other particles, only nuclear recoils without any other charged particle in the fiducial volume are of potential danger. About nuclear recoils per year are expected to be within an energy range of interest for dark matter searches ( keV recoil energy). About half of them ( per year) are events with nuclear recoils only (without any other particle entering the fiducial volume). This rate also has an uncertainty associated with the treatment of nuclear recoil energy in FLUKA.
Comparing the above rates of nuclear recoils with and efficiency for other particle detection, we conclude that for such a TPC, the ability to detect ionisation from single-charge particles could improve sensitivity. This can be achieved by lowering the threshold of the detector and registering small signals on them if a TPC is triggered by a nuclear-recoil-like pulse. Another way is to detect the sum of energy depositions from all wires, in addition to the signal from each wire. In this case a small signal on a single wire from ionisation energy loss of a muon, for example, is below the threshold on a single wire, but the total energy deposition on all wires can still be visible.
Simulations were also carried out with cm thick vessel walls (instead of a chosen standard thickness of cm, which gives a mass of kg of stainless steel). A decrease in neutron rate of circa was found with cm walls, which does not significantly exceed statistical fluctuations. This means that the vessel is not expected to be the major contributor to the muon-induced neutron flux at the detector.
To check the effect of the shielding the simulations were also carried out with 20 and 30 g/cm2 of CH2. About a increase in the neutron-induced recoil rate was found with 20 g/cm2 of CH2, whereas only small increase in recoil rate (not statistically significant) was observed for 30 g/cm2 of CH2.
Most dark matter detectors also need lead (or other high-Z) shielding to absorb gammas coming from the rock. A low pressure TPC, however, may not need this since it can be made insensitive to gammas [2, 3]. Recently a new idea of using a TPC to detect Kaluza-Klein axions was proposed [25], which requires the detection of low-energy gammas and, hence, suppression of gamma background. To study the effect of lead shielding on neutron production we added cm of lead between the rock and hydrocarbon shielding (30 g/cm2) and found an increase in the recoil rate of about . This is due to the efficient production of neutrons in lead. Note that by detecting accompanying cascade particles a TPC chamber could, in principle, reject most of these events. By no means do we recommend installation of lead behind the hydrocarbon shielding - this would result in a largely enhanced production of neutrons in lead, which could then penetrate into the main vessel left without hydrocarbon shielding. To reject those events a powerful active veto with more than efficiency for muon and cascade detection is needed. More discussions about neutron production in lead and hydrocarbon can be found in Refs. [8, 21, 23].
5. Neutrons from detector components
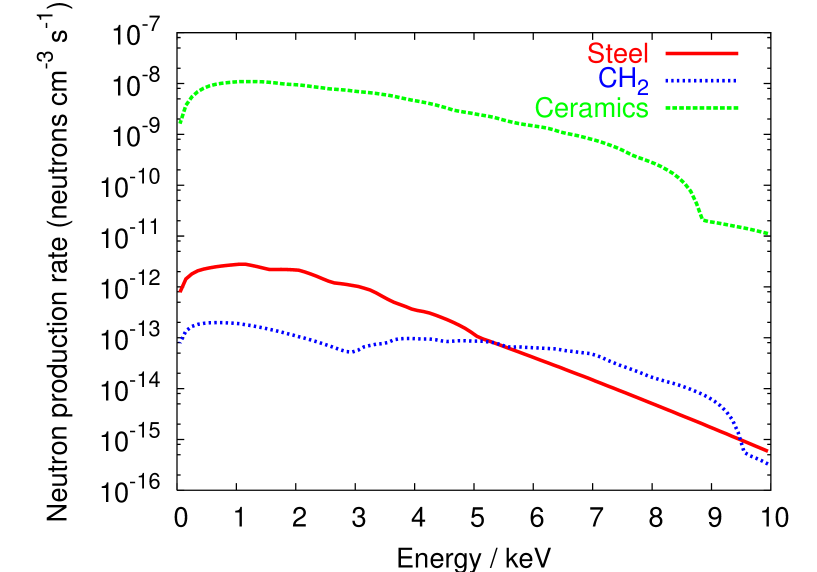
It is likely that the main limitation on the sensitivity of a dark matter detector is the rate of neutron background originating in the detector itself. This is largely due to the difficulty of positioning passive shielding within the detector and finding materials with low radioisotope contaminations. This makes simulation of these backgrounds a very important task in determining the level of radioisotope contamination that can reasonably be accepted in the materials used to build the detector to ensure the sensitivity is not significantly compromised. For the design of TPC used here, the component materials expected to produce the largest neutron backgrounds are the stainless steel vessel, the ceramic material of the resistor chain and the hydrocarbon shielding. The neutron production spectra generated by SOURCES for all three components are shown in Figure 9.
In all runs simulating neutrons produced in detector components the number of events processed was large enough to ensure that statistical uncertainties were .
The levels of uranium and thorium contamination assumed to be present in the stainless steel of the detector vacuum vessel were ppb for each element. These values are reasonable for low carbon stainless steel with low levels of radioisotopic impurities. From the contamination values assumed one might expect a neutron production rate of neutrons s-1 cm-3 in one vessel ( thick steel).
Simulations of neutrons produced from contaminants in the stainless steel of the vessel were performed for a single module as well as for four modules grouped together as described in section 2. It was assumed that shielding between the vessels would be of more importance regarding the neutron background from the detector components because, unlike that for the background from the surrounding rock, the fiducial volume is not protected from the massive steel vessels by any passive neutron shielding. It was found (see Table 2) that the shielding between modules can be thin ( g cm-2) in comparison to that required externally to shield from rock neutrons, and that adding more shielding has very little effect on the resulting recoil rates.
For the main element of stainless steel – iron – only the (,n) cross-section on 54Fe has been measured, hence we used this cross-section for all iron isotopes. Although for some isotopes in stainless steel the energy threshold for (,n) reactions is quite low, the Coulomb barrier suppresses the cross-section below about 7 MeV. Our calculations with SOURCES show that spontaneous fission dominates the neutron production from uranium in iron. We compared our results for a total neutron yield from U and Th in iron and stainless steel with a calculation carried out by Heaton [26] for iron on the basis of the measurements by West and Sherwood [27]. We found that for equal contamination levels of U and Th, Heaton’s yield for iron is higher than our result for iron. The spontaneous fission rate of U is the same in both cases, but its contribution to the total yield is different for the two calculations: spontaneous fission dominates in our case but is roughly equal to the (,n) reaction contribution in Heaton’s estimate. According to the measurements [27] and our simulations with SOURCES, stainless steel gives a slightly higher neutron yield than pure iron, so for stainless steel our yield is about smaller than was suggested by the measurements. We can interpret this difference as an estimate for the systematic uncertainty in our calculations. Unfortunately, the calculations of Heaton [26] cannot be used to generate recoil spectra since they do not contain information about neutron energies and the cross-sections of (,n) reactions are not available from the measurements quoted above.
The levels of uranium and thorium contamination assumed to be present in the ceramic material of the resistor chain in the TPC were ppb and ppb, respectively. These values were estimated from measurements of several resistors [18]. The values are not expected to be precise as they can vary significantly from one batch of resistors to another, but they are reasonable estimated averages that are, if anything, biased slightly high to provide upper limits on the recoil rates produced. The neutron production rate in ceramics with these values of radioisotope content is neutrons s-1 cm-3. The estimate of the number of resistors to be used in a TPC detector of this design is and average resistor dimensions are mm diameter and mm length, giving a total mass of of ceramics. Simulations were then run using a single detector geometry surrounded by g cm-2 of CH2 shielding.
There were several measurements of the uranium and thorium contaminations in the hydrocarbon materials used for neutron shielding [18]. We used here the concentrations of ppb U and ppb Th, as an approximate average of the measured values. The neutron production rate calculated for this CH2 material with the contamination levels mentioned above is neutrons s-1 cm-3. A single module surrounded by of CH2 () was simulated, with a total mass of .
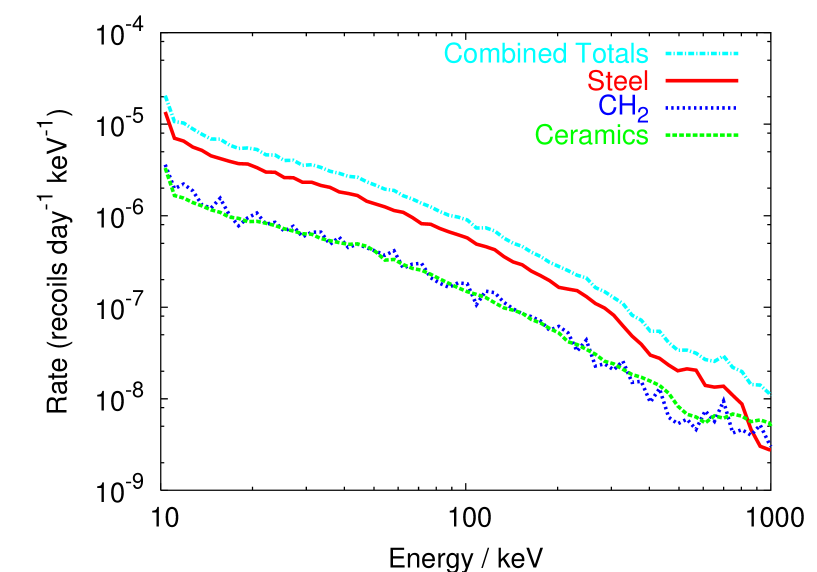
The nuclear recoil energy spectra produced by neutrons from these three detector components are shown in Figure 10. The resulting rates from the detector components are given in Table 2. The contribution to the recoil rate at energies between and keV due to neutron background from detector components for a single detector as described here is recoils per year. The recoil rate at energies between and keV due to these backgrounds is 40% higher. This rate can be suppressed by more than an order of magnitude by installing 10 g/cm2 of additional CH2 shielding just around the sensitive volume of the detector.
Another background source to be considered is radon. The associated background is that of heavy nuclear recoils from radon decay products (see also Ref. [8] for discussion), implanted on the surface on the TPC vessel and other components. These recoils, along with alphas may contribute to the indistinguishable background events, however, both radon associated and alpha events can be rejected if they enter the fiducial volume from an edge, where active veto wires are positioned on the MWPCs (most recoils and alphas will be produced in the vessel walls or internal shielding). Detailed simulation of the detector response to alphas and nuclear recoils (including those from detector internal parts) for an approved DRIFT II design is in progress.
6. Bounds on WIMP sensitivity of a low pressure TPC due to neutron background
From the simulations of neutron background we can now investigate its effect on the sensitivity of a low pressure gas TPC acting as a dark matter detector. We assume that both gamma and alpha backgrounds are fully suppressed and/or rejected. As mentioned above, gammas (via electrons) induce typical signals that are below the energy threshold or can be cut, giving a suppression of more than [2, 3]. Alphas can be efficiently rejected as they are produced mainly in the vessel walls and readout wires, have long tracks and can be vetoed by wires close to the walls. Reduction of the sensitive volume of the detector relative to the total volume of gas is partly due to the necessity of rejecting alphas from the vessel walls.
We consider a module described above with a fiducial mass of 167 g. The contributions to the nuclear recoil rate at 10-50 keV from different sources are shown in Table 3. The thickness of hydrocarbon shielding around the detector was assumed to be 40 g cm-2, reducing the recoil rate at 10-50 keV due to rock neutrons to 0.01 events/year (column 2 in Table 3).
For muon-induced neutrons we consider here a case of efficiency in rejecting nuclear recoils associated with any other charged particle in the fiducial volume. This is a reasonable estimate for the detector sensitivity. The nuclear recoil rate is shown in column 3.
For neutrons from detector components we present a case for a single module surrounded by shielding (column 4). Contamination levels of 0.5 ppb were assumed for both U and Th in the stainless steel vessel, which is a reasonable estimate made using a number of available measurements.
It is obvious that the mass of a single module is not enough for the detector to be sensitive to the particle dark matter candidates favoured by SUSY models. A realistic detector will probably have 20 or 60 modules with the fiducial masses of 3.33 and 10 kg, respectively. The recoil rates for these detectors are shown in the 3rd and 4th rows of Table 3. We consider here modules separated by the CH2 shielding to reduce the neutron flux from detector components.
It is clear that even for kg fiducial mass, the recoil rate at keV from rock neutrons does not limit the detector sensitivity if g cm-2 of hydrocarbon shielding is installed around the detector. Muon-induced neutrons are more significant giving between and events per year (in case of g/cm2 of CH2) in a kg detector, depending on the efficiency of single-charge particle detection ( events in Table 3 for efficiency). This number can be reduced by a factor of by installation of an active veto, for instance a liquid scintillator, around the detector. Such a veto can also act as a shielding against rock neutrons in the same way as any other hydrocarbon material. Note that muon-induced neutrons effect the TPC sensitivity to dark matter more than is the case for high density targets [8]. This is because the low pressure makes the detector much less sensitive to gammas and electrons, coincidence with which helps in rejecting nuclear recoils in liquid/solid materials. Another reason is the back-scattering of neutrons from the internal walls of the vessel which increases the total flux of neutrons through the target in TPC.
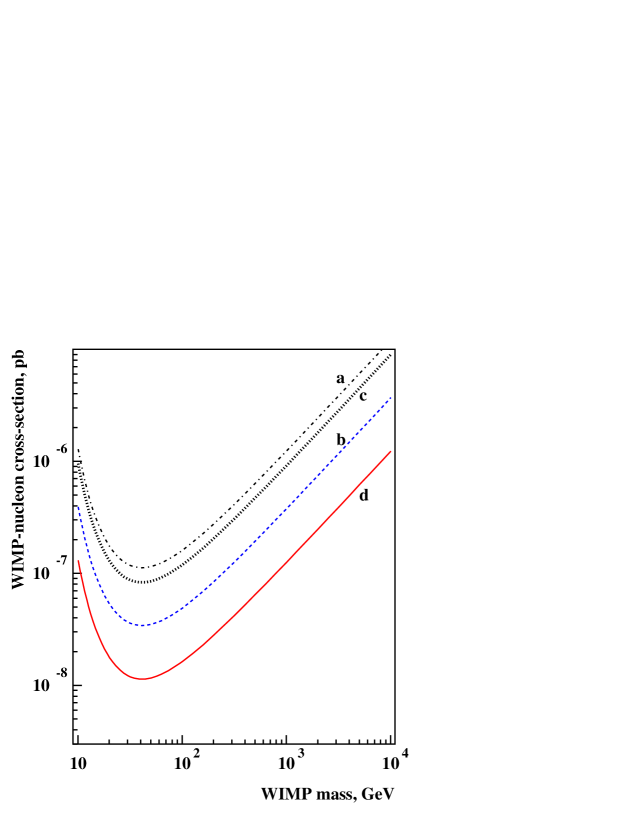
The bounds on the sensitivity at confidence level (CL) of a low pressure TPC detector from neutron background are shown in Figure 11 for year of running time. They were calculated using the same procedure as for the case of large-scale xenon detector [8]. In all cases the energy range of keV was used for analysis. In a real experiment, the measured efficiency of the detector as a function of energy should be used to set limits. Nuclear recoils from alpha decays in the materials around the fiducial volume were assumed to be vetoed by wires adjacent to the walls, whereas the rate of recoils and alphas from MWPC and cathode wires was neglected.
The upper solid curve shows the best limit, which can be achieved with a kg detector ( standard modules) in one year of running, assuming events detected from muon-induced neutrons and detector components (upper limit of events at CL from [28]). This number corresponds to about efficiency of rejecting events in coincidence with any other charged particle in the sensitive volume. The number of events can be reduced to less than per year by installing a muon/neutron veto around the detector. Assuming events detected we can plot a sensitivity curve corresponding to the upper limit of at CL (dotted line).
For a kg detector we can take events per year detected from muon-induced neutrons and detector components. This gives an upper limit of events per year at CL and the limit shown by dashed curve. Again, assuming an efficient active veto and smaller U/Th levels in the vessel, this number can be cut down to well below event/year and the limit will be as shown by the lower solid curve (assuming events detected).
7. Summary and conclusions
We conclude that to suppress the nuclear recoil rate due to neutrons produced in the rock to a reasonable level in a low pressure CS2 TPC, g cm-2 of hydrocarbon shielding is required around the modules. It is also advisable, due to the rate of neutrons produced in the steel vacuum vessels, to place at least g cm-2 of hydrocarbon shielding between modules that are positioned side by side. The total recoil rate expected in a single module, in an array of modules and in an array of modules due to the neutron backgrounds described above are , and events per year respectively, assuming detection efficiency for single-charge particles. Adding low-background hydrocarbon shielding around the sensitive volume of the detector to protect it from neutrons from detector components, and installing an active veto around the detector against muons and their secondaries, would reduce the background rate by an order of magnitude. This would allow the sensitivity of pb to spin-independent WIMP-nucleon cross-section to be achieved with a kg TPC.
8. Acknowledgements
This work was performed in affiliation with the UK Dark Matter Collaboration (University of Edinburgh, Imperial College London, Rutherford Appleton Laboratory and University of Sheffield) and contributes to collaboration-wide simulation efforts. We also acknowledge the work performed by our colleagues at Occidental College, L.A., and Temple University, Philadelphia, especially Prof. D.P. Snowden-Ifft and Prof. C.J. Martoff. This work is funded by PPARC. We also acknowledge the funding from EU FP6 programme – ILIAS.
References
- [1] C. J. Copi and L. M. Krauss, Phys. Rev. D 63 (2001) 043507; B. Morgan, PhD thesis, University of Sheffield, 2004.
- [2] G. J. Alner et al. Nuclear Instrum. & Meth. in Phys. Res. A. 535 (2004) 644.
- [3] D. P. Snowden-Ifft et al. Nucl. Instrum. & Meth. in Phys. Res. A 498 (2003) 155.
- [4] G. J. Alner et al. In preparation.
- [5] GEANT4 Collaboration. Nucl. Instrum. & Meth. in Phys. Res. A, 506 (2003) 250; http://geant4.web.cern.ch/geant4/.
- [6] A. Fassò, A. Ferrari and P. R. Sala. Proceedings of the MonteCarlo 2000 Conference (Lisbon, October 23-26, 2000), Ed. A.Kling, F.Barao, M.Nakagawa, L.Tavora, P.Vaz (Springer-Verlag, Berlin, 2001), p. 159; A. Fassò, A. Ferrari, J. Ranft and P. R. Sala, ibid. p. 995.
- [7] W. B. Wilson et al. SOURCES-4A, Technical Report LA-13639-MS, Los Alamos (1999).
- [8] M. J. Carson et al. Astroparticle Physics 21 (2004) 667.
- [9] H. Wulandari et al. Proc. 4th International Workshop on the Identification of Dark Matter (York, UK, 2-6 Sept, 2002), ed N. J. C. Spooner and V. Kudryavtsev (World Scientific, Singapore, 2003), p. 464; H. Wulandari et al. Astroparticle Physics 22 (2004) 313.
- [10] G. Chardin and G. Gerbier. Proc. 4th International Workshop on the Identification of Dark Matter (York, UK, 2-6 Sept, 2002), ed N. J. C. Spooner and V. Kudryavtsev (World Scientific, Singapore, 2003), p. 470.
- [11] J. M. Carmona et al. Astroparticle Physics 21 (2004) 523.
- [12] H. J. Kim et al. Astroparticle Physics, 20 (2004) 549.
- [13] P. F. Smith, D. Snowden-Ifft, N. J. T. Smith, R. Luscher and J. D. Lewin Astroparticle Physics 22 (2005) 409.
- [14] S. M. Paling (for the Boulby Dark Matter Collaboration). Talk given at the 6th UCLA Symposium on Sources and Detection of Dark Matter and Dark Energy in the Universe (Marina del Rey, CA, USA, 18-20 February, 2004), http://www.physics.ucla.edu/hep/dm04/talks/paling.pdf.
- [15] C. J. Martoff et al. Nuclear Instrum. & Meth. in Phys. Res. A, 440 (2000) 355.
- [16] B. E. Watt. Phys. Rev., 87 (1952) 1037.
- [17] http://www-nds.iaea.org/
- [18] http://hepwww.rl.ac.uk/ukdmc/Radioactivity/Index.html
- [19] V. A. Kudryavtsev et al. Proc. 4th Intern. Workshop on the Identification of Dark Matter (York, UK, 2-6 September 2002), ed. by N. J. C. Spooner and Vitaly Kudryavtsev, p. 477.
- [20] MCNP-4B, Technical Report LA-12625-M (Ed. J. F. Briesmeister), Los Alamos, 1997.
- [21] V. A. Kudryavtsev, N. J. C. Spooner and J. E. McMillan. Nuclear Instrum. & Meth. in Phys. Res. A, 505 (2003) 688.
- [22] M. Robinson et al. Nuclear Instrum. & Meth. in Phys. Res. A, 511 (2003) 347.
- [23] Y.-F. Wang et al. Phys. Rev. D, 64 (2001) 013012.
- [24] H. M. Araújo et al. Submitted to Nuclear Instrum. & Meth. in Phys. Res. A; hep-ex/0411026.
- [25] B. Morgan et al. Astroparticle Physics, in press.
- [26] R. Heaton et al. Nucl. Geophys., 4 (1990) 499.
- [27] D. West and A. C. Sherwood. Ann. Nucl. Energy, 9 (1982) 551.
- [28] See, for example, http://pdg.lbl.gov and references therein; see also G. J. Feldman and R. D. Cousins. Phys. Rev. D, 57 (1998) 3873.
| Description of simulation | Nuclear recoil rates in a single TPC module per year at keV | Ratio of 10-50 keV rate to 10-100 keV rate |
|---|---|---|
| Unshielded single module | ||
| Single module, g cm-2 external CH2 shielding | ||
| Single module, g cm-2 external CH2 shielding | ||
| 4 modules, no intermediary shielding, g cm-2 external CH2 | ||
| 4 modules, g cm-2 CH2 between modules, g cm-2 external CH2 |
| Detector component | Description of simulation | Nuclear recoil rates in a single TPC module per year at 10-50 keV |
|---|---|---|
| Steel vessel | Single module | |
| 4 modules, no intermediary shielding | ||
| 4 modules, g cm-2 intermediary CH2 shielding | ||
| 4 modules, g cm-2 intermediary CH2 shielding | ||
| 4 modules, g cm-2 intermediary CH2 shielding | ||
| Resistor ceramics | Single module | |
| CH2 shielding | Single module |
| Detector mass | Nuclear recoil rates per year at 10-50 keV | |||
| kg | Rock | Muons | Detector | Total |
| 0.167 | 0.01 | 0.12 | 0.06 | 0.19 |
| 3.33 | 0.2 | 2.4 | 1.3 | 3.9 |
| 10.0 | 0.6 | 7.2 | 3.8 | 11.6 |