Measurement of the muon anomaly to high and even higher precision
Abstract
Our recent series of measurements at Brookhaven National Laboratory determined the muon anomalous magnetic moment to a precision of 0.5 ppm. The final result—representing the average of five running periods using both positive and negative muons—is . It lies 2.7 standard deviations above the standard model expectation, which is based on updates given at this Workshop. Importantly, only the annihilation and new KLOE radiative return data are used for the hadronic vacuum polarization input. Because the systematic limit has not been reached in the experiment, a new effort has been proposed and approved with the highest scientific priority at Brookhaven. The goal is an experimental uncertainty of 0.2 ppm, a 2.5-fold reduction in the overall experimental uncertainty. To do so will require a suite of upgrades and several qualitative changes in the philosophy of how the measurement is carried out. I discuss the old and new experiments with a particular emphasis on the technical matters that require change for the future.
1 Introduction
The muon anomalous magnetic moment is one of the most precisely measured and calculated quantities in physics. The standard model (SM) theoretical expectation and the recent experimental measurements have both achieved sub-ppm precision, enabling a sensitive comparison having new-physics ramifications. A significant deviation implies “missing” physics in the model, which is expected to occur in the most popular SM extensions such as SUSY. Here we discuss the status of the most recent experiment and the recently approved new experiment aimed at pushing the precision frontier further by a factor of approximately 2.5. We give a brief review of the current standard model expectation.
The E821 Brookhaven National Laboratory (BNL) experiment [1] is the fourth in a sequence of measurements. The rich history includes three ingenious efforts at CERN, the final one [2] achieving a precision of 7.3 ppm. Our BNL Collaboration took data from 1997 through 2001. The analysis is complete and all results have been reported [3, 4, 5, 6, 7] and a comprehensive review has been published [8]. With nearly equally precise determinations from positive and negative muon samples—the results are perfectly compatible—the CPT-combined final result is . The statistical and systematic uncertainties are combined in quadrature and the 0.5 ppm precision represents a 15-fold improvement compared to CERN-III. The uncertainty is dominated by statistics so it is natural to contemplate an upgrade program aimed at increasing the data accumulation rate while maintaining or reducing the systematic uncertainties. To this end, the E969 Collaboration—formed largely from the present group plus key new institutions—has proposed and has been approved for new running. Several significant conceptual changes, which will increase the data rate fivefold or more and reduce systematic uncertainties further, are required.
The standard model expectation for the muon anomaly is based on QED, hadronic and weak loop contributions. Davier and Marciano have recently published a review of the theory [9] and at this Workshop, numerous speakers provided technical updates to specific contributions. I refer the reader to their expert reports in these proceedings and summarize the current standard model expectation briefly in Table 1. Only the annihilation data are used, together with the new radiative return results from KLOE [10], as the low-energy input to the 1st-order hadronic vacuum polarization contribution. The hadronic light-by-light scattering contribution has been addressed by many authors. I use the recommendation in Ref. [9], which attempts to find a central value with an expanded uncertainty to accommodate different individual evaluations.
| Contribution | Value | Error | Reference | Comment |
| QED | 11 658 471.94 | 0.14 | [11] | 4 loops; 5th estimated |
| Hadronic vacuum polarization | 693.4 | 6.4 | [12] | + KLOE |
| Hadronic light by light | 12.0 | 3.5 | [14] | val. from Ref. [9] |
| Hadronic, other 2nd order | -10.0 | 0.6 | [13] | alt.: |
| Weak | 15.4 | 0.22 | [9] | 2 loops |
| Total theory | 11 659 182.7 | 7.3 | – | – |
| Experiment | 11 659 208 | 6 | [7] | – |
| Expt. - Thy. | 25.3 | 9.4 | – | 2.7 standard deviations |
2 The Old BNL Experiment: E821
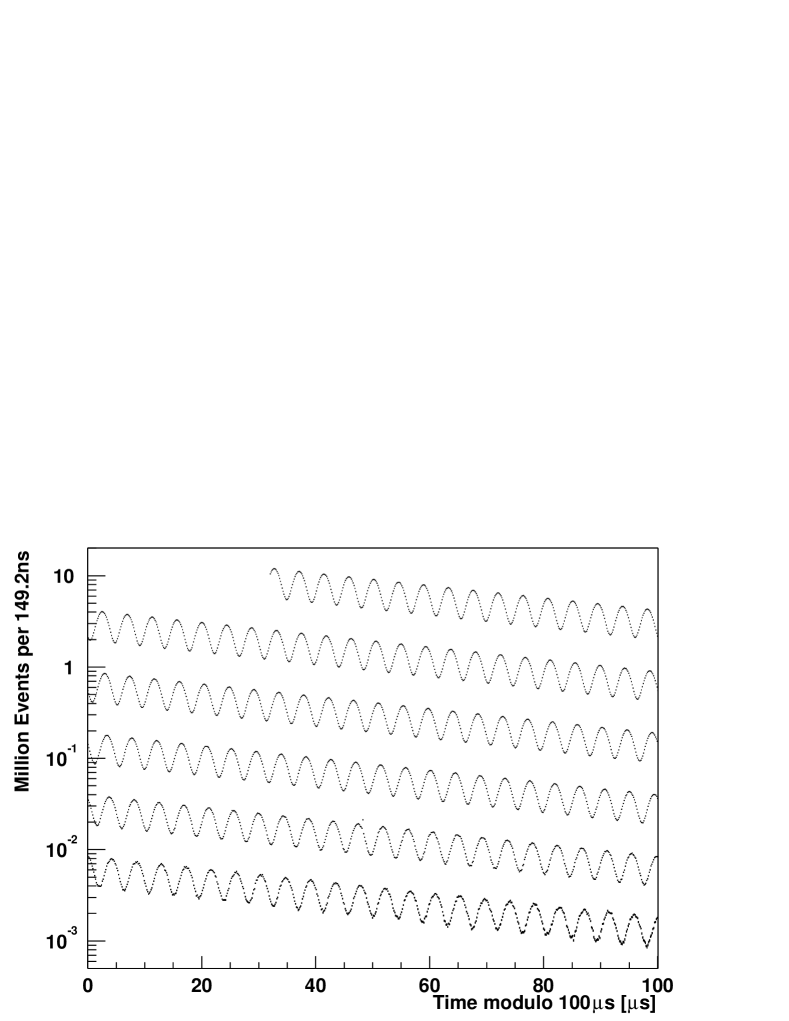
The central element of the BNL experiment is the muon storage ring [15], which has a highly uniform 1.45 T magnetic field, a 7.1 m radius, and vertical containment of the muons by electrostatic quadrupoles [16]. At the magic momentum of 3.094 GeV/ the relativistic gamma is 29.3, the dilated muon lifetime is 64.4 s, and the decay electrons111By convention, we discuss negative muons and their decay electrons throughout this paper. have an upper lab-frame energy of approximately 3.1 GeV. The basic idea of the measurement is to inject and store a bunch of polarized muons into the ring, contain them sufficiently well while they make many revolutions, and record their decay time by detecting the emitted electrons that curl inward and strike electromagnetic calorimeters. If , the initial muon spin direction would remain aligned with its momentum and the rate of decay electrons in the detectors would follow a smoothly falling exponential. For , the muon spin precesses at a rate faster than the muon rotation rate; this additional rotation—the difference between the spin rotation and the cyclotron frequency—is directly proportional to . The average muon spin direction is revealed because parity violation in the weak muon decay correlates the electron energy (on average) with the muon spin direction. The rate of detected electrons having an energy greater than a set threshold is an exponential (as above), but modulated at the anomalous precession frequency, see Fig. 1. The key to the experiment is to determine this frequency to high precision and to measure the average magnetic field to equal or better precision.
The anomalous precession frequency depends on the cyclotron frequency and the spin rotation. In the presence of a magnetic and electric field having , is described by
The term in parentheses multiplying vanishes at and the electrostatic focussing does not affect the spin (except for a correction necessary to account for the finite momentum range around the magic momentum). Equation 2 can be rearranged to isolate , giving multiplied by physical quantities that are known to high precision. The experiment is described below with emphasis on various specific details that will be upgraded for the new E969 effort.
Polarized muons are obtained from the decay . In the massless neutrino limit, helicity conservation implies that the outgoing anti-neutrino is right-handed; its spin is in the direction of its motion. The negative muon—emitted in the opposite direction—is polarized along its motion. In the CERN-III effort, a 3.1 GeV/ pion beam was injected into a storage ring. Decay muons, born during the first turn of the beam in the ring, could fall (with very low probability, ppm) onto stable orbits within the storage ring aperture. The captured muons came from the nearly forward-emitted muons, which had the right momentum but also a small transverse decay “kick” that placed them in the storage ring acceptance. The majority of the pions struck detectors or the storage ring yoke causing an enormous prompt hadronic “flash” in the detectors, which was followed by a slowly diminishing background from the thermalization and capture of neutrons.
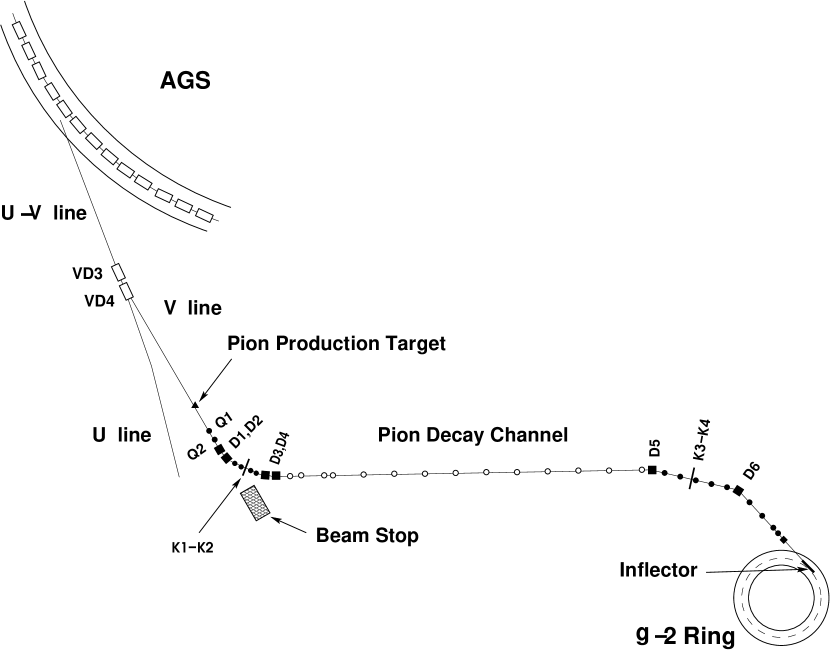
E821 improved on this method of muon loading significantly by directly injecting an enriched muon beam into the storage ring and then using a pulsed magnetic kicker [17] to deflect the muons into the ring acceptance. A pion-muon beamline upstream of the ring was developed to serve three tasks: 1) a pion creation and capture section; 2) a pion-to-muon decay section; and 3) a final muon selection at GeV/. Figure 2 is a schematic of the beamline and storage ring. The pion capture and muon selection sections are tuned to slightly different momenta. Typical operating conditions set the pion momentum greater than . Forward decay muons, but slightly off axis from zero degrees, are captured in the decay channel. A final bend in the beamline is made by setting dipoles D5 and D6 to transport particles having momentum . This excludes a large fraction of the pions, because their average momentum is higher. Slits K3/K4 adjust the momentum bite that is passed into the storage ring. The ratio of pions to muons entering the ring through the superconducting inflector is roughly 1:1 at nominal settings. The ratio can be adjusted: higher muon rates are obtained at the expense of greater pion contamination; lower rates are obtained for lower pion contamination. The employed operating conditions represented an appropriate compromise.
Direct muon injection resulted in an approximately 10-fold increase in the effective stored muon rate and a reduction of the hadronic flash by a factor of 50. But the hadronic flash is not eliminated by this technique. The pions that accompany the muons into the ring still cause significant neutron production and create a prompt flash at injection. Because of this, each of the 24 electromagnetic calorimeters is gated off during injection and turned back on 5 to 30 s after injection; the turn-on time depends on the location in the ring. When the physics fits start, typically 30 s after injection, the photomultiplier tubes (PMTs) are still affected by a slowly decaying background, which appears as a time-dependent pedestal in the recorded digitized pulses. The electron rate in each detector at this time is typically several MHz.
Parity violation in the muon weak decay allows the spin direction to be measured as a function of time (on average). The angular distribution of emitted electrons from polarized muons at rest is where is between the spin and momentum directions and the asymmetry depends on electron energy . Expressions for and are:
| (2) |
with . The asymmetry is negative for low-energy electrons and rises to when . The higher-energy electrons have the strongest correlation to the muon spin. In the lab frame, it is most probable to detect a high-energy electron when the muon spin is pointing opposite to the direction of muon momentum and least likely when the spin is aligned with the muon momentum. The rate of detected electrons above energy threshold is
| (3) |
where is the effective integrated asymmetry with for GeV. Equation 3 is the simplest expression that describes the data. In practice, it can only be used to obtain an estimate of parameters because perturbations to the spectrum are caused from beam dynamics or detector and electronic effects. For example, the natural betatron oscillations of the stored muon ensemble beat with the cyclotron frequency causing an observable modulation in the normalization term above because of a modulation in the effective detector acceptance. In a more subtle manner, the modulation extends to the asymmetry and phase terms. Equation 3 can be easily modified to account for these modulations. Similarly, gain (or energy-scale) stability, pileup, and muon loss terms require small corrections or fit-function modifications in order to obtain a good fit. But these are well-understood procedures having carefully understood implications on the extracted precession frequency . In general, they do not couple strongly to , but they do affect the goodness-of-fit criterion.
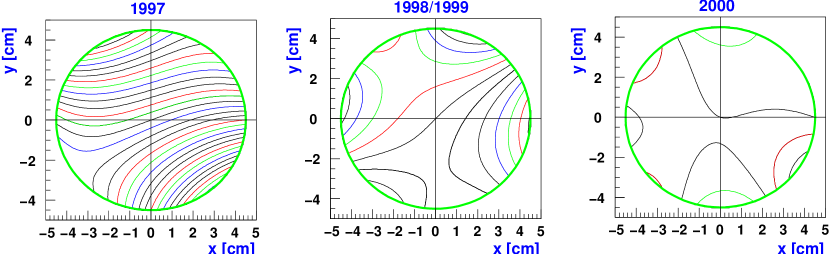
Equation 2 also contains the term , which implies knowing the magnitude of the magnetic field within the storage volume as a function of time and weighting the data with the average field. The best way to make this otherwise daunting task manageable is to shim the field to high uniformity. The uniformity is well illustrated by the three contour maps shown in Fig. 3. Each figure represents an azimuthially averaged magnetic field from the beginning of commissioning in 1997, to the first muon-injection runs in 1998/1999, and later to the high-statistics run in 2000. The contours in these figures represent 1 ppm deviations from the central average field value. The final 2001 field, with reversed polarity, was equally good to the 2000 map. The field is very uniform, not only for the present experiment, but also for the future.
All field measurements rely on proton NMR using a system of probes that obtains the absolute field value, the relative field versus time, and the relative field inside the storage volume. This system [18] uses a standard reference probe, a “plunging” probe that is inserted into the vacuum chambers to transfer the calibration, an NMR “trolley” to map the field inside the storage ring volume, and 378 fixed probes located in the vacuum chamber walls to monitor the field versus time. The magnetic field is measured in units of the free proton precession frequency, . Muonium measurements determine the ratio of muon-to-proton magnetic moments [19] and, in practice, is determined from the expression
| (4) |
where , a ratio determined in our experiment.
In each running year, multiple analyses of both the precession frequency and the magnetic field data were carried out independently. Reports to the collaboration were always made with a secret offset so that no one person could compute . After all results were final and all systematic uncertainties established, the offsets were removed and was computed. Figure 4 illustrates the consistency of the results from each running year beginning with 1998 and Table 4 gives all of the numeric results.
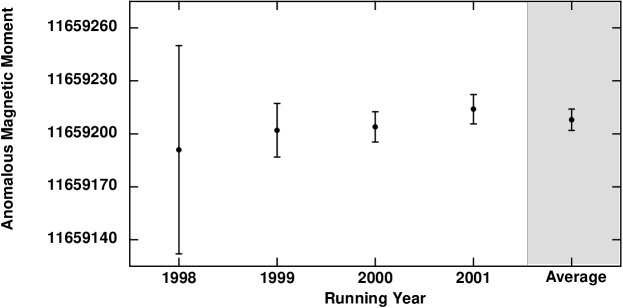
| Year | Polarity | Precision [ppm] | Reference | |
|---|---|---|---|---|
| 1997 | 11 659 251(150) | 13 | [3] | |
| 1998 | 11 659 191(59) | 5 | [4] | |
| 1999 | 11 659 202(15) | 1.3 | [5] | |
| 2000 | 11 659 204(9) | 0.7 | [6] | |
| 2001 | 11 659 214(9) | 0.7 | [7] | |
| Average | 11 659 208(6) | 0.5 |
A precision measurement depends on control of the systematic uncertainties. Table LABEL:tab:syster lists all the principle uncertainties for the last three high-statistics running periods. The categories are separated by the independent and analyses. The trend to reduce the uncertainties in each year is evident, except for the CBO effect, which was only fully understood prior to the final 2001 run so that running parameters could be adjusted to minimize its effect. The goal for the new experiment is to limit the field and the precession systematic uncertainties each to 0.1 ppm. New data taking operation modes of the storage ring are being planned to reduce some of the beam-dynamics related uncertainties such as CBO and muon loss.
| 1999 | 2000 | 2001 | 1999 | 2000 | 2001 | ||
| (ppm) | (ppm) | (ppm) | (ppm) | (ppm) | (ppm) | ||
| Inflector Fringe Field | 0.20 | - | - | Pile-Up | 0.13 | 0.13 | 0.08 |
| Calib. of trolley probes | 0.20 | 0.15 | 0.09 | AGS background | 0.10 | 0.01 | |
| Tracking with time | 0.15 | 0.10 | 0.07 | Lost Muons | 0.10 | 0.10 | 0.09 |
| Measurement of | 0.10 | 0.10 | 0.05 | Timing Shifts | 0.10 | 0.02 | |
| -distribution | 0.12 | 0.03 | 0.03 | E-field/pitch | 0.08 | 0.03 | |
| Absolute calibration | 0.05 | 0.05 | 0.05 | Fitting/Binning | 0.07 | 0.06 | |
| Others† | 0.15 | 0.10 | 0.07 | CBO | 0.05 | 0.21 | 0.07 |
| Beam debunching | 0.04 | 0.04 | |||||
| Gain Changes | 0.02 | 0.13 | 0.12 | ||||
| Total for | 0.4 | 0.24 | 0.17 | Total for | 0.3 | 0.31 | 0.21 |
3 The New BNL Experiment: E969
In September, 2004, the BNL Program Advisory Committee gave the proposal A (g-2)μ Experiment to ppm Precision its highest scientific endorsement, thus officially launching experiment E969 [20]. The central idea is to use the existing BNL storage ring largely as is but to develop a means to increase the stored muon rate, reduce the background, and to maintain or reduce individual systematic uncertainties.
3.1 Backward decay and beamline modifications
When the pion capture section of the beamline is tuned 0.5% above the muon magic momentum, the highest muon flux is achieved. As noted, this small momentum difference passes too many pions into the storage ring, creating background. If the initial pion momentum is set to 5.32 GeV/, then the backward decay muons are produced at 3.094 GeV/ as desired. The mismatch in momentum between the pion capture section and the muon momentum selection section is so great that no pions can pass through the K3/K4 slits shown in Fig. 2. This implies that the entire hadronic flash will be eliminated–a key improvement allowing the detectors to be gated on much earlier after injection and permitting the physics fits to start shortly thereafter. Simulations show that the muons are still highly polarized (albeit, the direction is reversed) and the flux is at or higher than the level obtained in the current forward-decay scheme. To create the backward-decay beam, several new front-end magnetic elements must be built because not all of the present magnets can be ramped up by the momentum ratio factor 5.32/3.15. New magnet designs are being pursued and new front-end tunes are being developed by our team.
Beam transport studies of the pion-to-muon decay section indicate that improved transmission can be obtained by doubling or tripling the number of quadrupole elements in the line. Currently, the 80 m long FODO section has 20 magnets but ample room exists for up to four times as many. For both the forward-decay or the new backward-decay kinematics, the decay muons are captured with a wide angular divergence compared to the pion source. The increased quadrupole density maintains the lateral extent of the secondary muon beam within the magnet bore, thus avoiding losses that presently exist. A gain in rate by a factor of 2 is expected from this straight-forward improvement.
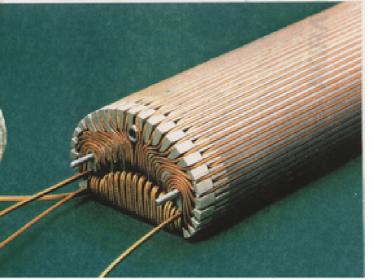
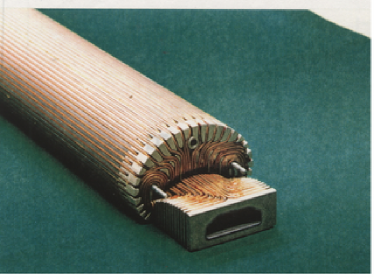
The muon beam enters the storage ring through a superconducting inflector [21]. The inflector has coils that essentially block both the entrance and exit openings. Muons lose energy and scatter as they pass through these coils and approximately half of those muons are lost. A closed-ended inflector is shown in the photograph in Fig. 5a. The full inflector was built with this coil design because it represented a practical choice for reliability reasons at the time of production. However, the opposite end of the inflector prototype had an open end (see Fig. 5b), which performed as well as the closed end in magnetic tests. We intend to build a new full-scale inflector following this design having both ends open to regain the factor of 2 in lost muons.
3.2 Electron detection and data collection
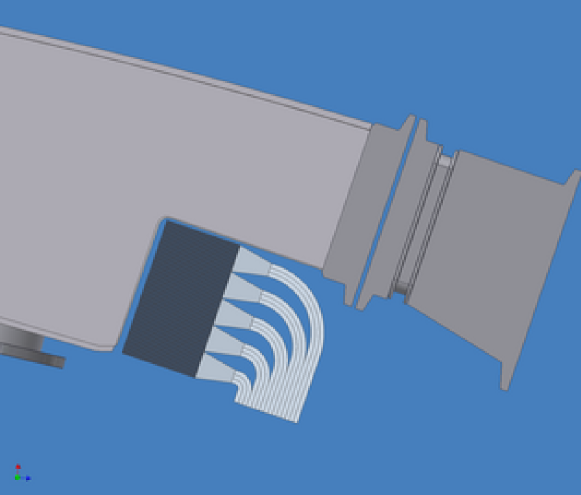
E821 has 24 lead-scintillating fiber electromagnetic calorimeters [22] to detect electron energy and time of arrival. Each 14 cm high by 23 cm wide calorimeter is 12.5 deep (15 cm) and the fiber direction is radial. Four lightguides transport the light to individual PMTs, located below the storage ring midplane to avoid being directly struck during the hadronic flash. Waveform digitizers sample the summed PMT signals every 2.5 ns. A sequence of these samples is the record of a given event. These records are scanned for electron pulses and fit to determine energy and time. Pileup occurs when two pulses strike the detector within the resolving time of the system (typically ns). Pileup events can be removed, on average, by a procedure that uses the leading and trailing samples around a triggered electron pulse, however, a systematic uncertainty remains from incomplete pileup subtraction and from pulses too low in energy to be accounted for properly. Because the rates will increase by approximately fivefold in E969, pileup will dominate the systematic uncertainties if left unimproved. A new calorimeter will be built and a new parallel data-taking method is being developed to address the anticipated higher rates. Additionally, a more finely sampling waveform digitizer will be used and the fivefold vertical segmentation of the existing front scintillator detector hodoscopes will be increased by at least a factor of 2.
The new calorimeter will be dense and fast and it will be segmented transversely with respect to the incoming electrons. Readout of individual segments will occur on the downstream side where space is severely limited by existing vacuum chamber flanges. GEANT studies show that pileup events can be recognized 4 out of 5 times—which is the goal to reduce this systematic uncertainty—if the Moliere radius is restricted to less than 1.7 cm. We have developed a preliminary design using tungsten and scintillating fiber ribbons that meets these requirements. The calorimeter will be subdivided into twenty cm modules, each having a length of 11 cm (). The individually read-out modules are stacked in a 4 high by 5 wide array. Laminated thin acrylic sheets are bundled and bent at 90 degrees toward the inside of the ring to pipe the light to 20 PMTs. A sketch is shown in Fig. 6, where the geometrical constraints are evident.
3.3 The method of data accumulation
The traditional “” method of data selection in E821 involves accepting electrons only when their energy exceeds a fixed threshold. Such events are sorted into histograms of events versus time with weight 1 for each event. In contrast, the “” method does not rely on the separate identification or isolation of events. It simply histograms the energy striking the detectors versus time. All electrons that shower in the calorimeters are included, but their decay time is intrinsically weighted by their energy. The net asymmetry is roughly halved compared to the method but it is compensated for by the use of all events.
Full GEANT simulations were used to compare the methods, finding that the method is statistically weaker by about 9 percent. However, it requires no pileup correction. In fact, for the method, the detectors do not need to be segmented at all because only the integrated energy deposition is of interest. We plan to employ both data-taking methods in E969.
3.4 Magnetic field determination
The magnetic field will be measured to approximately 0.11 ppm using the same technique and apparatus as was used in E821. The uncertainty in the 2001 run was 0.17 ppm and this will be improved. The proposal [20] details the work plan:
-
•
Measurement of the field change from kicker eddy currents in situ [17],
-
•
Extensive measurements with the magnetic field trolley, aiming in particular to better resolve the position of the active NMR volumes inside the trolley shell and to map out the response functions to the level where corrections can be applied, rather than limits be set,
-
•
More frequent measurements of the magnetic field in the storage ring during beam periods,
-
•
Repair and retuning of a number of fixed NMR probes to improve the sampling of the storage ring,
-
•
Analysis refinements to reduce trolley position uncertainties.
4 Summary
Our E821 experiment is complete. The result at 0.5 ppm precision is statistics limited. This brief overview was aimed at illustrating a few of the technical issues that must be addressed to continue the experiment at higher rates and the same or reduced systematic uncertainties. With the full complement of plans realized, we project that an overall uncertainty of 0.2 ppm can be obtained in one run of roughly 20 weeks, which would follow several years of construction and a short commissioning run. The Collaboration is beginning to do the simulation work necessary and a formal Technical Design Report will be written for proper costing and time projections.
If the past history of experiments can be used as a guide, then the next generation effort will certainly reveal exciting physics results. At this Workshop, we have learned of the extensive worldwide effort to establish the standard model expectation with high precision. New radiative return data from KLOE [10] supports the hadronic vacuum polarization determination, which is largely based on the precise CMD-II annihilation measurements. Additional data are expected from BaBar and Belle. Meanwhile, the discrepancy between -based and hadronic tau-based spectral functions remains. Until this is resolved, Davier and Höcker suggest using the -based results, which is reflected in Table 1. Many contributions to this Workshop have helped to clarify the issues related to the hadronic contributions to the standard model expectation. Projecting to the future, we believe that the theoretical uncertainty can be reduced to ppm. Combined with an experimental uncertainty of 0.2 ppm, this will yield an improved sensitivity to new physics by a factor of 2. The current difference between experiment and theory is tantalizing, but not definitive. An additional resolution by a factor of 2 is therefore very exciting to contemplate and we all eagerly anticipate this next step in precision.
5 Acknowledgments
The author expresses gratitude to the Guggenheim Foundation for partial support. The experiment is supported in part by the U.S. Department of Energy, the U.S. National Science Foundation, the German Bundesminister für Bildung und Forschung, the Russian Ministry of Science, and the US-Japan Agreement in High Energy Physics.
References
- [1] Muon E821 Collaboration: G.W. Bennett, B. Bousquet, H.N. Brown, G. Bunce, R.M. Carey, P. Cushman, G.T. Danby, P.T. Debevec, M. Deile, H. Deng, W. Deninger, S.K. Dhawan, V.P. Druzhinin, L. Duong, E. Efstathiadis, F.J.M. Farley, G.V. Fedotovich, S. Giron, F.E. Gray, D. Grigoriev, M. Grosse-Perdekamp, A. Grossmann, M.F. Hare, D.W. Hertzog, X. Huang, V.W. Hughes M. Iwasaki, K. Jungmann, D. Kawall, M. Kawamura, B.I. Khazin, J. Kindem, F. Krienen, I. Kronkvist, A. Lam, R. Larsen, Y.Y. Lee, I. Logashenko, R. McNabb, W. Meng, J. Mi, J.P. Miller, Y. Mizumachi, W.M. Morse, D. Nikas, C.J.G. Onderwater, Y. Orlov, C.S. Özben, J.M. Paley, Q. Peng, C.C. Polly, J. Pretz, R. Prigl, G. zu Putlitz, T. Qian, S.I. Redin, O. Rind, B.L. Roberts, N. Ryskulov, S. Sedykh, Y.K. Semertzidis, P. Shagin, Yu.M. Shatunov, E.P. Sichtermann, E. Solodov, M. Sossong, A. Steinmetz L.R. Sulak, C. Timmermans, A. Trofimov, D. Urner, P. von Walter, D. Warburton, D. Winn, A. Yamamoto and D. Zimmerman.
- [2] J. Bailey et al., Nucl. Phys. B150, 1 (1979).
- [3] The Collaboration: R.M. Carey et al., Phys. Rev. Lett. 82, 1132 (1999).
- [4] The Collaboration: H.N. Brown et al., Phys. Rev. D62, 091101 (2000).
- [5] The Collaboration: H.N. Brown et al., Phys. Rev. Lett. 86, 2227 (2001).
- [6] The Collaboration: G.W. Bennett et al., Phys. Rev. Lett. 89 (2002) 101804; Erratum-ibid. 89 (2002) 129903.
- [7] The Collaboration: G.W. Bennett et al., Phys. Rev. Lett. 92 (2004) 161802.
- [8] D.W. Hertzog and W.M. Morse, Annu. Rev. Nucl. Part. Sci. 54 141 (2004).
- [9] M. Davier and W. Marciano, Annu. Rev. Nucl. Part. Sci. 54 115 (2004).
- [10] A. Aloisio, et al., (KLOE Collaboration) hep-ex/0407048, July 2004, and Phys. Lett. B, in press.
- [11] T. Kinoshita and M. Nio, Phys.Rev.Lett.90:021803,2003, and T. Kinoshita and M. Nio, Phys. Rev. D70, 113001 (2004).
- [12] M. Davier, this Workshop, including the new KLOE radiative return data, but not the hadronic tau decay results. K. Hagiwara presented a similar number at this Workshop but did not yet include the KLOE results, see K. Hagiwara, A.D. Martin, D. Nomura, and T. Teubner, Phys. Lett. B557, 69 (2003), and Phys. Rev. D69 093003 (2004).
- [13] M. Davier, S. Eidelman, A. Höcker, and Z. Zhang, Eur. Phys. J. C 31, 503 (2003).
- [14] J. Bijnens, E. Pallante and J. Prades, Nucl. Phys. B474, 379 (1996) and Nucl. Phys. B626, 410 (2002); M. Hayakawa and T. Kinoshita, Phys. Rev. D57, 465(1998) and hep-ph/0112102 (2002); M. Knecht, A. Nyffeler, Phys. Rev. D65, 073034 (2002); M. Knecht, A. Nyffeler, M. Perrottet, E. De Rafael, Phys. Rev. Lett. 88, 071802 (2002); I. Blokland, A. Czarnecki and K. Melinkov, Phys. Rev. Lett. 88, 071803 (2002); K. Melnikov and A. Vainshtein, Phys. Rev. D70, 113006 (2004). We use the recommended value in Ref. [9].
- [15] G.T. Danby, et al., Nucl. Instr. and Methods Phys. Res. A 457, 151-174 (2001).
- [16] Y.K. Semertzidis, Nucl. Instrum. Methods Phys. Res. A503 458-484 (2003).
- [17] E. Efstathiadis, et al., Nucl. Inst. and Methods Phys. Res. A496 ,8-25 (2002).
- [18] R. Prigl, et al., Nucl. Inst. Methods Phys. Res. A374 118 (1996); X. Fei, V. Hughes and R. Prigl, Nucl. Inst. Methods Phys. Res. A394, 349 (1997).
- [19] W. Liu et al., Phys. Rev. Lett. 82, 711 (1999).
- [20] A Experiment to ppm Precision R.M. Carey, A. Gafarov, I. Logashenko, K.R. Lynch, J.P. Miller, B.L. Roberts (co-spokesperson), G. Bunce, W. Meng, W.M. Morse (resident spokesperson), Y.K. Semertzidis, D. Grigoriev, B.I. Khazin, S.I. Redin, Yuri M. Shatunov, E. Solodov, Y. Orlov, P. Debevec, D.W. Hertzog (co-spokesperson), P. Kammel, R. McNabb, F. Mülhauser, K.L. Giovanetti, K.P. Jungmann, C.J.G. Onderwater, S. Dhamija, T.P. Gorringe, W. Korsch, F.E. Gray, B. Lauss, E.P. Sichtermann, P. Cushman, T. Qian, P. Shagin, S. Dhawan and F.J.M. Farley.
- [21] F. Krienen, D. Loomba and W. Meng, Nucl. Inst. and Meth. A 283, 5 (1989); A. Yamamoto, et al., Nucl. Instrum. and Methods Phys. Res. A491 23-40 (2002).
- [22] S.A. Sedykh et al., Nucl. Inst. Methods Phys. Res. A455 346 (2000).