Branching Fraction, Polarization and -Violating Asymmetries
in Decays
H. Miyake
M. Hazumi
K. Abe
K. Abe
H. Aihara
Y. Asano
V. Aulchenko
T. Aushev
T. Aziz
S. Bahinipati
A. M. Bakich
V. Balagura
Y. Ban
S. Banerjee
A. Bay
I. Bedny
U. Bitenc
I. Bizjak
S. Blyth
A. Bondar
A. Bozek
M. Bračko
J. Brodzicka
T. E. Browder
Y. Chao
A. Chen
K.-F. Chen
B. G. Cheon
R. Chistov
S.-K. Choi
Y. Choi
Y. K. Choi
A. Chuvikov
J. Dalseno
M. Danilov
M. Dash
L. Y. Dong
J. Dragic
A. Drutskoy
S. Eidelman
V. Eiges
Y. Enari
S. Fratina
N. Gabyshev
A. Garmash
T. Gershon
G. Gokhroo
B. Golob
J. Haba
K. Hara
T. Hara
N. C. Hastings
K. Hayasaka
H. Hayashii
L. Hinz
T. Hokuue
Y. Hoshi
S. Hou
W.-S. Hou
T. Iijima
A. Imoto
K. Inami
A. Ishikawa
R. Itoh
M. Iwasaki
Y. Iwasaki
J. H. Kang
J. S. Kang
P. Kapusta
S. U. Kataoka
N. Katayama
H. Kawai
T. Kawasaki
H. R. Khan
H. Kichimi
H. J. Kim
J. H. Kim
S. K. Kim
S. M. Kim
K. Kinoshita
P. Koppenburg
S. Korpar
P. Križan
P. Krokovny
R. Kulasiri
C. C. Kuo
A. Kuzmin
Y.-J. Kwon
G. Leder
S. E. Lee
T. Lesiak
J. Li
S.-W. Lin
D. Liventsev
G. Majumder
F. Mandl
T. Matsumoto
A. Matyja
W. Mitaroff
K. Miyabayashi
H. Miyata
R. Mizuk
D. Mohapatra
T. Mori
T. Nagamine
Y. Nagasaka
E. Nakano
M. Nakao
H. Nakazawa
Z. Natkaniec
S. Nishida
O. Nitoh
S. Ogawa
T. Ohshima
T. Okabe
S. Okuno
S. L. Olsen
W. Ostrowicz
H. Ozaki
P. Pakhlov
H. Palka
H. Park
N. Parslow
L. S. Peak
R. Pestotnik
L. E. Piilonen
M. Rozanska
H. Sagawa
Y. Sakai
N. Sato
T. Schietinger
O. Schneider
P. Schönmeier
J. Schümann
C. Schwanda
A. J. Schwartz
K. Senyo
R. Seuster
M. E. Sevior
H. Shibuya
J. B. Singh
A. Somov
N. Soni
R. Stamen
S. Stanič
M. Starič
T. Sumiyoshi
S. Suzuki
S. Y. Suzuki
O. Tajima
F. Takasaki
K. Tamai
N. Tamura
M. Tanaka
Y. Teramoto
X. C. Tian
K. Trabelsi
T. Tsukamoto
S. Uehara
K. Ueno
T. Uglov
S. Uno
Y. Ushiroda
G. Varner
K. E. Varvell
S. Villa
C. C. Wang
C. H. Wang
M.-Z. Wang
M. Watanabe
Y. Watanabe
A. Yamaguchi
H. Yamamoto
T. Yamanaka
Y. Yamashita
M. Yamauchi
J. Ying
Y. Yusa
J. Zhang
L. M. Zhang
Z. P. Zhang
V. Zhilich
D. Žontar
Budker Institute of Nuclear Physics, Novosibirsk, Russia
Chiba University, Chiba, Japan
Chonnam National University, Kwangju, South Korea
University of Cincinnati, Cincinnati, OH, USA
Gyeongsang National University, Chinju, South Korea
University of Hawaii, Honolulu, HI, USA
High Energy Accelerator Research Organization (KEK), Tsukuba, Japan
Hiroshima Institute of Technology, Hiroshima, Japan
Institute of High Energy Physics, Chinese Academy of Sciences, Beijing, PR China
Institute of High Energy Physics, Vienna, Austria
Institute for Theoretical and Experimental Physics, Moscow, Russia
J. Stefan Institute, Ljubljana, Slovenia
Kanagawa University, Yokohama, Japan
Korea University, Seoul, South Korea
Kyungpook National University, Taegu, South Korea
Swiss Federal Institute of Technology of Lausanne, EPFL, Lausanne, Switzerland
University of Ljubljana, Ljubljana, Slovenia
University of Maribor, Maribor, Slovenia
University of Melbourne, Victoria, Australia
Nagoya University, Nagoya, Japan
Nara Women’s University, Nara, Japan
National Central University, Chung-li, Taiwan
National United University, Miao Li, Taiwan
Department of Physics, National Taiwan University, Taipei, Taiwan
H. Niewodniczanski Institute of Nuclear Physics, Krakow, Poland
Nihon Dental College, Niigata, Japan
Niigata University, Niigata, Japan
Osaka City University, Osaka, Japan
Osaka University, Osaka, Japan
Panjab University, Chandigarh, India
Peking University, Beijing, PR China
Princeton University, Princeton, NJ, USA
Saga University, Saga, Japan
University of Science and Technology of China, Hefei, PR China
Seoul National University, Seoul, South Korea
Sungkyunkwan University, Suwon, South Korea
University of Sydney, Sydney, NSW, Australia
Tata Institute of Fundamental Research, Bombay, India
Toho University, Funabashi, Japan
Tohoku Gakuin University, Tagajo, Japan
Tohoku University, Sendai, Japan
Department of Physics, University of Tokyo, Tokyo, Japan
Tokyo Institute of Technology, Tokyo, Japan
Tokyo Metropolitan University, Tokyo, Japan
Tokyo University of Agriculture and Technology, Tokyo, Japan
University of Tsukuba, Tsukuba, Japan
Virginia Polytechnic Institute and State University, Blacksburg, VA, USA
Yonsei University, Seoul, South Korea
Abstract
We present measurements of the branching fraction,
the polarization parameters
and -violating asymmetries in decays
using a 140 fb-1 data sample collected at the
resonance with the Belle detector at
the KEKB energy-asymmetric collider.
We obtain
and
Consistency with Standard Model expectations is also discussed.
††thanks: on leave from Nova Gorica Polytechnic, Nova Gorica, Slovenia
1 Introduction
In the Standard Model (SM),
violation arises from an irreducible complex phase,
the Kobayashi-Maskawa (KM) phase [1],
in the weak-interaction quark-mixing matrix.
In particular, the SM predicts asymmetries in
the time-dependent rates for and
decays to a common eigenstate [2].
Recent measurements of the -violation parameter
by the Belle [3, 4]
and BaBar [5] collaborations established violation
in and related decay modes [6],
which are governed by the transition,
at a level consistent with KM expectations.
Here is one of the three interior angles of
the Unitarity Triangle [3, 4].
Despite this success, many tests remain before it can be concluded
that the KM phase is the only source of violation.
The decay, which is dominated by the transition,
provides an additional test of the SM.
Within the SM,
measurements of violation in this mode
should yield the value to a good approximation
if the contribution from the penguin diagram is neglected.
The correction from the penguin diagram is expected to
be small [7].
Thus, a significant deviation in the time-dependent asymmetry in these
modes from what is observed
in decays would be evidence for a new -violating phase.
In the decay chain ,
where one of the mesons decays at time to a final state
and the other decays at time to a final state
that distinguishes between and ,
the decay rate has a time dependence
given by [2]
(1)
Here and are -violation parameters,
is the lifetime, is the mass difference
between the two mass
eigenstates, = , and
= +1 () when the tagging meson
is a
().
The parameter
corresponds to the mixing-induced violation and is
related to , while represents direct violation that
normally arises from the interference between tree and penguin diagrams.
In decays the final state
mesons may be in a state of -, - or -wave relative
orbital angular momentum.
Since - and -waves are even under the transformation
while the -wave is odd,
the -violation parameters in Eq. (1) are diluted.
In order to determine the dilution, one needs to measure
the -odd fraction. This can be accomplished
with a time-integrated angular analysis.
The BaBar collaboration has measured the polarization and
asymmetries [8],
and find the -odd contribution to be small,
consistent with theoretical expectations [7].
The asymmetries are found to differ slightly from the expectation
that neglects the contribution from the penguin diagram.
In this Letter we report measurements of
the branching fraction, the polarization parameters and asymmetries
in decays
based on a 140 fb-1 data sample,
which corresponds to 152 million pairs.
At the KEKB energy-asymmetric
(3.5 on 8.0 GeV) collider [9],
the is produced
with a Lorentz boost of
antiparallel to the positron beamline ().
Since the and mesons are approximately at
rest in the center-of-mass system (cms),
can be determined from the displacement in
between the and decay vertices:
.
The Belle detector [10] is a large-solid-angle spectrometer
that includes a three-layer silicon vertex detector (SVD),
a 50-layer central drift chamber (CDC),
an array of aerogel threshold Cherenkov counters (ACC),
time-of-flight (TOF) scintillation counters,
and an electromagnetic calorimeter comprised of CsI(Tl) crystals (ECL)
located inside a superconducting solenoid coil
that provides a 1.5 T magnetic field.
An iron flux-return located outside of the coil is instrumented
with resistive plate chambers to detect mesons and
to identify muons (KLM).
2 Event Selection
We reconstruct decays in the following final states;
,
and
.
For the decays we use
, , , ,
and .
For the decays we use
, , ,
and .
We allow all combinations of decays except
for cases where both decays include
neutral kaons in the final state.
Charged tracks from meson decays are required to be
consistent with originating from
the interaction point (IP).
Charged kaons are separated from pions according to
the likelihood ratio ,
where the likelihood function is
based on the combined information from
the ACC, CDC and TOF measurements.
We require for kaons in
2-prong (4-prong) meson decays.
The kaon identification efficiency is , and of pions are
misidentified as kaons.
Candidate charged pions are required to satisfy ,
which provides a pion selection efficiency of with a kaon
misidentification probability of .
Neutral pions are formed from two photons with
invariant masses above 119 MeV/ and below 146 MeV/.
To reduce the background from low-energy photons,
we require GeV for each photon
and GeV/,
where and are the photon energy and
the momentum in the laboratory frame, respectively.
Candidate decays are reconstructed
from oppositely charged track pairs that have invariant
masses within 15 MeV/ of the nominal mass.
A reconstructed is required to have a displaced vertex and a
flight direction consistent with that of a originating from
the IP.
Candidate mesons are reconstructed from
the selected kaons and pions,
and are required to have invariant masses
within 6 (3) of the meson mass
for 2-prong (3- or 4-prong) decays, where is the mass resolution
that ranges from to MeV/.
In this selection is obtained by fitting
the Monte Carlo (MC) simulated meson mass.
These () candidates are then combined with
() to form candidates, where
the IP and pion identification requirements are not used
to select candidates.
The mass difference between and () is required to
be within 3.00 (2.25) MeV/ of the nominal mass difference.
We identify meson decays using the
energy difference and
the beam-energy constrained mass , where is
the beam energy in the cms, and
and are the cms energy and momentum,
respectively, of the reconstructed candidate.
The meson signal region is defined as
GeV and within 3 of the meson mass,
where is MeV/.
In order to suppress background from the , or
continuum, we require , where () is the
second (zeroth) Fox-Wolfram moment [11].
After applying this requirement, we find that the contributions
to the background from , and continuum are
approximately equal.
Figure 1 shows the and distributions for the
candidates that are in the and signal regions,
respectively.
Figure 1: (Left) and (right) distributions for
candidates within the () signal region.
Solid curves show the fit to signal plus background distributions,
and dashed curves show the background contributions that comprise
, and continuum events.
In the and signal regions there are 194 events.
3 Branching Fraction
To determine the signal yield, we perform a two-dimensional
maximum likelihood fit to the - distribution
( GeV/ GeV/ and GeV).
We use a Gaussian signal distribution plus the ARGUS
background function [12] for the distribution.
The signal shape parameters are determined from MC.
The background parameters
are obtained simultaneously in the fit to data.
The distribution is modeled by
a double Gaussian signal function plus a linear background function.
We obtain shape parameters separately for candidates
with and without decays
to account for small differences between the two cases.
The fit yields signal events, where
20% include decays.
To obtain the branching fraction ,
we use the reconstruction efficiency and
the known branching fraction for each subdecay mode.
We obtain an effective efficiency of from
the sum of the products of MC reconstruction efficiencies
and branching fractions for each of the subdecays.
Small corrections are applied to the
reconstruction efficiencies for charged tracks, neutral pions and
mesons to account for differences between data and MC.
We obtain
(2)
where the first error is statistical and the second is systematic.
The result is consistent with the present world-average
value [13].
The dominant sources of the systematic error are
uncertainties in the tracking efficiency (11%) and
in the subdecay branching fractions (7%).
Other sources are uncertainties
in the fit parameters and methods (1%),
in the reconstruction efficiencies of and ,
particle identification , polarization parameters ,
the number of mesons , and MC statistics ,
where each value in parentheses is the total contribution.
4 Polarization
The time-dependent analysis requires knowledge of the -odd fraction.
To obtain the -odd fraction without bias,
we must take into account the efficiency difference between the two
-even components. Therefore, we perform a time-integrated
two-dimensional angular analysis to obtain the fraction of each
polarization component.
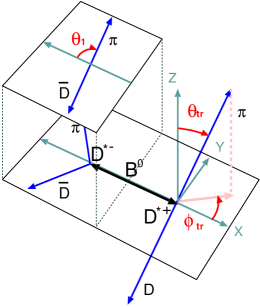
We use the transversity basis [14]
where three
angles , and are defined in Fig. 2.
The angle is the angle between the momentum of the slow pion
from the in the rest frame and the direction
opposite to momentum in the rest frame.
The angle is the polar angle between the
normal to the decay plane and the direction of flight
of the slow pion from the in the rest frame.
The angle is the corresponding azimuthal angle,
where is the direction antiparallel to the flight direction.
Figure 2: Definition of the angles in the transversity basis.
Angle and are defined in the rest frame
(the lower plane),
while is defined in the rest frame (the upper plane).
Integrating over time and the angle , the
two-dimensional differential decay rate is
(3)
where or denotes longitudinal, transverse parallel,
or transverse perpendicular components, is its fraction
that satisfies
(4)
and is its angular distribution defined as
(5)
The fraction corresponds to the -odd fraction.
Eq. (3) is affected by the detector
efficiency, in particular due to the correlations
between transversity angles and slow pion detection efficiencies.
To take these effects into account,
we replace with distributions of
reconstructed MC events ,
which are prepared separately for candidates
with and without decays
as is done in the branching fraction measurement.
We also introduce effective polarization parameters
,
where is a total reconstruction efficiency
for each transversity amplitude.
As a result, the signal probability density function (PDF)
for the fit is defined as
(6)
We determine the following likelihood value for each event:
(7)
where is the signal probability calculated on an
event-by-event basis as a function of and .
The background PDF is determined from
the sideband region ( GeV/ GeV/,
GeV).
A fit that maximizes the product of the likelihood values
over all events yields
(8)
Figure 3 shows the angular distributions with the results of
the fit.
We study the uncertainties of the following items
to determine the systematic errors:
background shape parameters, angular resolutions, and slow pion
detection efficiencies. Also included are a possible
fit bias, MC histogram bin size dependence
and misreconstruction effects.
These systematic errors are much smaller than the statistical errors.
Figure 3: Angular distributions of the candidates
in (left) and (right) projections.
In each figure,
the dot-dashed, dotted and dashed lines correspond to
longitudinal, transverse parallel and transverse perpendicular polarization
components, respectively.
The thin solid line is the background, and
the thick solid line shows the sum of all contributions.
The asymmetry in the distribution is due to the
inefficiency for low momentum track reconstruction.
5 Asymmetries
We perform an unbinned maximum likelihood fit to the
three dimensional ,
and distributions for candidates
to measure the -violation parameters.
The meson decay vertices are reconstructed
using the meson trajectory and an IP constraint.
We do not use slow pions from decays.
We require that at least one meson has two or more daughter
tracks with a sufficient number of the SVD hits
to precisely measure the meson trajectory.
The vertex determination is the same as for other
-violation measurements [4].
The -flavor of the accompanying meson is identified
from inclusive properties of particles
that are not associated with the reconstructed
decay [3].
We use two parameters, and , to represent the flavor tagging
information.
The first, , is already defined in Eq. (1).
The parameter is an event-by-event,
MC-determined flavor-tagging dilution factor
that ranges from for no flavor
discrimination to for unambiguous flavor assignment.
This assignment is used only to sort data into six intervals.
The wrong tag fractions for the six intervals,
, and differences
between and decays, ,
are determined from the data;
we use the same values
that were used for the measurement [4].
The signal PDF is given by
(9)
where parity is for and , and
for .
We assume universal -violation parameters
in Eq. (9), i.e.
and .
The distribution is convolved with the
proper-time interval resolution function
[4],
which takes into account the finite vertex resolution.
We determine the following likelihood value for the -th event:
(10)
where is a broad Gaussian function that represents
an outlier component [3] with a small fraction .
The calculation is explained in the previous section.
The PDF for background events, ,
is expressed as a sum of exponential and prompt components, and
is convolved with that is a sum of two Gaussians.
All parameters in
and are determined by a fit to the distribution of a
background-enhanced control sample;
i.e. events outside of the - signal region.
We fix and to
their world-average values [13].
The only free parameters in the final fit
are and , which are determined by maximizing the
likelihood function
,
where the product is over all events.
The fit yields
(11)
where the first errors are statistical and the second errors
are systematic.
These results are consistent with the SM expectations
for small penguin contributions.
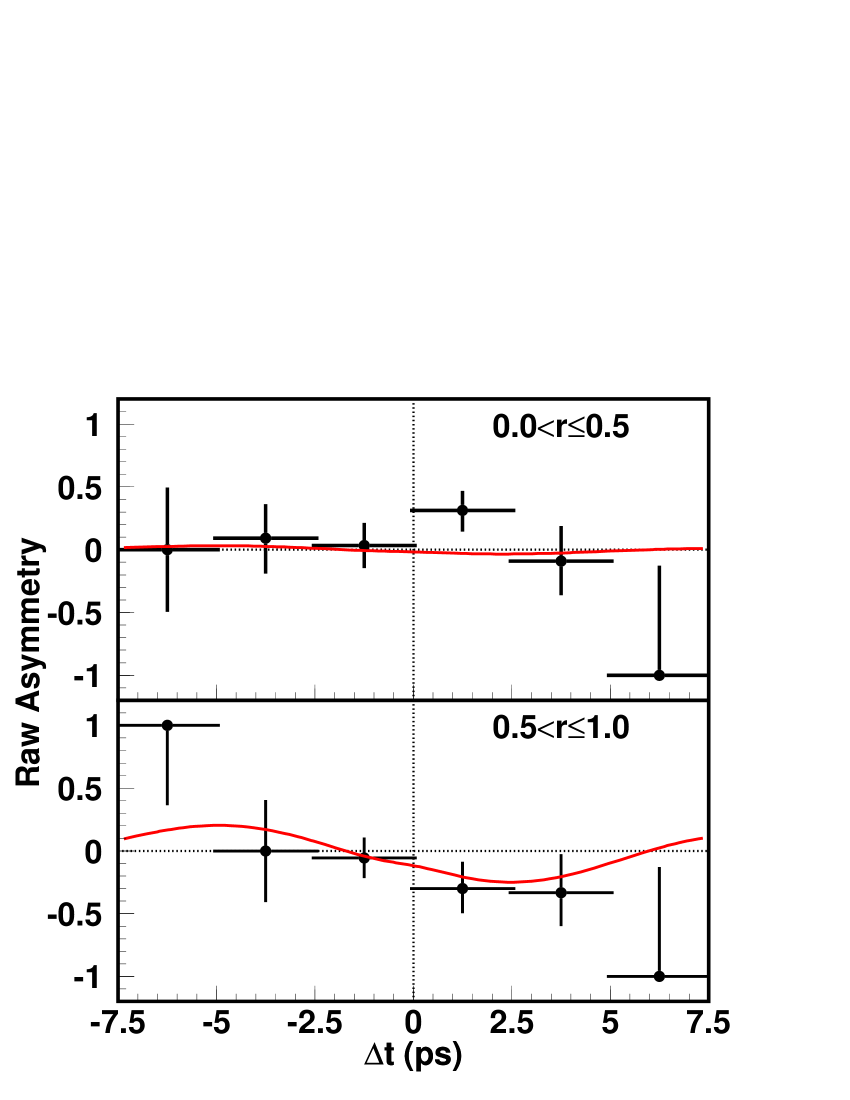
We define the raw asymmetry in each bin by
,
where is the number of observed candidates with .
Figure 4:
Raw asymmetry in bins of for (top)
and (bottom).
The solid curves show the result of the unbinned maximum-likelihood fit.
Figure 4 shows the raw asymmetries in two regions of
the flavor-tagging parameter .
While the numbers of events in the two regions are similar,
the effective tagging efficiency is much larger
and the background dilution is smaller in the region .
Note that these projections onto the axis do not take into
account event-by-event information (such as the signal fraction, the
wrong tag fraction and the vertex resolution), which are used in the
unbinned maximum-likelihood fit.
The sources of the systematic errors include
uncertainties in the vertex reconstruction
(0.05 for and 0.03 for ),
in the flavor tagging
(0.04 for and 0.02 for ),
in the resolution function
(0.05 for and 0.01 for ),
in the background fractions
(0.04 for and 0.02 for ),
in the tag-side interference [4]
(0.01 for and 0.03 for ),
and
in the polarization parameters
(0.06 for and 0.01 for ).
Other contributions for come from
a possible fit bias (0.04) and
from uncertainties in and (0.02).
We add each contribution in quadrature to obtain the total systematic
uncertainty.
We perform various cross checks.
A fit to the same sample with
fixed at zero yields (stat).
We check with an ensemble of MC pseudo-experiments
that the fit has no sizable bias and the expected statistical
errors are consistent with the measurement.
We also select the following decay modes that
have similar properties to the decay:
, ,
, , and
, ,
and .
Fits to the control samples yield
,
,
, and
, where
errors are statistical only.
All results are consistent with zero.
We also measure the meson lifetime
using candidates as well as
the control samples.
All results are consistent with the present world-average values.
A fit to the distribution of the without using
polarization angle information yields
,
;
this result suggests that the -odd component is small,
supporting our polarization measurement.
Although the statistics are not sufficient to provide tight constraints,
we also consider polarization-dependent values for and ,
which may arise from possible differences in
the contributions of the penguin diagrams.
We assume that the asymmetries for the -odd component
are consistent with the SM expectations, and fix
at the world-average value of [13]
and at zero.
A fit with this assumption yields
and
for the -even component, also consistent with the SM expectations.
6 Conclusion
In summary, we have performed measurements of
the branching fraction, the polarization parameters and the
-violation parameters for decays.
The results are
(12)
The polarization parameters and -violation parameters
are consistent with the SM expectations
and theoretical predictions for small penguin
contributions [15].
Acknowledgments
We thank the KEKB group for the excellent
operation of the accelerator, the KEK Cryogenics
group for the efficient operation of the solenoid,
and the KEK computer group and the NII for valuable computing and
Super-SINET network support. We acknowledge support from
MEXT and JSPS (Japan); ARC and DEST (Australia); NSFC (contract
No. 10175071, China); DST (India); the BK21 program of MOEHRD and the
CHEP SRC program of KOSEF (Korea); KBN (contract No. 2P03B 01324,
Poland); MIST (Russia); MESS (Slovenia); NSC and MOE (Taiwan); and DOE
(USA).
References
[1]
M. Kobayashi and T. Maskawa, Prog. Theor. Phys. 49, 652 (1973).
[2]
A. B. Carter and A. I. Sanda, Phys. Rev. D 23, 1567 (1981);
I. I. Bigi and A. I. Sanda, Nucl. Phys. B193, 85 (1981).
[3]
Belle Collaboration, K. Abe et al., Phys. Rev. Lett. 87, 091802 (2001);
Phys. Rev. D 66, 032007 (2002);
Phys. Rev. D 66, 071102 (2002).
[4]
Belle Collaboration, K. Abe et al., hep-ex/0408111.
[5]
BaBar Collaboration, B. Aubert et al., Phys. Rev. Lett. 87, 091801 (2001);
Phys. Rev. D 66, 032003 (2002);
Phys. Rev. Lett. 89, 201802 (2002).
[6]
Throughout this paper,
the inclusion of the charge conjugate decay mode is implied
unless otherwise stated.
[7]
X. Y. Pham and Z. Z. Xing,
Phys. Lett. B 458, 375 (1999).
[8]
BaBar Collaboration, B. Aubert et al.,
Phys. Rev. Lett. 91, 131801 (2003).
[9]
S. Kurokawa and E. Kikutani,
Nucl. Instrum. Methods A 499, 1 (2003).
[10]
Belle Collaboration, A. Abashian et al.,
Nucl. Instrum. Methods A 479, 117 (2002).
[11]
G. C. Fox and S. Wolfram,
Phys. Rev. Lett. 41, 1581 (1978).
[12]
ARGUS Collaboration, H. Albrecht et al.,
Phys. Lett. B 241, 278 (1990).
[13]
Particle Data Group, K. Hagiwara et al., Particle Listings
in the 2003 Review of Particle Physics, http://www-pdg.lbl.gov/2003/contents_listings.html.
[14]
I. Dunietz, H. R. Quinn, A. Snyder, W. Toki and H. J. Lipkin,
Phys. Rev. D 43, 2193 (1991).
[15]
If penguin contributions are small, the theoretical predictions
within the SM are
and , where
is measured in
transitions to be [13].
![[Uncaptioned image]](/html/hep-ex/0501037/assets/x1.png)