HyperCP Collaboration
Evidence for the Decay
Abstract
We report the first evidence for the decay from data taken by the HyperCP (E871) experiment at Fermilab. Based on three observed events, the branching ratio is . The narrow range of dimuon masses may indicate that the decay proceeds via a neutral intermediate state, with a mass of MeV/ and branching ratio .
pacs:
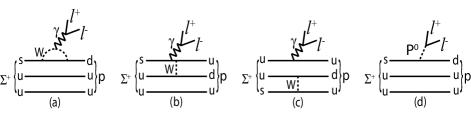
13.30.Ce, 14.20.Jn, 14.80.MzIn the standard model (SM), the decay can be described as proceeding through a flavor-changing neutral-current (FCNC) interaction and by internal conversion, as shown in Fig. 1(a)–(c). Bergström et al. [1] argue that in the SM the FCNC contribution for the decay is not dominant. The decay is of interest since it also allows a direct search for a new scalar or vector particle, which could contribute an transition at the tree level [2] (Fig. 1(d)).
Current literature reports only an upper limit [3]. The decay rate for the process was studied in [1, 4] in the context of the SM. Using the measured partial decay width and the parameter for decay, Bergström et al. [1] find: and . A large violation of these limits would signal new physics.
In this Letter we report the first evidence for the decay, a measurement of the branching ratio for this decay, and possible evidence for a new state observed via , .
The HyperCP experiment was located in the Meson Center beamline at Fermilab. The spectrometer, shown in Fig. 2, is described in detail elsewhere [5]. Charged secondary beams, with mean momenta of about 160 GeV/, were produced by 800 GeV/ protons incident on copper targets and momentum selected by a curved collimator situated in a dipole magnet (hyperon magnet). The sign of the charged secondary beam was periodically changed by reversing the field of the hyperon magnet. We analyzed triggers from the positive-secondary-beam data set and from the negative.
The signature of the decay is two unlike-sign muon tracks and a proton track originating from a common vertex. The transverse-momentum kick of the analyzing magnets was such that muons from this decay were always deflected to opposite sides and outside of the intense secondary beam at the rear of the spectrometer. Hence the signal trigger used to select candidate events required hits in the same-sign and opposite-sign hodoscopes (Left-Right trigger), in coincidence with hits in the vertical and horizontal hodoscopes in each of the muon stations situated on either side of the secondary beam.

The basic selection cuts discussed below were applied to the event candidates. Each event was required to have a track in each muon station and a higher-momentum track (the proton candidate) with the same charge sign as the secondary beam. The total momentum of the three tracks had to be within the range 120 to 240 GeV/. The trajectory had to extrapolate to within 3.5 mm () of the center of the target, where the nominal target position was determined using well-reconstructed decays and the extrapolation resolution was determined from a Monte Carlo (MC) simulation of decays. The decay vertex of the three tracks was calculated by the method of distance of closest approach (DCA), and the -coordinate of the vertex was required to be more than 68 cm downstream of the entrance of the vacuum decay region and more than 32 cm upstream of its exit. The average distance between pairs of tracks in the – plane at was required to be less than 0.25 mm. The hits in the multiwire proportional chambers upstream of the analyzing magnets were refit with a constraint that they share a common vertex. The resulting was required to be less than 1.5.
After imposition of the above cuts, three candidate events were observed in the positive-secondary-beam data with masses () within (1 MeV/) of the mass, as shown in Fig. 3(a) and (b). No other events were found within MeV/ of the mass.
The signal events were verified by applying two additional cuts that removed almost all of the higher-mass background events without affecting the three signal events. The first cut required that the ratio of the proton momentum to the summed three-track momentum be larger than 0.68, as MC simulations showed that this cut preserved 100% of the signal while removing most of the decay background. The second cut removed events whose mass was within MeV/ () of the mass when calculated using the decay hypothesis to reject decays. The resulting invariant mass distribution is shown in Fig 3(c).

Possible background sources were extensively studied, using both MC and data. Typically 100 times as many MC events as would be expected for each potential background source were generated.
Other positively-charged hyperon decays, and , were not significant backgrounds as decays in flight of the daughter or would produce muons of only one polarity, and the probability of misidentifying the sign of the charge of any of the decay daughters was negligibly small. Contributions from charged kaon decays such as , , , and were estimated using MC simulations allowing in-flight decay of pions, and found to be negligible. Muon pair production by photon conversion in material inside the vacuum decay region was studied using MC simulation for , , , and decays. Such sources of background were also found to be negligible.
In addition, we used real data to investigate possible backgrounds otherwise missed, including the unlike-sign dimuon sample from the negative-secondary-beam data, as well as a sample of events (single-muon sample) for which only one muon track was required in either the left or right muon station. For the single-muon sample both the positive- and negative-secondary-beam data were included, and the non-muon track was required to be within the fiducial volume of the appropriate muon station. For the positive-secondary-beam data, the single-muon sample was one order of magnitude larger than the unlike-sign dimuon sample. These background studies showed that after cuts none of these sources contributed in the invariant-mass region below 1200 MeV/. Finally, we relaxed each cut to increase the background level shown in Fig. 3(c) by an order of magnitude. However, there still were no background events within 8 MeV/ of the mass.
Figure 4(a) compares the dimuon mass distribution of the three signal candidates with that expected in the SM with the form-factors described below. The reconstructed dimuon masses for the three candidates, 214.7, 214.3, and 213.7 MeV/, all lie within the expected dimuon mass resolution of MeV/. The dimuon mass distribution for decays is expected to be broad unless the form factor has a pole in the kinematically allowed range of dimuon mass.
The expected SM distribution was used to estimate the probability that the dimuon masses of the three signal candidates be within 1 MeV/ of each other anywhere within the kinematically allowed range. The probability is 0.8% for the form-factor decay model and 0.7% for the uniform phase-space decay model. The unexpectedly narrow dimuon mass distribution suggests a two-body decay, (), where is an unknown particle with mass MeV/. The dimuon mass distribution for the three signal candidates is compared with MC decays in Fig. 4(b), and good agreement is found. Distributions of hit positions and momenta of the proton, , and of the three candidate events were compared with MC distributions, and were found to be consistent with both decay hypotheses.
To extract the branching ratio, the () decay was used as the normalization mode, where the was not detected. (HyperCP had no detectors.) The trigger for the events was the Left-Right trigger prescaled by 100. The proton and two unlike-sign electrons were required to come from a single vertex, as were the three tracks of the signal mode.
The proton was selected to be the positively-charged track with the greatest momentum, and the event was discarded if the proton candidate did not have at least 66% of the total three-track momentum, as determined by a MC simulation of decays. The reconstructed mass for the hypothesis was required to be outside MeV/ of the mass.

The cuts on , DCA, and the total momentum were the same as for the signal mode. However, the decay vertex had to be more than 168 cm downstream of the entrance of the vacuum decay region and more than 32 cm upstream of its exit. Since the momentum was not measured, the and positions of the trajectory at the target were determined using only the three charged tracks, and those positions had to be consistent with that expected from a MC simulation of decays.
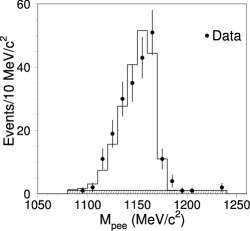
To significantly reduce contamination from photon-conversion events, the dielectron mass was required to be between 50 and 100 MeV/. After application of the above selection criteria, a total of 211 events remained, as shown in Fig. 5. We performed a binned maximum-likelihood fit for the mass distributions for data and three MC samples: decays, , () decays, and uniform background. From the fit, the number of observed decays was events, where the uncertainty is statistical. To extract the total number of normalization events, values of % and % were used respectively for the and branching ratios [6].
The kinematic parameters for production at the target were tuned to match the data and MC momentum distributions. The MC decays were generated using the decay model in Ref. [7] for () decays, and the electromagnetic form-factor parameter was taken from Ref. [6]. After tuning of the parameters, comparisons of the distributions of the MC events with the data for decays, the decay vertex positions, momentum spectra, reconstructed mass, hit positions of each charged particle, etc., showed good agreement.
In the simulation of the decays, we used the form-factor model of Bergström et al. [1], although we found little difference between results using it and
| Mode | () | () |
|---|---|---|
| decays | 0.259 | 71.2 |
| decays | 0.731 | 69.4 |
| Normalization | 0.255 | 5.6 |
a uniform phase-space decay model. The form-factor model uses the SM processes (FCNC and internal conversion) shown in Fig. 1(a)–(c). In the model depends on three parameters: , and . Using the Particle Data Group values of the partial decay width and the decay parameter of the decay, we determined . The other two parameters were chosen to make the branching ratio as small as possible so that it is consistent with the experimental upper limit, [3, 6]. This gives and , and a branching ratio .
In the simulation of the decay, we assumed that the mass was 214.3 MeV/ with negligible decay width, and that the decayed immediately to the dimuon pair. The matrix element for the decay was taken to be uniform.
MC simulations were used to estimate the geometric acceptances and the event-selection efficiencies for the signal and normalization modes. Table 1 shows a summary of the results. The relative trigger efficiency for the signal mode with respect to the normalization mode and the unlike-sign dimuon detection efficiency were determined from the full data sample, and were found to be and , respectively.
The systematic errors in the measurement of the branching ratios are listed in Table 2. They were studied by varying the ranges of the kinematic parameters in the modeling of the production at the target, the assumed target positions, the magnetic fields, and the parameters describing the and decays in the MC simulations. The systematic errors were dominated by uncertainties in the modeling of the production, which was mainly due to the small normalization sample. The systematic error includes the statistical error from the normalization mode.
The branching ratio for the decay hypothesis is , in apparent disagreement with the expected branching ratio using the form-factor parameters given above, , where the error includes only the uncertainty in the parameter . The branching ratio for the hypothesis is . The statistical errors for the branching ratio measurements were estimated by using the statistical table in Ref. [8]. If the three signal events are assumed to be background events from some unknown source, then using the method in Ref. [9]
| (%) | ||
|---|---|---|
| Source | ||
| Normalization | 14.7 | 14.7 |
| Modeling of production | 54.3 | 44.6 |
| Beam targeting | 11.1 | 8.7 |
| Magnetic field | 2.2 | 3.9 |
| Trigger efficiency | 1.5 | 1.5 |
| Muon identification | 0.3 | 0.3 |
| form factor | 28.9 | |
| form factor | 1.8 | 1.8 |
| 0.6 | 0.6 | |
| 2.7 | 2.7 | |
| MC statistics | 1.3 | 1.3 |
| Total | 64.4 | 48.1 |
to take the systematic error into account, we obtain an upper limit at 90% C.L. of .
In summary, we observe three clean candidates. This is the first evidence for this decay. The probability that the three events have a dimuon mass within 1 MeV/ of each other in the SM is estimated to be %. The three events are consistent with the decay hypothesis, with a mass of MeV/.
Acknowledgements.
We thank the staffs of Fermilab and the participating institutions for their contributions. We acknowledge many useful discussions with D.S. Gorbunov and P. Singer. This work was supported by the U.S. Department of Energy and the National Science Council of Taiwan, R.O.C. E.C.D. and K.S.N. were partially supported by the Institute for Nuclear and Particle Physics. K.B.L. was partially supported by the Miller Institute.References
- [1] L. Bergström, R. Safadi and P. Singer, Z. Phys. C 37, 281 (1988).
- [2] D. S. Gorbunov and V. A. Rubakov, Phys. Rev. D 64, 054008 (2001).
- [3] G. Ang et al., ZPHY 228, 151 (1969).
- [4] D. Corrigan and N.N. Trofimenkoff, Nucl. Phys. B 40, 98 (1972).
- [5] R. A. Burnstein et al., hep-ex/0405034 (2004).
- [6] S. Eidelman et al. (Particle Data Group), Phys. Lett. B 592, 1 (2004).
- [7] K. O. Mikaelian and J. Smith, Phys. Rev. D 5, 1763 (1972).
- [8] G. J. Feldman and R. D. Cousins, Phys. Rev. D 57, 3873 (1998).
- [9] R. D. Cousins and V. L. Highland, Nucl. Instrum. Methods Phys. Res., Sec. A 320, 331 (1992).