Measurement of the and
processes
at energies of 2.4–4.1 GeV
H. Nakazawa
S. Uehara
K. Abe
K. Abe
H. Aihara
M. Akatsu
Y. Asano
V. Aulchenko
T. Aushev
S. Bahinipati
A. M. Bakich
Y. Ban
S. Banerjee
I. Bedny
U. Bitenc
I. Bizjak
S. Blyth
A. Bondar
A. Bozek
M. Bračko
J. Brodzicka
A. Chen
B. G. Cheon
R. Chistov
Y. Choi
Y. K. Choi
A. Chuvikov
J. Dalseno
M. Danilov
M. Dash
A. Drutskoy
S. Eidelman
Y. Enari
D. Epifanov
S. Fratina
N. Gabyshev
A. Garmash
T. Gershon
G. Gokhroo
K. Hayasaka
H. Hayashii
Y. Hoshi
S. Hou
W.-S. Hou
T. Iijima
A. Imoto
K. Inami
A. Ishikawa
R. Itoh
M. Iwasaki
Y. Iwasaki
J. H. Kang
J. S. Kang
S. U. Kataoka
N. Katayama
H. Kawai
T. Kawasaki
H. R. Khan
H. Kichimi
H. J. Kim
J. H. Kim
S. K. Kim
S. M. Kim
S. Korpar
P. Križan
P. Krokovny
R. Kulasiri
C. C. Kuo
A. Kuzmin
Y.-J. Kwon
G. Leder
S. E. Lee
T. Lesiak
J. Li
S.-W. Lin
D. Liventsev
G. Majumder
F. Mandl
T. Matsumoto
A. Matyja
W. Mitaroff
H. Miyake
H. Miyata
R. Mizuk
D. Mohapatra
T. Mori
T. Nagamine
Y. Nagasaka
E. Nakano
M. Nakao
Z. Natkaniec
S. Nishida
O. Nitoh
T. Nozaki
S. Ogawa
T. Ohshima
T. Okabe
S. Okuno
S. L. Olsen
W. Ostrowicz
P. Pakhlov
H. Palka
C. W. Park
H. Park
N. Parslow
L. S. Peak
R. Pestotnik
L. E. Piilonen
H. Sagawa
Y. Sakai
N. Sato
T. Schietinger
O. Schneider
J. Schümann
K. Senyo
H. Shibuya
B. Shwartz
J. B. Singh
A. Somov
N. Soni
R. Stamen
S. Stanič
M. Starič
K. Sumisawa
T. Sumiyoshi
S. Y. Suzuki
O. Tajima
F. Takasaki
N. Tamura
M. Tanaka
Y. Teramoto
X. C. Tian
T. Tsuboyama
T. Tsukamoto
T. Uglov
S. Uno
G. Varner
S. Villa
C. C. Wang
C. H. Wang
M. Watanabe
Y. Watanabe
B. D. Yabsley
A. Yamaguchi
Y. Yamashita
M. Yamauchi
J. Ying
Y. Yusa
L. M. Zhang
Z. P. Zhang
V. Zhilich
D. Žontar
Aomori University, Aomori, Japan
Budker Institute of Nuclear Physics, Novosibirsk, Russia
Chiba University, Chiba, Japan
Chonnam National University, Kwangju, Republic of Korea
Chuo University, Tokyo, Japan
University of Cincinnati, Cincinnati, OH, USA
University of Frankfurt, Frankfurt, Germany
Gyeongsang National University, Chinju, Republic of Korea
University of Hawaii, Honolulu, HI, USA
High Energy Accelerator Research Organization (KEK), Tsukuba, Japan
Hiroshima Institute of Technology, Hiroshima, Japan
Institute of High Energy Physics, Chinese Academy of Sciences, Beijing, PR China
Institute of High Energy Physics, Vienna, Austria
Institute for Theoretical and Experimental Physics, Moscow, Russia
J. Stefan Institute, Ljubljana, Slovenia
Kanagawa University, Yokohama, Japan
Korea University, Seoul, Republic of Korea
Kyoto University, Kyoto, Japan
Kyungpook National University, Taegu, Republic of Korea
Swiss Federal Institute of Technology of Lausanne, EPFL, Lausanne, Switzerland
University of Ljubljana, Ljubljana, Slovenia
University of Maribor, Maribor, Slovenia
University of Melbourne, Victoria, Australia
Nagoya University, Nagoya, Japan
Nara Women’s University, Nara, Japan
National Central University, Chung-li, Taiwan
National Kaohsiung Normal University, Kaohsiung, Taiwan
National United University, Miao Li, Taiwan
Department of Physics, National Taiwan University, Taipei, Taiwan
H. Niewodniczanski Institute of Nuclear Physics, Krakow, Poland
Nihon Dental College, Niigata, Japan
Niigata University, Niigata, Japan
Osaka City University, Osaka, Japan
Osaka University, Osaka, Japan
Panjab University, Chandigarh, India
Peking University, Beijing, PR China
Princeton University, Princeton, NJ, USA
RIKEN BNL Research Center, Brookhaven, NY, USA
Saga University, Saga, Japan
University of Science and Technology of China, Hefei, PR China
Seoul National University, Seoul, Republic of Korea
Sungkyunkwan University, Suwon, Republic of Korea
University of Sydney, Sydney, NSW, Australia
Tata Institute of Fundamental Research, Bombay, India
Toho University, Funabashi, Japan
Tohoku Gakuin University, Tagajo, Japan
Tohoku University, Sendai, Japan
Department of Physics, University of Tokyo, Tokyo, Japan
Tokyo Institute of Technology, Tokyo, Japan
Tokyo Metropolitan University, Tokyo, Japan
Tokyo University of Agriculture and Technology, Tokyo, Japan
Toyama National College of Maritime Technology, Toyama, Japan
University of Tsukuba, Tsukuba, Japan
Utkal University, Bhubaneswer, India
Virginia Polytechnic Institute and State University, Blacksburg, VA, USA
Yonsei University, Seoul, Republic of Korea
Abstract
We have measured
and
production in two-photon collisions using of data
collected with the Belle detector
at the asymmetric energy collider KEKB.
The cross sections are measured to high precision
in the two-photon center-of-mass energy () range
between and
angular region
.
The cross section ratio
is measured to be
in the range of , where the ratio
is energy independent.
We observe a
behavior of the cross section
in the same range.
Production of and mesons is observed in both
and modes.
††thanks: on leave from Nova Gorica Polytechnic, Nova Gorica, Slovenia
1 Introduction
Exclusive processes with hadronic final states test
various model calculations motivated
by perturbative or non-perturbative QCD.
Two-photon production of exclusive hadronic final states is
particularly attractive due to the absence of strong interactions
in the initial state and the possibility of calculating amplitudes.
The perturbative QCD calculation by Brodsky and Lepage (BL) [1]
is based on factorization of the amplitude into a hard scattering amplitude
for and a single-meson distribution amplitude.
Their prediction gives the dependence on the center-of-mass (c.m.) energy and scattering angle for processes
(1)
where represents a meson and denotes its
electromagnetic form factor.
Vogt [2], based on the perturbative approach, claimed
a need for soft contributions,
as his result for the hard contribution was well below the
experimental cross section obtained by CLEO [3].
Diehl, Kroll and Vogt (DKV)
proposed [4] the soft handbag contribution
to two-photon annihilation into pion or kaon pairs
at large energy and
momentum transfers, in which
the amplitude is expressed
by a hard subprocess
and a form factor describing
the soft transition from to
the meson pair.
DKV, as well as BL, predict
the dependence of
the angular differential cross section,
which is an important test of these approaches.
It is interesting to investigate experimentally an energy scale
where those theoretical predictions become valid.
The recent measurements of and
performed by ALEPH [5]
are consistent, within their errors, with the BL’s prediction of
the energy dependence, but not the normalization.
However, their dataset
is not sufficient to conclusively test the and dependences.
In this report, we measure
and processes
with high precision, and make quantitative comparisons with
QCD predictions.
This analysis is based on an data sample
collected at or near the resonance energy,
accumulated with
the Belle detector [6] located at KEKB [7].
2 KEKB accelerator and Belle detector
KEKB is a colliding beam accelerator of
8 electrons and 3.5 positrons designed to produce
copious meson pairs
to observe CP violation.
The Belle detector, with a solenoidal magnetic field, surrounds
the interaction point and subtends the polar angle range , measured from
the axis, which is aligned opposite the positron beam.
It is described in
detail in Ref. [6]. Briefly, charged track momenta and their decay
points are measured by the central drift chamber (CDC) and silicon vertex
detector (SVD). The hadron identity of these charged tracks is determined
using information from the time-of-flight counters (TOF), the aerogel
threshold Čerenkov counters (ACC), and the specific ionization in the CDC.
Hadron/electron discrimination is performed using the above information as
well as the energy deposition and shower profile in the segmented
CsI(Tl)-crystal electromagnetic calorimeter (ECL). Hadron/muon discrimination
is achieved using information from the neutral-kaon and muon detector (KLM),
which consists of glass resistive plate counters embedded in the solenoid’s
iron flux return.
3 Event selection
The signal events are collected predominantly by a trigger that requires two
charged tracks penetrating through the CDC and TOF, with an opening angle in
the plane (perpendicular to the axis) of at least .
We select signal candidates according to the following criteria. There must
be exactly two oppositely-charged reconstructed tracks satisfying the
following conditions: for the polar
angle of each track; GeV/ for the momentum component
in the plane of each track; cm and cm for the
origin of each track relative to the nominal collision point; and
cm for the two tracks’ origin difference along the
axis, where the origin is defined by the closest approach of the track
to the nominal collision point in the plane.
The event is vetoed if it contains any other reconstructed
charged track with transverse momentum above 0.1 GeV/.
Cosmic rays are suppressed by demanding that the opening angle
between the two tracks satisfy . The signal is
enriched relative to other backgrounds by requiring that the scalar sum of the
momentum of the two tracks be below 6 GeV/, the total energy deposited
in the ECL be below 6 GeV, the magnitude of the net transverse momentum
of the above-selected two charged tracks in the c.m. frame
be below 0.2 GeV/
(this condition is tightened in the next
section), the invariant mass of these two tracks be
below 4.5 GeV/, and that the squared missing mass of the event be above
2 GeV2/.
Here, the two tracks are assumed to be massless particles.
The latter two requirements eliminate radiative Bhabha and
initial state radiation events.
The remaining events
consist of two-photon production of , , ,
, and final states as well as unvetoed
events
according to a Monte Carlo (MC) study [8].
The predicted versus measured range and transverse deviation of hits in the
KLM are used to construct a normalized likelihood that a
track extrapolated from the CDC is a muon rather than a pion or kaon.
Here, we classify an event as arising from if
either track has . Similarly, the TOF, ACC, CDC, and
ECL information is used to construct a normalized likelihood
that a reconstructed track is an electron rather than a hadron. We classify
an event as arising from if either track has
.
For above two separations 93% of signal events survive for both modes
according to the MC study described later.
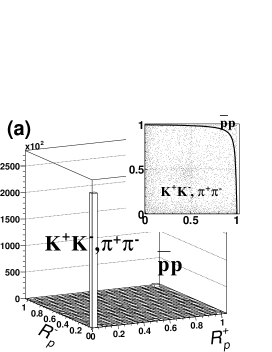
The TOF, ACC and CDC information is used to construct
another normalized likelihood that a reconstructed track is a
proton rather than a kaon, with a high value corresponding to a proton-like
track. The scatterplot of this quantity for the negative track vs.
that
for the positive track in each event is shown in Fig. 1(a).
Note that the peak near the origin contains both and
candidates.
Events above the hyperbolic curve
,
shown in the inset of Fig. 1(a), are deemed to arise from
.
Figure 1:
Two-dimensional plots of
likelihood ratios for hadron identification:
(a) p and
(b) K.
The cut boundaries are shown in the top-view insets.
After removing events that appear to arise from two-photon production of
, , and according to the above criteria, the
remaining sample consists of two-photon production of , ,
and residual , as well as production
where each lepton decays to a single pion or muon. Information from
the TOF, ACC, and CDC is used to form a normalized likelihood ratio
that a reconstructed track is a kaon rather than a pion (or
muon), with a high value corresponding to a kaon-like track. The scatter
plot of this quantity for the negative track vs. that for the positive track
is shown in Fig. 1(b).
Note that the peak near the origin contains
, , and residual events.
Events above the diagonal
line , shown in the inset of Fig. 1(b),
are classified as candidates, while events below the line
are classified as candidates
(including and residual backgrounds).
Events in the diagonal band between these two lines are discarded.
The sample is somewhat contaminated by non-exclusive two-photon
background as well as the
process, in roughly equal proportion.
We note that these
backgrounds appear at high values of the
magnitude of the net transverse momentum in the c.m. frame,
and are often accompanied by photons from the prompt decay of a
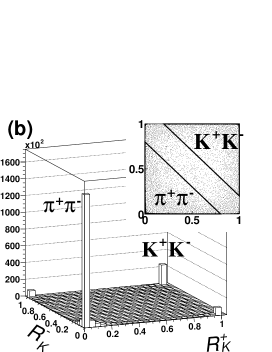
neutral pion in the final state. Therefore, we reject events in the
sample that contain a photon with energy above 400 MeV
(-veto). The
distributions of for the candidates
before and after application of this veto are shown
as the histograms in Fig. 2(a).
The yields of the and events are
expressed as functions of three variables:
derived from the invariant mass of the two mesons,
and .
Eighty-five
20 MeV wide bins in times
six bins in the cosine of the c.m. scattering angle
times twenty bins in net transverse momentum are used
in the ranges
, , and .
4 Background rejection
The spectrum of the residual background within
the sample is obtained from a MC simulation, based
on a full QED calculation [9], with a data
sample corresponding to an integrated luminosity of
that is processed by the full detector simulation program and then subjected
to trigger simulation and the above event selection criteria.
After calibration of the muon identification efficiency to match that
in the data using identified events,
the residual background is scaled
by the integrated luminosity ratio and then subtracted.
The excess in the -vetoed histogram of Fig. 2(a)
above the smooth curve from the signal MC—described in more detail below—is
attributed to
non-exclusive events that are not rejected
by the -veto; most of the events are rejected by this
veto.
A similar excess appears in Fig. 2(b) for the
process. Assuming that this remaining background
is proportional to net transverse momentum, we determine the slope using
the difference between data and MC in the range GeV/
for each 200 MeV wide bin, then
smooth the so-determined slopes by fitting them to a cubic polynomial in .
We verify that there is no dependence on the scattering angle .
Using the smoothed slope,
the estimated non-exclusive background is subtracted from each bin.
Finally, we restrict our signal region to net transverse momentum below
0.05 (0.10) GeV/ for ().
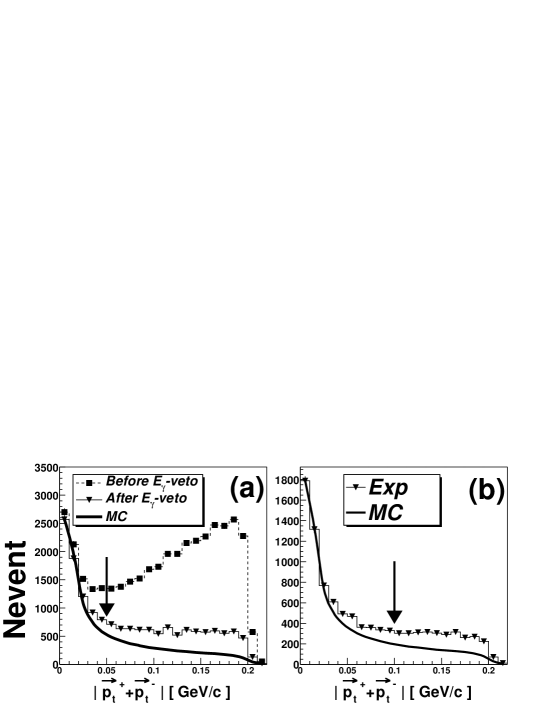
The background-subtracted yields, integrated over net transverse
momentum and scattering angle,
are shown as a function of in Fig. 3.
Figure 2:
distribution
for (a) and (b) candidates.
The dashed and solid histograms in indicate
the distribution of events
before and after -veto
(which is not applied to the candidates),
respectively.
The arrows indicate the upper boundaries of
for the signal.
The residual muon background has been subtracted from the distribution.
The curves show the signal MC distribution
which is normalized to the signal candidates at the leftmost bin.
Figure 3:
Number of events ()
obtained for the
(solid) and
(dashed) samples
after the background subtraction.
The signatures of the
and resonances are observed
in both and channels.
By
fitting each distribution outside the range 3.3–3.7 GeV
to a cubic polynomial, we see an excess of () events in the
() channel in the range of 3.34–3.44 GeV
and a corresponding excess of () events in the
range of
3.54–3.58 GeV. We obtain consistent results from a fit of each
distribution to a cubic polynomial plus a Breit-Wigner ()
or a Gaussian () peak. Assuming a
flat () shape for
the () resonance [10],
we subtract the above excesses bin by bin from each angular distribution
in the above ranges.
The statistical significance is
() in the () channel, where is
the standard deviation. The statistical significance is
() in the () channel.
The significances are taken from the square root of the difference
of the goodness-of-fit values from the two fits where the
peak term in the above fit function is included or excluded.
5 Derivation of the cross section
The differential cross section for a two-photon process
to a two-body final state
arising from an electron-positron collision is given by
(2)
where and denote
the number of the signal events
and a product of
detection and trigger efficiencies, respectively;
is the integrated
luminosity, and is the luminosity function,
defined as
.
The efficiencies for
and are obtained from a full Monte Carlo simulation [11],
using the TREPS [12] program for the event generation as well as the
luminosity function determination.
The trigger efficiency is determined from the trigger simulator.
The typical value of the trigger efficiency is
for events in the acceptance.
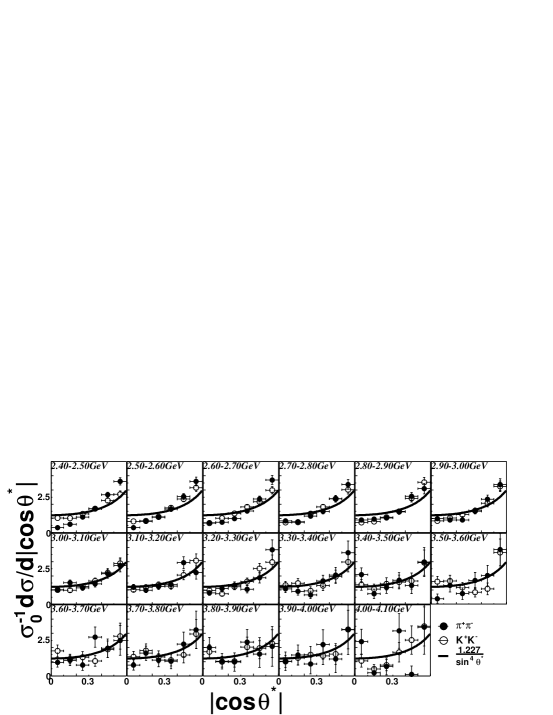
The efficiency-corrected measured differential cross sections for
and , normalized to
the partial cross section for , are shown
in Fig. 4 for each 100 MeV wide bin. The partial cross sections
for both processes, integrated over the above scattering angle
range, are shown in Fig. 5
(along with their ratio) and itemized in
Table 1.
Figure 4:
Angular dependence of the cross section,
,
for the (closed circles)
and (open circles) processes.
The curves are .
The errors are statistical only.
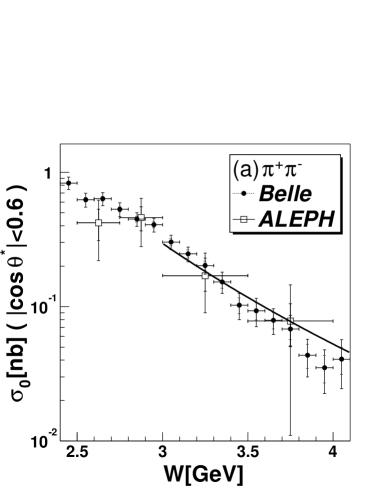
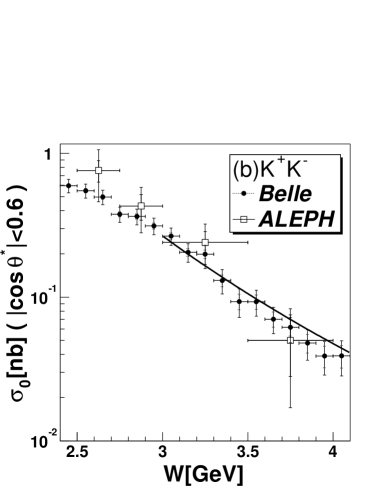
Figure 5:
Cross section for
(a) ,
(b)
in the c.m. angular region
together with a dependence line derived from
the fit of .
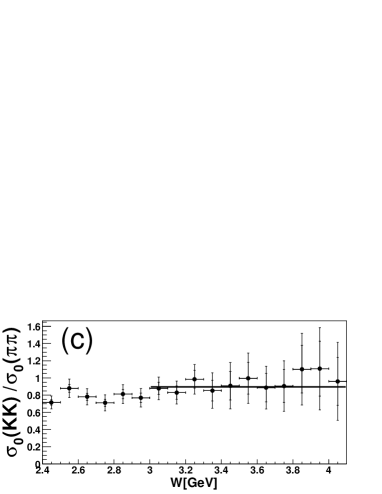
(c) shows the cross section ratio.
The solid line is the result of the fit
for the data above 3.
The errors indicated by short ticks are statistical only.
Table 1:
Cross sections and errors
for the and processes,
in the angular range .
stat.err
syst.err
stat.err
syst.err
GeV
nb
nb
nb
nb
nb
nb
2.4-2.5
0.832
0.026
0.083
0.595
0.019
0.062
2.5-2.6
0.625
0.024
0.070
0.549
0.018
0.059
2.6-2.7
0.636
0.025
0.067
0.497
0.018
0.054
2.7-2.8
0.530
0.023
0.059
0.377
0.016
0.043
2.8-2.9
0.448
0.022
0.048
0.364
0.016
0.043
2.9-3.0
0.407
0.021
0.042
0.313
0.015
0.038
3.0-3.1
0.302
0.019
0.032
0.266
0.014
0.034
3.1-3.2
0.247
0.017
0.026
0.205
0.013
0.027
3.2-3.3
0.202
0.016
0.022
0.199
0.013
0.027
3.3-3.4
0.153
0.016
0.023
0.130
0.012
0.022
3.4-3.5
0.103
0.014
0.018
0.093
0.011
0.018
3.5-3.6
0.093
0.014
0.017
0.093
0.011
0.016
3.6-3.7
0.079
0.011
0.013
0.070
0.009
0.012
3.7-3.8
0.068
0.011
0.014
0.062
0.008
0.011
3.8-3.9
0.043
0.009
0.010
0.048
0.007
0.009
3.9-4.0
0.035
0.008
0.010
0.039
0.007
0.008
4.0-4.1
0.041
0.009
0.013
0.039
0.007
0.008
6 Systematic errors
Table 2:
Contributions to the systematic errors.
A range is shown when the error has a
dependence.
Source
Tracking efficiency
4%
4%
Trigger efficiency
4%
4%
separation
0–1%
2–4%
background subtraction
5–17%
0%
Non-exclusive background subtraction
4–27%
7–20%
Luminosity function
5%
5%
Integrated luminosity
1%
1%
subtraction ()
8–11%
8–11%
Total
10–33%
10–21%
The dominant systematic errors are listed in Table 2.
The uncertainty due to trigger efficiency
is estimated by comparing the yields of
in real and simulated data [9] after accounting for
the background from events
(varying with from 0.5–4.6%),
which have the same topology [13].
The uncertainty in the relative muon
identification efficiency between real and simulated data is used to
determine the error associated with the residual subtraction
from the sample.
We use an error of
100% of the subtracted value for the non-exclusive background subtraction.
We allow the number of events to fluctuate by up to 20% of the
measured excess to estimate the error due to the subtraction
that is applied for the energy bins in
the range .
The total -dependent systematic error is
10–33% (10–21%) for the () cross section.
7 Discussion
For and , Brodsky and Lepage
predicted a dependence of the differential
cross section [1] as seen in Eq. 1,
and Brodsky and Farrar (BF) predicted a dependence of the cross
section [14].
The soft hadron exchange (“handbag”) model by DKV [4]
predicts an expression for the differential cross section similar to Eq. 1
(3)
where denotes either a pion or a kaon.
Here, they introduce the “annihilation form factor”
, which can be determined experimentally.
Fig. 4 shows normalized angular distributions
as a function of , for and modes.
The solid curves indicate the expectations from a
behavior predicted by BL and DKV models
(4)
These curves match the data well
for , but are more shallow than the
data for . This disagreement may arise from the
presence of one or more lower-energy resonances: for example, Belle has
reported a resonance at
with a width of in a study of
with [15].
Small momentum transfer from the photons to the pions,
at smaller scattering angles, may also cause this disagreement
for
through some unknown non-perturbative or hadronic effects.
We extract the annihilation form factor directly from the data,
by integrating the observed cross sections over
in the range of ,
where Eq. 4 fits the data quite well.
Since the observed values of are almost -independent,
we obtain
and
by fits to the data in this range.
Fig. 5 shows the observed cross sections
in comparison with the recent ALEPH data [5].
The lines indicate expectations with the
values from the fit above.
Our data are consistent with behavior
predicted by BL [1] and BF [14] models.
We can also directly obtain the power of the -dependence
() from the data.
We find for and for ,
for .
The first error is statistical, and the second is systematic.
We conservatively estimate the systematic error of by
artificially deforming the measured cross section values under the
assumption that systematic errors are strongly point-to-point correlated:
we shift the values at the two end bins by and
times the systematic error, respectively, whereas each intermediate point
is correspondingly moved so that its shift follows a linear function of
times its systematic error. The average of the observed deviations of
from its original value is taken as a final systematic error.
The results show a hint of somewhat steeper dependence than .
Fig. 5(c) shows the cross section ratio
as a function of .
The ratio is energy independent
for ,
in accordance with the QCD prediction.
The obtained value of the ratio is
. It is consistent with the value of 1.08 predicted by
Benayoun and Chernyak (BC) [16] and
significantly below 2.23 following from the BL calculation [1]
and using the current values of the kaon and pion decay constants [17].
The value predicted by BC is a consequence of consistent consideration of the
SU(3) breaking effects using the different wave functions for pions and kaons
derived from the QCD sum rules. This compensates for the partial account of
the SU(3) breaking by BL who used the same wave functions for pions and kaons
so that the cross section ratio is equal to the fourth power of the ratio
of the kaon and pion decay constants.
8
TWO-PHOTON DECAY WIDTH OF RESONANCES
Table 3:
Results for the product of the two-photon
decay width and the branching fraction,
.
The second column gives the observed yields
in the region of 3.34–3.44 GeV (3.54–3.58 GeV)
for ().
The first and second errors for
are statistical and systematic, respectively.
Number of events
[eV]
Significance
The measured yields of and events
can be used
to extract
the two-photon decay width of each resonance
using the formula
(5)
where and are the yield and mass, respectively, of the
corresponding spin-
resonance (where the mass is taken from Ref. [17]).
denotes the product of the
detection efficiency and acceptance for the resonance decays.
The extracted values of are summarized in Table 3.
The ratios are consistent
with the known [17]
ratios for both resonances.
Therefore we combine the measurements of the widths from the two modes
to obtain
and
where the error associated with the branching fraction
(taken from [17]) is calculated
assuming independent uncertainties for the and modes.
These values are consistent with the two-photon decay widths of
and following from the total widths and
branching ratios into two photons obtained in
previous experiments [17].
9 Conclusion
Using of data collected with the Belle
detector at KEKB,
we have measured with high precision
the cross sections for the
and
processes
in the two-photon c.m. energy range
and angular range of .
The angular differential cross sections
for those processes
show a behavior in the range of ,
which is predicted by QCD.
The energy dependence of the differential cross section is
also consistent with the QCD prediction of .
The partial cross section ratio ,
in
is measured to be for
in accordance with the prediction based on the QCD sum rules and
SU(3) symmetry breaking.
We have observed the and resonances decaying
to and final states and measured the products of
their two-photon decay widths and two-hadron branching fractions for
the first time.
Acknowledgements
We thank the KEKB group for the excellent operation of the
accelerator, the KEK Cryogenics group for the efficient
operation of the solenoid, and the KEK computer group and
the National Institute of Informatics for valuable computing
and Super-SINET network support.
We are grateful to V. Chernyak for fruitful discussions.
We acknowledge support from
the Ministry of Education, Culture, Sports, Science, and
Technology of Japan and the Japan Society for the Promotion
of Science; the Australian Research Council and the
Australian Department of Education, Science and Training;
the National Science Foundation of China under contract
No. 10175071; the Department of Science and Technology of
India; the BK21 program of the Ministry of Education of
Korea and the CHEP SRC program of the Korea Science and
Engineering Foundation; the Polish State Committee for
Scientific Research under contract No. 2P03B 01324; the
Ministry of Science and Technology of the Russian
Federation; the Ministry of Education, Science and Sport of
the Republic of Slovenia; the Swiss National Science Foundation; the National Science Council and
the Ministry of Education of Taiwan; and the U.S. Department of Energy.
References
[1]
S. J. Brodsky and G. P. Lepage, Phys. Rev. D 24 (1981) 1808.
[2]
C. Vogt, in Proceedings of PHOTON 2000:
Ambleside, England, August 26th-31st,
American Institute of Physics (2001), 345.
[3]
J. Dominick et al., CLEO Collaboration,
Phys. Rev. D 50 (1994) 3027.
[4]
M. Diehl, P. Kroll and C. Vogt, Phys. Lett. B 532 (2002) 99.
[5]
A. Heister et al., ALEPH Collaboration,
Phys. Lett. B 569 (2003) 140.
[6]
A. Abashian et al., Belle Collaboration,
Nucl. Instr. Meth. A 479 (2002) 117.
[7]
S. Kurokawa and E. Kikutani,
Nucl. Instr. Meth. A 499 (2003) 1.
[8]
S. Jadach and Z. Wa̧s, Comp. Phys. Commun. 85 (1995) 453.
[9]
F. A. Berends, P. H. Daverveldt and R. Kleiss,
Nucl. Phys. B 253 (1985) 441;
F. A. Berends, P. H. Daverveldt and R. Kleiss,
Comp. Phys. Commun. 40 (1986) 285.
[10]
K. Abe et al., Phys. Lett. B 540 (2002) 33.
[11]
The detector response is simulated with GEANT, R. Brun et al., GEANT 3.21,
CERN Report DD/EE/84-1, 1984.
[12]
S. Uehara, KEK Report 96-11 (1996).
[13]
S. Jadach, B. F. L. Ward and Z. Wa̧s, Comp. Phys. Commun. 130 (2000) 260.
[14]
S. J. Brodsky and G. R. Farrar, Phys. Rev. D 11 (1975) 1309.
[15]
K. Abe et al., Belle Collaboration, Eur. Phys. J. C 32 (2003) 323.
[16]
M. Benayoun and V. L. Chernyak, Nucl. Phys. B 329 (1990) 285.
[17]
S. Eidelman et al., Phys. Lett. B 592 (2004) 1.
![[Uncaptioned image]](/html/hep-ex/0412058/assets/x1.png)