New Results on Deeply Virtual Compton Scattering
at H1, ZEUS and HERMES
Abstract
The process of deeply virtual Compton scattering will be shortly introduced, and the latest results from measurements at the HERA –collider at DESY will be given. In particular, the cross section has been measured with increased statistics at the collider experiments H1 and ZEUS, while HERMES for the first time reports measurements of the –dependence of the beam–charge asymmetry on hydrogen and of a beam–charge asymmetry on deuterium.
Hard exclusive processes such as the Deeply Virtual Compton Scattering (DVCS) process can be expressed in terms of Generalized Parton Distributions (GPDs) [2, 3]. GPDs give a generalized description of the partonic structure of the nucleon, where the ordinary Parton Distribution functions (PDFs) and the nucleon form factors turn out to be the kinematic limits and the moments of GPDs, respectively [4]. Besides the fact that the DVCS process appears to provide the theoretically most direct access to GPDs, it is also investigated in the framework of diffractive processes. While the DVCS process is similar to the diffractive electroproduction of vector mesons, it avoids the theoretical complications of needing further non–perturbative information due to the vector meson distribution amplitude in the final state. Furthermore, it is also unique among the hard scattering processes in that DVCS amplitudes (magnitude and phase) can be determined. This is possible through a measurement of the interference between the DVCS and Bethe–Heitler (BH) processes, in which the photon is radiated from a parton in the former and from the lepton in the latter process. These processes have an identical final state, i.e., they are indistinguishable and thus the photon production amplitude is given as the coherent sum of the amplitudes of the DVCS () and BH () processes. The cross section for the exclusive leptoproduction of photons is then given as (see Ref. [5] for full expression)
| (1) |
where represents the Bjorken scaling variable, the virtual–photon four–momentum squared and the square of the four-momentum transfer to the target. The azimuthal angle is defined as the angle between the lepton scattering plane and the photon production plane. At leading twist, the BH–DVCS interference term can be written as
| (2) |
where +(-) denotes a negatively (positively) charged lepton beam with longitudinal polarization . The DVCS amplitude is given by a linear combination of the nucleon form factors with the so–called Compton form factors [6], which are convolutions of the twist–2 GPDs with the hard scattering amplitude.
In the following, the H1 and ZEUS cross section measurements, which access the squared DVCS amplitude , and the HERMES azimuthal asymmetry measurements, which access the DVCS amplitude directly via the interference term , will be presented.
1 Measurements of Cross Sections at H1 and ZEUS
The collider experiments H1 and ZEUS have a similar experimental setup and thus employ a similar method for their analysis. Since the scattered proton escapes detection, the event selection is based on the detection of two electromagnetic clusters and at most one reconstructed track. With the incoming proton defining the forward direction, the candidate events are subdivided into two samples where the positron candidate is either in the forward/central “large–” region, or in the rear “small–” region. A simulation of the BH contribution that describes the BH–dominated former sample can then be used to subtract the BH contribution from the latter sample, which contains BH events as well as DVCS events plus additional background. At leading twist, this directly leads to the DVCS cross section since the –dependent terms in the interference term (see Eq. 2) vanish as the measurement is integrating over the azimuthal angle.
The latest results on the cross section for the DVCS process, as obtained by H1, are shown in Fig. 1 as a function of the photon–nucleon invariant mass for GeV2.
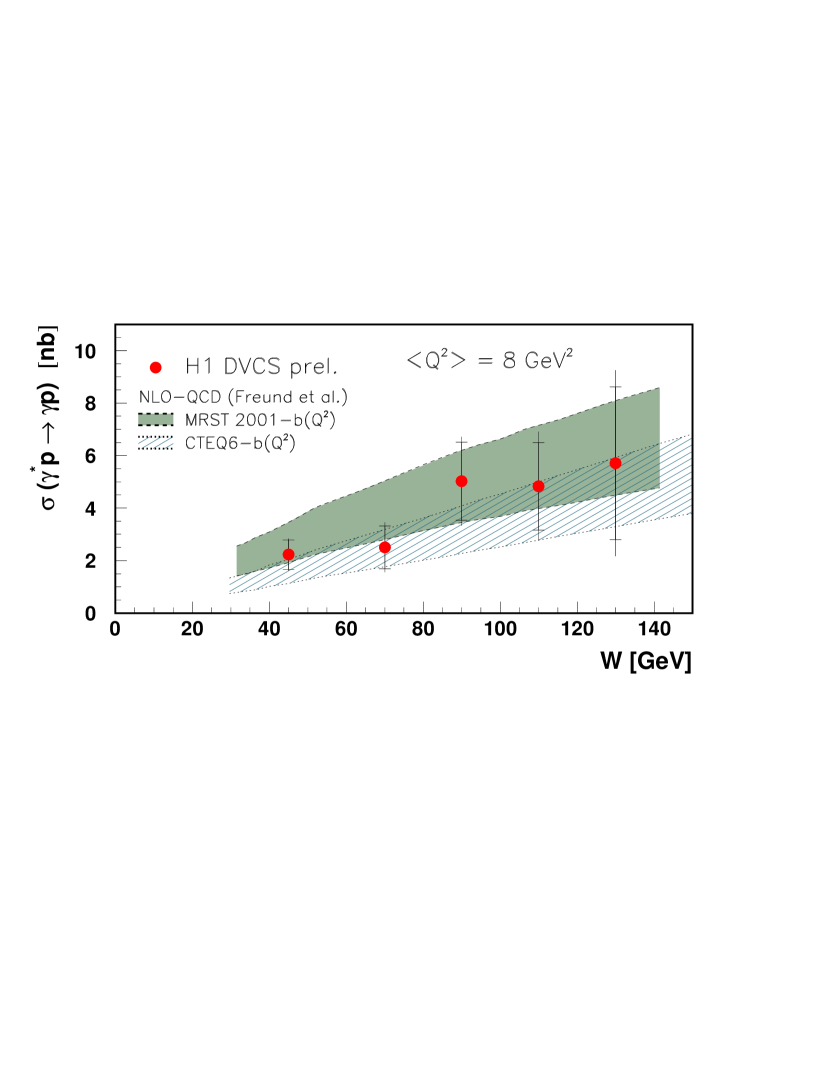
These exceed the published results [9] by almost a factor of 4 in statistics. The NLO QCD calculation in Fig. 1 is based on a GPD parametrization [7, 8]. Since GPDs reduce to ordinary PDFs in a certain kinematic limit, as mentioned above, the PDFs according to MRST2001 and CTEQ6 are in turn chosen to serve as an input for the model calculations. The data agree with both models within the theoretical uncertainties, which are due to the up–to–now unmeasured –dependence of the cross section. Since theoretical predictions are absent as well, an exponential ansatz is assumed with GeV GeV-2 and GeV-2. The range for the -slope covers the measured range for light vector meson production, i.e., it was chosen under the assumption that the production of real photons and light vector mesons have a similar –slope. Clearly, the foreseen direct measurement of the –dependence will be extremely beneficial.
Fig. 2 shows the preliminary H1 data as a function of and together with one of the results from the GPD based model calculation, but this time at a fixed value of GeV-2. In addition, the already published results from H1 [9] and ZEUS [10] and the results from a color dipole model calculation [11] are shown.
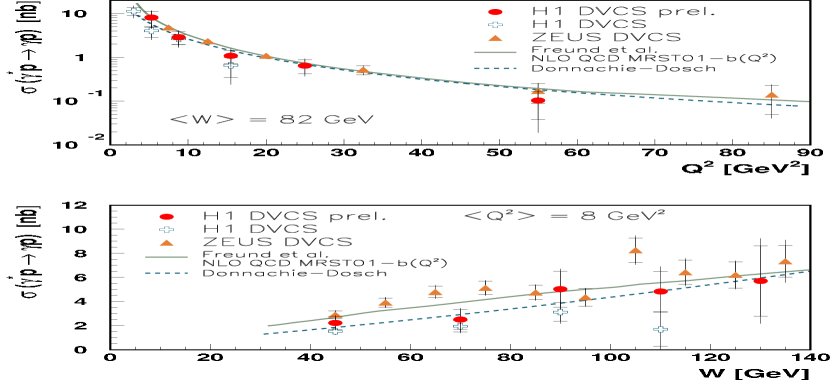
Based on and cross sections, the color dipole model predicts the amplitude only for forward scattering, that is at . Thus, in order to calculate the integrated cross section, an exponential –dependence with a fixed slope of 7 GeV-2 is assumed as well. The differences between the results of the GPD based model and the color dipole model become apparent in the comparison of the cross section as a function of , where the data show a possible discrepancy between the H1 and ZEUS results. However, a direct measurement of the –dependence is needed before the data can become conclusive.
2 Measurements of Azimuthal Asymmetries at HERMES
In contrast to the squared BH and DVCS amplitudes, the interference term (see Eq. 2) does depend on the sign of the beam charge. Therefore a measurement of a cross section asymmetry with respect to the beam charge can isolate the real part of the interference term, while the imaginary part can be isolated with a polarized lepton beam (). Measurements of azimuthal asymmetries with respect to the beam spin, accessing the imaginary part of via a modulation, have been reported on hydrogen [12, 13] as well as on deuterium and neon [14]. The extraction of an azimuthal asymmetry with respect to the beam charge, accessing the real part of via a modulation, is described in the following using hydrogen and deuterium targets.
At the fixed–target experiment HERMES, events were selected if they contained exactly one photon and one charged track identified as the scattered beam lepton. The important kinematic requirements imposed on the scattered lepton were 1 GeV2 and 3 GeV. The photon was identified by detecting an energy deposition in the preshower scintillator and in the calorimeter without an associated charged track. The polar angle between the virtual and the real photon is required to be between 5 and 45 mrad. Since the recoiling proton was not detected, events were selected if the missing mass of the reaction corresponds to the proton mass. Due to the finite energy resolution the exclusive region is defined as GeV based on signal–to–background studies using a Monte–Carlo simulation.
The beam–charge asymmetry as a function of is calculated as
| (3) |
where and represent the single photon yields normalized to the number of detected DIS events using the positron and electron beam, respectively. It is shown in Fig. 3 for the exclusive sample
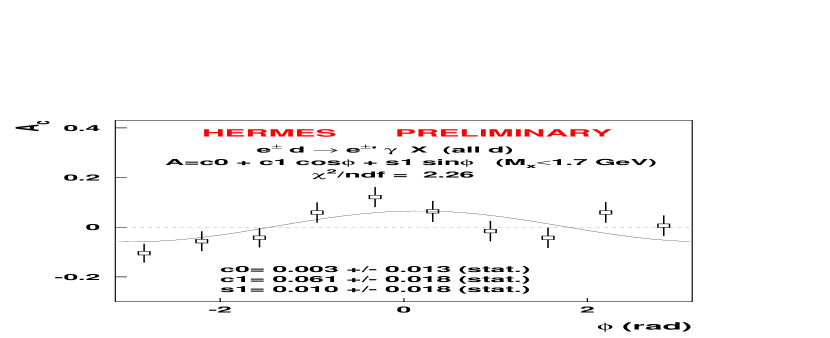
collected on an unpolarized or spin–averaged polarized deuterium target. The indicated fit to the asymmetry describes the data quite well and indeed yields the expected behavior. Fig. 4 shows the amplitudes on deuterium and hydrogen as a function of , which are derived from the fit to the beam–charge asymmetry in each bin. For both targets, the signal only becomes sizeable for larger values of . While their slightly different behavior at large values can be due to incoherent scattering on the neutron in the deuteron, effects from coherent scattering on the deuteron can be expected in the first bin but are not apparent there.
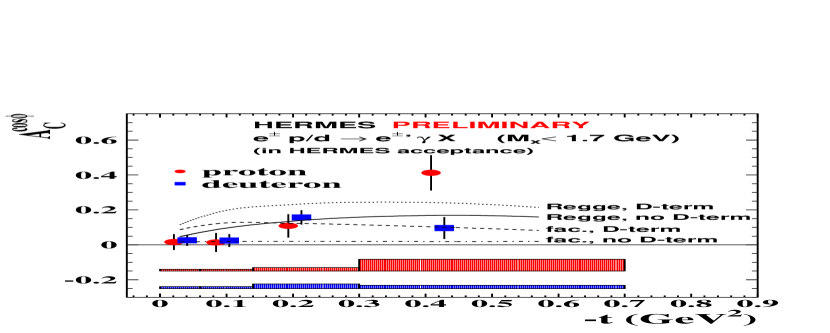
Note that an intermediate result of the hydrogen analysis [15] with a preliminary –averaged value of (stat.) (sys.) was derived at a mean value of 0.27 GeV2, it thus can be approximately compared to the result in the third bin.
The theoretical calculations shown in Fig. 4 are carried out at the average kinematics of every bin. They are based on a GPD model developed in Refs. [16, 17]. The data appear to favor the model with the non–factorized -dependence and a vanishing contribution from the so–called D–term. It is apparent that measurements of the beam–charge asymmetry have a large predictive power given the fact that the electron sample used was quite small.
This work was supported in part by the US Department of Energy.
References
- [1]
- [2] F.M. Dittes et al., Phys. Lett. B209 (1988) 325.
- [3] D. Müller et al., Fortschr. Phys. 42 (1994) 101.
-
[4]
X. Ji, Phys. Rev. Lett. 78 (1997) 610,
X. Ji, Phys. Rev. D55 (1997) 7114. - [5] M. Diehl et al., Phys. Lett. B411 (1997) 193.
- [6] A.V. Belitsky, D. Müller and A. Kirchner, Nucl. Phys. B629 (2002) 323.
- [7] A. Freund and M. McDermott, Eur. Phys. J. C23 (2002) 651
- [8] A. Freund, M. McDermott and M. Strikman, Phys. Rev. D67 (2003) 036001
- [9] H1 Coll., C. Adloff et al., Phys. Lett. B517 (2001) 47
- [10] ZEUS Coll., S. Chekanov et al., Phys. Lett. B573 (2003) 46
- [11] A. Donnachie and H.G. Dosch, Phys. Lett. B502 (2001) 74
- [12] HERMES Coll., A. Airapetian et al., Phys. Rev. Lett. 87 (2001) 182001.
- [13] CLAS Coll., S. Stepanyan et al., Phys. Rev. Lett. 87 (2001) 182002.
-
[14]
F. Ellinghaus, R. Shanidze and J. Volmer (for the HERMES Coll.),
hep-ex/0212019 - [15] F. Ellinghaus (for the HERMES Coll.), Nucl. Phys. A711 (2002) 171.
- [16] M. Vanderhaeghen, P.A.M. Guichon and M. Guidal, Phys. Rev. D60 (1999) 094017.
- [17] K. Goeke, M.V. Polyakov and M. Vanderhaeghen, Prog. Part. Nucl. Phys. 47 (2001) 401.