Evidence for production at the from CLEO and properties of the
from BaBar
J. C. Wang
Department of Physics, Syracuse University, Syracuse, NY 13244, USA
E-mail: jwang@physics.syr.edu
Abstract
BaBar experiment scan around the resonance and measure its mass and full width.
They also measure
from 81.7 fb data.
CLEO collaboration took about 0.42 fb data.
They search for in both inclusive and exclusive modes
and find evidence for production at the and
.
1 Introduction
The is the lowest resonance above threshold.
Its mass and total width had been measured in scans of the total cross-section
at center of mass energy around 10.58
GeV. [1, 2, 3, 4]
The decays into and modes allowing these particles
to be carefully studied.
Many branching fractions had been measured from data.
Most of them, however, based on the assumption of equal production rates of the charged and
neutral pairs.
Previous measurements are consistent with this
assumption. [5, 6, 7, 8]
More precise measurement may result in renormalization of decay branching fractions.
The was discovered by measuring the total hadronic cross-section
above as a function of energy at CESR. [1, 2]
It is massive enough to produce pairs.
With limited data samples, experiments failed to clearly show the level of
production at the .
In this paper I summarize recent studies from BaBar and CLEO on these issues.
The results on from BaBar and from
CLEO are preliminary.
2 Evidence of in at CLEO
The was discovered at CESR. [1, 2]
Its mass was measured to be GeV.
It can decay into modes, more channels than the
due to its heavier mass.
It is massive enough even to produce pairs.
Potential models predict about 1/3 of produces pair. [9]
The mode is the largest.
The experiments, however, failed to reveal if mesons were produced in about
0.1 fb-1 data.
The CLEO III detector has recently recorded 0.42 fb-1 of annihilation data at
the resonance. Using this data sample they search for evidence of in both
inclusive and exclusive modes. [10]
Most of production in decay is analogous to ’s in decay.
CLEO estimates , whereas
the measurement of , which is
the average of and .
The distinct production rates can be used to unfold the production rate of in
decays.
CLEO reconstructs in the mode
from , and continuum data.
The reconstruction efficiency is about 30%.
The yields as a function of x equal to the momentum divided by the beam energy
for and data are shown in Fig. 1.
The contribution from events is subtracted,
the reconstruction efficiency is applied, but there is no correction for branching ratios.
The production of from is significantly larger than that from .
Figure 1: The fractional yields vs x from (a)the and (b)the decays by CLEO,
where the continuum contribution is subtracted.
Using , CLEO finds
where the systematic error is dominated by decay branching ratio.
From these numbers CLEO finds
This is the first evidence of production at .
The rate agrees with theoretical expectations, which have a large range.
CLEO also looks for in two groups of exclusive modes:
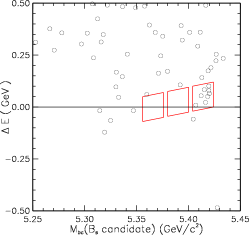
and . The vs plots
are shown in Fig. 2, where the beam energy constraint mass and energy difference are
defined as
(1)
In the signal boxes 2 and 8 candidates for the two groups respectively are
found.
Figure 2: The vs distributions for (top)
and (bottom) modes.
The three signal boxes from left to right correspond to
channels.
The from decays can be produced via three different channels:
,
and one expects that .
The energy of candidates produced through these three modes are
not the same due to available kinetic energy and Lorentz boost,
resulting in 3 distinct signal regions as indicated in the plot.
The rightmost box where the candidates are found corresponds to
the mode.
The large signal of with respect to the other modes is
consistent with theoretical expectation.
3 Measurement of parameters
The is the lowest state above open bottom threshold.
The full width of , is thus much larger than that of lower
states, which allows direct measurement of its value at collider.
The mass, total width and partial width
had been previously measured by CLEO, CUSB and
ARGUS. [1, 2, 3, 4]
The values have relatively large uncertainty.
Different measurements show substantial variation.
Improved measurements are necessary.
The BaBar detector is designed to operate at the SLAC PEP-II asymmetric-energy B factory.
The experiment scanned the system at center of mass energy around
the mass of , 10.58 GeV. [11]
The resonance parameters can be determined from the fit of visible
hadronic cross-section distribution to a so called line-shape function.
To the first order, BaBar uses relativistic Breit-Wigner function for the production
cross section of
(2)
The electric partial width is taken as constant,
and the total width is energy dependent.
The function is further modified by radiative corrections calculable numerically,
and the beam energy spread.
BaBar did one scan around to determine the energy spread as well as energy calibration.
The visible hadronic cross-section also includes contributions from
continuum events and other processes
which are not totally eliminated but suppressed.
This is modeled in the fit.
The integrated luminosity is measured using process.
BaBar fit three cross section distributions simultaneously.
The parameters of are measured to be:
where the uncertainty of energy spread, peak cross section, long term drift of energy scale, model
uncertainty and other sources are accounted for in the systematic errors.
4 Measurement of
The decays into and modes.
It is the most suitable environment to study physics.
Many branching fractions had been measured from data.
Most of the measurements, however, based on the assumption of equal production
rates of the charged and neutral pairs.
Theoretic models predict that the ratio of the charged pair production over neutral one
ranges from 1.03 to 1.25. [12]
Previous measurements are consistent to 1 within
error. [5, 6, 7, 8]
A non-unit value of the ratio results in renormalization of the decay branching
fractions and contributes to our understanding of isospin violation in decays.
With a data sample of about 80 fb-1 collected at BaBar measured
. [13]
The neutral mode is tagged with decay.
The sample of events in which at least one candidate is found
is labeled as “single-tag sample”, .
The subset of “single-tag sample” where two candidates are found on both
and sides is labeled as the “double-tag sample”, .
We have
(3)
where total number of events ,
,
and and are the corresponding reconstruction efficiencies.
The double-tag reconstruction efficiency
because the efficiencies are not correlated.
The ratio is thus given by
(4)
The measurement uses partial reconstruction of , where
only the lepton and the slow from decay are observed.
This technique was first proposed by ARGUS [14] and has been
used in the CLEO measurement. [7]
As there is very little kinematic energy released in decay, momenta of
and are correlated in rest frame.
Thus momentum can be parameterized with the momentum.
The neutrino invariant mass squared is calculated as:
(5)
The distributions for single and double tag samples are shown in Fig. 3,
where contribution from is subtracted.
Figure 3: The distributions of single-tag (top) and double-tag (bottom) samples by BaBar.
Lines, and hatched area are fit to PDFs of various sources.
To determine and , binned fits are performed to the two histograms.
The probability density functions(PDF) of signal and backgrounds are determined from MC simulation.
The number of signals are and .
The neutral branching rate, ,
is still consistent with equal production rates of the charged and neutral pairs.
Acknowledgments
Many BaBar and CLEO colleagues helped in preparing this paper.
The author would like to thank them, especially Professors S. Stone, and I. Shipsey, Doctors
R. Godang, V. Pavlunin and R. Sia for useful discussions and comments.
References
[1]
D. Besson et al. [CLEO Collaboration],
Phys. Rev. Lett. 54, 381 (1985).
[2]
D. M. J. Lovelock et al.,
Phys. Rev. Lett. 54, 377 (1985).
[3]
C. Bebek et al. [CLEO Collaboration],
Phys. Rev. D 36, 1289 (1987).
[4]
H. Albrecht et al. [ARGUS Collaboration],
Z. Phys. C 65, 619 (1995).
[5]
J. P. Alexander et al. [CLEO Collaboration],
Phys. Rev. Lett. 86, 2737 (2001).
[6]
B. Aubert et al. [BABAR Collaboration],
Phys. Rev. D 65, 032001 (2002).
[7]
S. B. Athar et al. [CLEO Collaboration],
Phys. Rev. D 66, 052003 (2002).
[8]
B. Aubert et al. [BABAR Collaboration],
Phys. Rev. D 69, 071101 (2004).
[9]
S. Ono, A. I. Sanda and N. A. Törnqvist, Phys. Rev. Lett 55,
2938 (1985);
N. A. Törnqvist, Phys. Rev. Lett 53, 878 (1984);
S. Ono and N. A. Törnqvist, Phys. Rev. D 34, 186 (1986).
[10]
D. Asner et al. [CLEO Collaboration],
[arXiv:hep-ex/0408070].
[11]
B. Aubert et al. [BABAR Collaboration],
[arXiv:hep-ex/0405025].
[12]
R. Kaiser, A. V. Manohar, and T. Mehen, Phys. Rev. Lett. 90, 142001 (2003);
M. B. Voloshin, Mod. Phys. Lett. A 18, 1783 (2003);
N. Byers and E. Eichten, Phys. Rev. D 42, 3885 (1990);
G. P. Lepage, Phys. Rev. D 42, 3251 (1990);
D. Atwood and W. J. Marciano, Phys. Rev. D 41, 1736 (1990);
E. Eichten, K. Gottfried, T. Kinoshita, and K. D. Lane, Phys. Rev. D 21,
203 (1980).
[13]
B. Aubert et al. [BABAR Collaboration],
[arXiv:hep-ex/0408022].
[14]
H. Albrecht et al. [ARGUS Collaboration],
Phys. Lett. B 324, 249 (1994).