Experimental study of direct photon emission
in decay using ISTRA+ detector
V.A. Uvarov, S.A. Akimenko, G.I. Britvich, K.V. Datsko, A.P. Filin, A.V. Inyakin, V.A. Khmelnikov, A.S. Konstantinov, V.F. Konstantinov, I.Y. Korolkov, V.M. Leontiev, V.P. Novikov, V.F. Obraztsov, V.A. Polyakov, V.I. Romanovsky, V.M. Ronjin, V.I. Shelikhov, N.E. Smirnov, O.G. Tchikilev, O.P. Yushchenko
Institute for High Energy Physics, Protvino, Russia
V.N. Bolotov, V.A. Duk, S.V. Laptev, A.Yu. Polyarush
Institute for Nuclear Research, Moscow, Russia
Abstract
The branching ratio in the charged-pion kinetic energy region of 55 to 90 MeV for the direct photon emission in the decay has been measured using in-flight decays detected with the ISTRA+ setup operating in the 25 GeV/ negative secondary beam of the U-70 PS. The value
obtained from the analysis of 930 completely reconstructed events is consistent with the average value of two stopped-kaon experiments, but it differs by 2.5 standard deviations from the average value of three in-flight-kaon experiments. The result is also compared with recent theoretical predictions.
1 Introduction
The radiative decay channel () is one of the most sensitive and important channels in investigating the chiral anomaly [1] in the non-leptonic sector [2, 3]. This chiral anomaly is a basic feature of quantum field theories with chiral fermions and thus of the Standard Model. Therefore, experimental tests of the chiral anomaly are crucial for the theoretical basis of particle physics.
The total amplitude for the decay can be generally decomposed as the sum of two terms: the inner bremsstrahlung (IB) associated with the decay () in which the photon is emitted from the outgoing charged pion, and the direct emission (DE) in which the photon is emitted from one of the intermediate states of the decay. The inner bremsstrahlung is completely predicted by quantum electrodynamics in terms of the amplitude [4]. Because the decay is suppressed by the isospin selection rule, the bremsstrahlung contribution to the decay is also suppressed. Unlike the bremsstrahlung, the direct emission processes are permitted here, since for them weak-electromagnetic transitions are possible from the initial kaon to the final two-pion -wave state with . Although the inner bremsstrahlung component is still dominant, it can be isolated kinematically, and therefore the direct emission contribution can compete with the suppressed inner bremsstrahlung one.
The simplest radiative transitions for the direct emission in the decay are electric and magnetic dipole transitions [5]. The electric transition can interfere with the inner bremsstrahlung process, and possible non-standard-model effects, like a -violating asymmetry between and decay rates, could appear in the corresponding interference term. The magnetic transition is a manifestation of the chiral anomaly.
Within the framework of Chiral Perturbation Theory (ChPT) at leading order, , the magnetic transition amplitude consists of two different classes of anomalous amplitudes: reducible [2] and direct [3, 6] amplitudes. The reducible anomalous amplitude is derived directly from the Wess–Zumino–Witten functional [7] and does not depend on undetermined constants, whereas the direct anomalous amplitude, arising from higher-dimension operators in ChPT, and also the electric transition amplitude are subject to some theoretical uncertainties.
The differential rate for the decay is conveniently expressed in terms of the Dalitz plot variables and , where is the kinetic energy of in the rest frame, and . Here , and are 4-momenta of , and , and and are masses of and , respectively. This rate can be written [8] in terms of the inner bremsstrahlung differential rate as
| (1) |
where is the on-shell amplitude for the decay, and and are the direct emission electric and magnetic invariant dimensionless amplitudes, defined in Ref. [2].
In experimental studies of the decay the variable is usually used to minimize contaminations arising from the decay, dominated at MeV, and from the decay (), dominated at MeV. The variable is convenient to isolate the inner bremsstrahlung from the direct emission, since the former process dominates at small values of , while the latter dominates at large values of .
The branching ratio in the region of 55 MeV 90 MeV for the direct photon emission in the decay () has been measured in the following five experiments: three in-flight-kaon and two stopped-kaon experiments have found the weighted average values of = (1.80.4)10-5 [9, 10, 11] and = (0.440.08)10-5 [12, 13], respectively. The discrepancy between these two average values is 3.3 standard deviations. Therefore, further experimental studies are necessary to settle this discrepancy.
The cited experimental values of can be compared with corresponding theoretical predictions in the same region. Under the assumption that the direct emission is entirely due to the reducible anomalous amplitude given by Eq. (30b) in Ref. [2] with standard ChPT coupling constants, ChPT at leading order predicts the value of = 0.3510-5. Model-dependent theoretical predictions which take into account the additional contribution of the direct anomalous amplitude [3, 6] are also available: for example, the factorization model [6] predicts the value of = 1.9410-5.
The above-mentioned observations encourage us to perform a new measurement of the direct photon emission in the decay using in-flight negative kaons.
2 Experimental setup
The experiment has been performed at the IHEP proton synchrotron U-70 with the experimental apparatus ISTRA+, which is a modification of the ISTRA-M setup [14] and which was described in some details in our recent papers where studies of the [15], [16] and [17] decays were presented. The setup is located in the negative unseparated secondary beam with the following parameters during the measurement: the momentum is GeV/ with , the admixture of kaons is , and the total intensity is 106 per spill.
The side elevation view of the ISTRA+ detector is shown in Fig. 1.

The setup coordinate system is the following: the , and axes are turned along the field of the spectrometer magnet M2, the vertical line and the setup longitudinal axis, respectively.
The measurement of the beam particles, deflected by the beam magnet M1, is performed with four beam proportional chambers BPC1–BPC4. The kaon identification is done by three threshold gas Cherenkov counters 0–2 (0 is not shown in Fig. 1). The momenta of the secondary charged particles, deflected in the vertical plane by the spectrometer magnet M2, are measured with three proportional chambers PC1–PC3, three drift chambers DC1–DC3 and four planes of the drift tubes DT. The secondary photons are detected by the lead-glass electromagnetic calorimeters SP1 and SP2. To veto low energy photons the decay volume is surrounded by the guard system of eight lead-glass rings and by the SP2. The wide aperture threshold helium Cherenkov counters 3 and 4 are not used in the present study. In Fig. 1, HC is a scintillator-iron sampling hadron calorimeter, MH is a scintillation hodoscope used to improve the time resolution of the tracking system, MuH is a scintillation muon hodoscope.
3 Event selection
About 332 M events were collected during one physics run in Winter 2001. These experimental data are complemented by about 260 M events generated with the Monte Carlo program GEANT3 [18]. The Monte Carlo simulation includes a realistic description of the experimental setup: the decay volume entrance windows, the track chamber windows, gas mixtures, sense wires and cathode structures, the Cherenkov counter mirrors and gas mixtures, the showers development in the electromagnetic calorimeters, etc. The details of the reconstruction procedure have been published in Refs. [15, 16], here only key points relevant to the event selection are described.
The data processing starts with the beam track reconstruction in the beam proportional chambers BPC1–BPC4, and then with the secondary tracks reconstruction in the decay tracking system PC1–PC3, DC1–DC3 and DT. The decay vertex is reconstructed by means of the unconstrained vertex fit of the beam and decay tracks. Finally, the electromagnetic showers are looked for in the calorimeters SP1 and SP2, and the photons are reconstructed using the fit procedure with the Monte Carlo generated two-dimensional patterns of showers. To suppress leptonic decays the particle identification is used. The electrons are identified using the ratio of the energy of the shower, detected in the calorimeter SP1 and associated with the track of the electron, to the momentum of the electron [15]. The muons are identified using the information from the calorimeters SP1 and HC [16].
In the present study, the main purpose of the event selection is to suppress significantly all components of the background contamination, even if some of them are negligible in studying the decay modes which branching ratios are more than 1%. The expediency of the selection criteria, mentioned below, is motivated by the Monte Carlo investigation.
At the first step of the event selection only the measurements of the beam and secondary charged particles are used. Those events are selected which satisfy the following requirements:
-
–
only one beam track and one negative secondary track are detected;
-
–
the first hit of the secondary track is either in the chamber PC1, or in the DC1, or in the PC2, while the last hit of this track is in the drift tubes DT;
-
–
the probability of the vertex fit, , is more than ;
-
–
the relative error of the secondary track momentum, , is less than 0.1;
-
–
the decay vertex is before the calorimeter SP2 (6 m 17 m), and its transverse position is in the region of (3 cm 3 cm, 2 cm 6 cm);
-
–
the secondary track is not identified as an electron or as a muon;
-
–
the angle between the line of flight and the direction in the rest frame is in the region of ;
-
–
the kinetic energy in the rest frame is in the region of 55 to 90 MeV.
At the second step of the event selection the measurements of the showers in the calorimeters SP1 and SP2 are used. Associating the SP1 shower with the secondary track is done if the distance is less than 3 cm, where (, ) and (, ) are the transverse coordinates of the shower and of the track extrapolation to the calorimeter SP1, respectively. The event selection is done by the requirements:
-
–
the number of showers associated with the secondary track () is no more than one, and if the event has such shower (i.e. ) the ratio of the energy of this shower to the track momentum is less than 0.7;
-
–
the total (in both calorimeters) number of photons (i.e. showers, which are not associated with the secondary track) is equal to three.
Also, the events are selected if the three photons satisfy the following requirements:
-
–
at least one of them is detected in the SP1;
-
–
the photon energy is more than 0.8 GeV, but is more than 1 GeV if the photon is detected in the SP2;
-
–
the relative error of the photon energy, , is less than 1, but the number of photons with is no more than one;
-
–
the relative transverse position of the SP1 photon (, ) is outside the rectangle region of ( cm, cm) and, if , the strip region of ( cm, cm);
-
–
the photon configuration is not such as the one, in which all SP1 photons are reconstructed from one and the same cluster of overlapped showers.
At the third step of the event selection the hits found in the hodoscope MH, in the proportional chamber PC1 and in the drift tubes DT are considered to minimize the background contamination and systematics. The further selection is done by the requirements:
-
–
the number of hits in the hodoscope MH () is no less than one, and exactly one of them is associated with the secondary track extrapolation to the hodoscope, all the others (if ) are associated with the SP1 photon interpolations to the hodoscope (in terms of the distance in the MH transverse plane, cm);
-
–
the number of hits, which are found in the chamber PC1, but not used in the track reconstruction, is no more than one for each coordinate plane;
-
–
if some hit found in the -coordinate plane of the chamber PC1 is used in the secondary track reconstruction, the decay vertex is in the region before this chamber;
-
–
any hit found in the DT - or -coordinate plane is either used in the track reconstruction or associated with at least one SP1 photon interpolation to the drift tubes (in terms of the distance in the DT coordinate plane, cm or cm).
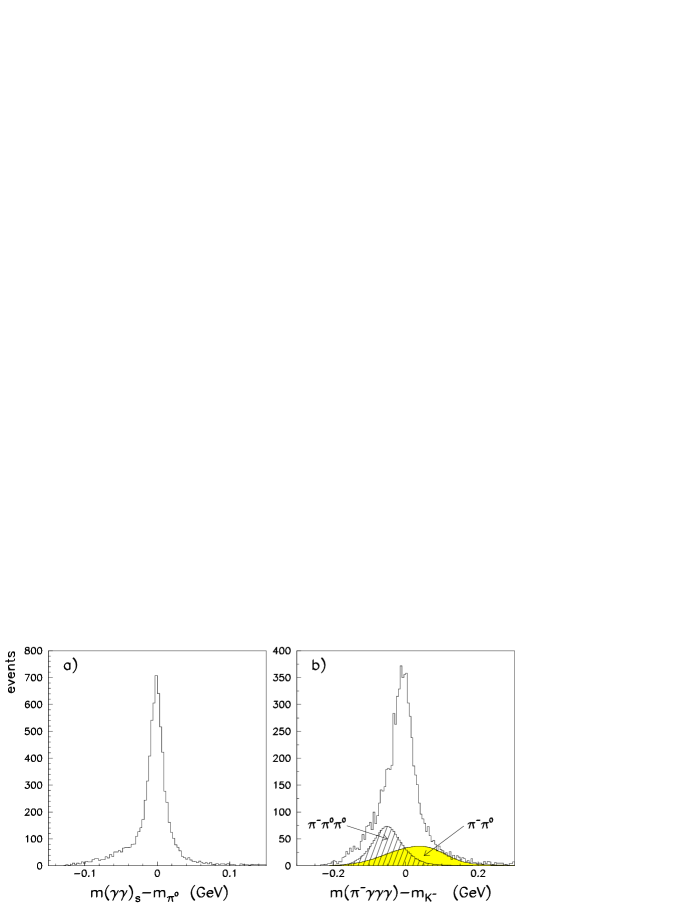
To illustrate the quality of the first three steps of the event selection the mass deviations and for the corresponding events are shown in Fig. 2, where is the effective mass of the pair with the smallest absolute value of the deviation, is the effective mass of the system, and is the mass. The background contamination of the and events (also shown in Fig. 2b) is estimated from the Monte Carlo simulation to be 41%.
At the fourth step of the event selection the kinematic criteria are used to select the events. First, for each of the three combinations in the event, assuming it arises from the decay, the kinematic 5C-fit for the hypothesis is applied. Then, such pairing is chosen, for which the event passes the kinematic fit with the largest value of the combined probability , where is the probability of the fit and is the inner bremsstrahlung decay probability as a function of the fitted values of the Dalitz plot variables.
After that, the event selection is done restricting the allowed ranges of the variables defined by the measured values of the particle momenta. The corresponding criteria, in which the measured four-momentum is multiplied (re-scaled) by a factor , are the following:
-
–
the measured momentum of the system is in the region of 23 to 29 GeV/;
-
–
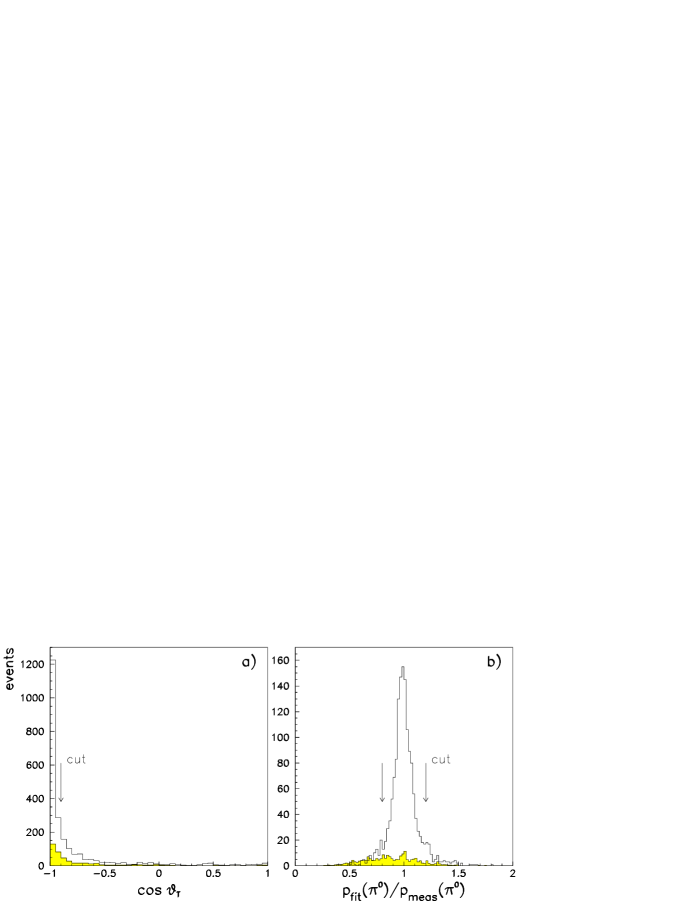
the angle between the measured and transverse momenta defined with respect to the direction is more than 154∘ (see Fig. 3a);
-
–
the ratios, and , of the fitted and momenta values to the measured ones are in the region of 0.8 to 1.2 (see Fig. 3b);
-
–
the deviations and are less than 40 MeV/;
where is the effective mass of the pair arising from the decay, is the effective mass of the system.
At the fifth step of the event selection the contaminations of the and events are minimized. The event is not selected if, for at least one pairing, it passes the kinematic fit for the (one in the event is lost) or (one in the event is a calorimeter noise) hypothesis and satisfies the additional requirements, which for the hypothesis are:
-
–
the Dalitz plot variable (defined for the chosen above hypothesis) is more than 0.25;
-
–
the deviation is less than 40 MeV/, where is the effective mass of the system, in which the first is reconstructed from the measured photons and re-scaled as above by a factor , while the second one is calculated from the balance of the three-momenta;
-
–
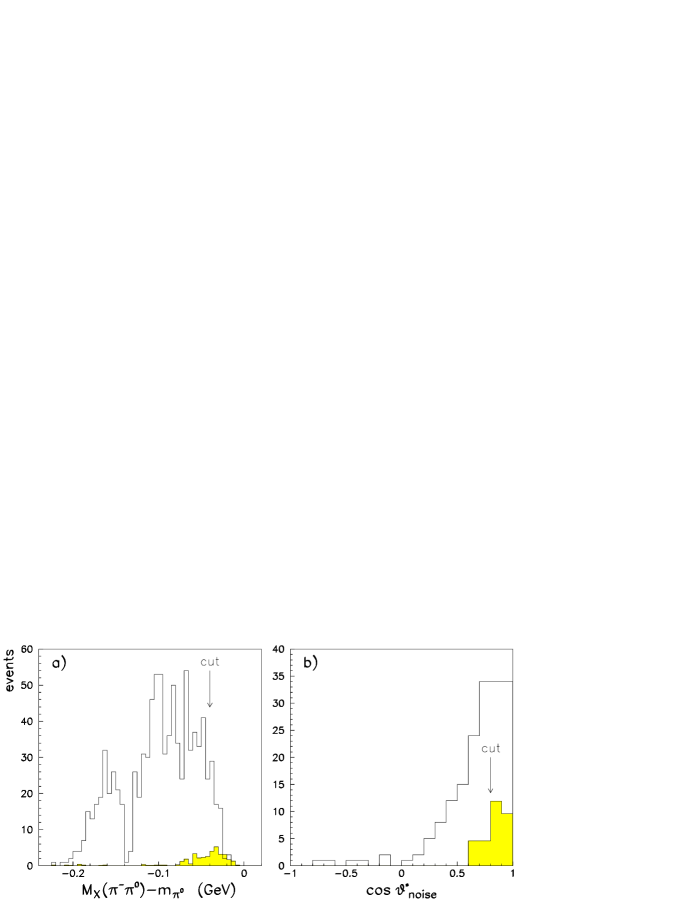
the deviation is less than 40 MeV/, where is the missing mass to the system with the reconstructed and re-scaled meson (see Fig. 4a);
and which for the hypothesis are:
-
–
the angle between the measured and transverse momenta defined with respect to the direction is more than 174∘;
-
–
the deviation is less than 50 MeV/, where is the effective mass of the system with the re-scaled meson;
-
–
the angle in the rest frame between the and (the latter is considered here as a calorimeter noise) momenta is less than 37∘ (see Fig. 4b).
Using the mentioned above selection criteria for the decay we have collected 930 completely reconstructed events. The corresponding numbers of accepted Monte Carlo events are about 13 times larger than the ones collected in the experiment. The surviving background contamination arising from all background decay modes is estimated from the Monte Carlo simulation to be less than 6%. The detailed event reduction statistics is given in Table 1.
| Total number of events | 332 M |
| Beam track reconstructed | 248 M |
| Secondary track(s) reconstructed | 124 M |
| Number of events written on DST | 108 M |
| and selected (all cuts of the 1st step) | 1729 K |
| selected (all cuts of the 2nd and the 3rd steps) | 7623 |
| pre-selected (all cuts of the 4th step) | 1041 |
| selected (all cuts of the 5th step) | 930 |
4 Analysis
In the present analysis, the uncorrected distribution of the selected events as a function of the Dalitz plot variable was used. This distribution is shown in Fig. 5a together with the normalized distribution of the Monte Carlo simulated events reconstructed with the same program as for the real data.

The background was estimated from the simulation of the particle interaction with the material of the detector and of the kaon decay including all decay modes with the branching ratios more than 1%. The corresponding branching ratios and matrix elements in the Monte Carlo simulation were taken from the PDG [19].
The Monte Carlo distribution in Fig. 5a includes the component (with and without the direct emission) and the background contamination (BG). The fractions in the selected events of the contaminations arising from the background and decays are shown in Fig. 5b as a function of the variable and estimated to be 4% and 2%, respectively. The background of all other decay modes is negligible. Due to the detector imperfection, the component in the simulated events consists of the correct and wrong reconstructed decays. The fraction of the latter is also shown in Fig. 5b and estimated to be 6%.
Fig. 6a shows two -dependences of the ratio of the DE and IB components estimated from the Monte Carlo events without the contamination of the background decay modes.

The first dependence was obtained from the generated events taken “before passing the detector”, while the second one was obtained from the simulated events taken “after passing the detector”. Comparing these dependences, one can conclude that in the present experiment the DE component is not smeared due to the detector imperfection: the acceptance and inefficiency, the event selection, the experimental resolution, the noise, the secondary interactions and the wrong pairing.
The passing rate for the events, , is shown in Fig. 6b as a function of the variable separately for the IB and DE components. These dependences were obtained from the Monte Carlo events without the contamination of the background decay modes: () is the number of the generated (simulated) events, and the binning is given by the generated (simulated) value of the variable . Fig. 6c shows the ratio of the passing rates for the IB and DE components,
| (2) |
To determine the DE amplitude in Eq. (1) (under the assumption that the DE amplitude in Eq. (1) is equal to zero) the experimental distribution was fitted by the method of least squares with the function
| (3) |
where is the background contamination obtained from the Monte Carlo simulated and events only, and are the IB and DE components obtained from the Monte Carlo simulated events without the contamination of the background decay modes, and are free parameters in the fit. This method allows to avoid the systematic errors [20] due to the “migration” of the events on the Dalitz plot because of the finite experimental resolution.
5 Results
The result of the least squares fit of Eq. (3) to the distribution is illustrated in Fig. 7, where the corrected experimental ratio
| (4) |
of the DE and IB components for the decay is shown as a function of in the region of 55 to 90 MeV.
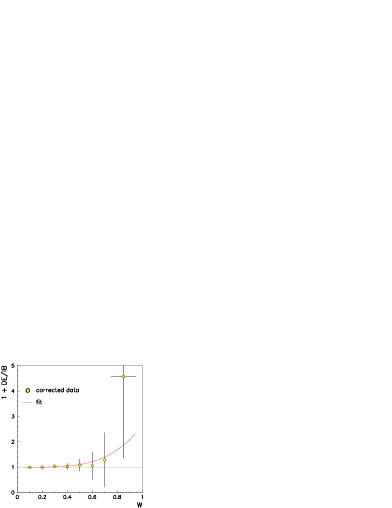
In Eq. (4), the correction factor given by Eq. (2) takes into account the detector imperfection, the term takes into account the contamination of the background decay modes, and the fitted value of provides the normalization. The curve in Fig. 7 is predicted by Eq. (1) with the fitted value of the amplitude (given by the fitted value of ) and with .
From the least squares fit with the value of , the direct emission component was obtained to be
,
%
under the assumption that there is no interference component. Then, comparing this with the theoretical value of the inner bremsstrahlung branching ratio, = 2.6110-4 [8], the direct emission branching ratio was determined to be
for the decay in the region of 55 MeV 90 MeV. Here the first errors are statistical and the second ones are systematic.
In the determination of the systematic uncertainty of the following sources of systematics were investigated.
-
–
The branching ratios and matrix elements of the background decay modes used in the Monte Carlo simulation were varied within their errors ( = 0.01).
-
–
The variations of the signal and background components in the Monte Carlo simulation were allowed ( = 0.06).
-
–
The upper edge of the decay vertex position was varied along the setup axis between the chamber PC1 and the calorimeter SP2 ( = 0.03).
-
–
The electromagnetic showers in the calorimeter SP2 were not used in the photon reconstruction ( = 0.01).
-
–
The particle identification of the secondary track was not used ( = 0.02).
-
–
The energy threshold of the selected photons was varied from the value of 0.8 GeV to 2 GeV ( = 0.02).
-
–
The variations of the angular and mass deviation cuts were applied ( = 0.03).
-
–
The event selection was done with different restrictions applied to the relative transverse positions of the SP1 photons with respect to the secondary track extrapolation ( = 0.04).
-
–
The allowed intervals for the ratios and were varied ( = 0.05).
6 Summary and conclusion
The branching ratio for the direct photon emission in the decay in the region of 55 MeV 90 MeV has been measured using the ISTRA+ spectrometer. The results of our measurement and the previous experiments [9 –13] on the decays are presented in Fig. 8.
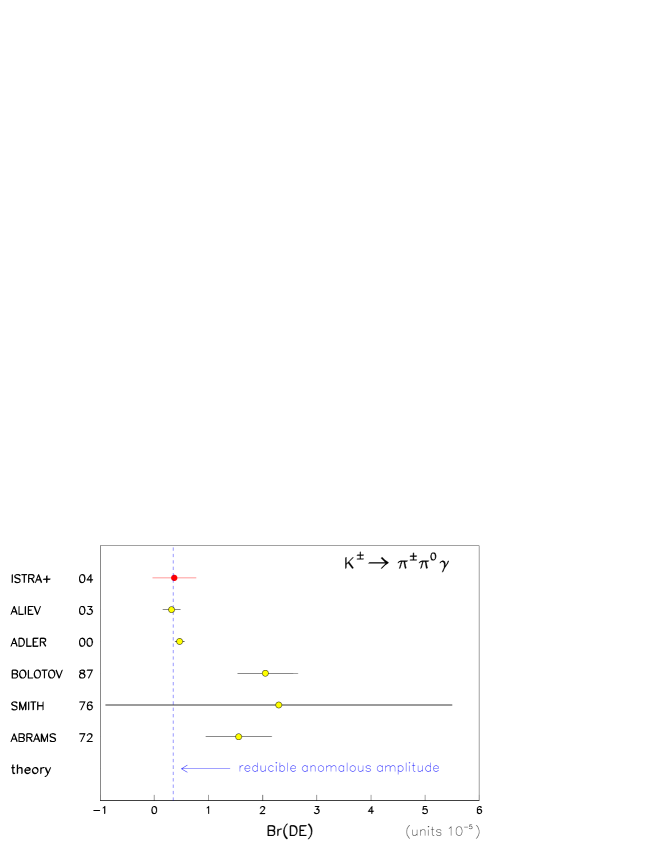
Our value of the branching ratio is consistent with the average value of (0.440.08)10-5, obtained from the results of the stopped-kaon experiments [12, 13], but it differs by 2.5 standard deviations from the average value of (1.80.4)10-5, obtained from the results of the in-flight-kaon experiments [9 –11].
The theoretical prediction for , under the assumption that the direct photon emission is entirely due to the reducible anomalous amplitude [2], is also shown in Fig. 8 for the same region. Our result supports the hypothesis that the dominant contribution to the direct photon emission is due to the pure magnetic transition given by the reducible anomalous amplitude and the other magnetic and electric amplitudes are small or cancelled.
The work is supported by the RFBR grant No. 03-02-16330.
References
-
[1]
S.L. Adler, Phys. Rev., 177 (1969) 2426;
J.S. Bell, R. Jackiw, Nuovo Cimento, 60A (1969) 47;
W.A. Bardeen, Phys. Rev., 184 (1969) 1848. - [2] G. Ecker, H. Neufeld, A. Pich, Phys. Lett., B278 (1992) 337.
-
[3]
J. Bijnens, G. Ecker, A. Pich, Phys. Lett., B286 (1992) 341;
G. Ecker, H. Neufeld, A. Pich, Nucl. Phys., B413 (1994) 321. - [4] F.E. Low, Phys. Rev., 110 (1958) 974.
- [5] J.D. Good, Phys. Rev., 113 (1959) 352.
- [6] H.-Y. Cheng, Phys. Rev., D42 (1990) 72.
-
[7]
J. Wess, B. Zumino, Phys. Lett., B37 (1971) 95;
E. Witten, Nucl. Phys., B223 (1983) 422. - [8] G. D’Ambrosio, M. Miragliuolo, P. Santorelli, in: L. Maiani at el. (Eds.), The DANE Physics Handbook, Vol. 1, INFN–LNF, Frascati, 1992, p. 231; and references therein.
- [9] R.J. Abrams et al., Phys. Rev. Lett., 29 (1972) 1118.
- [10] K.M. Smith et al., Nucl. Phys., B109 (1976) 173.
-
[11]
V.N. Bolotov et al., Yad. Fiz., 45 (1987) 1652;
V.N. Bolotov et al., Sov. J. Nucl. Phys., 45 (1987) 1023. - [12] S. Adler et al., Phys. Rev. Lett., 85 (2000) 4856.
- [13] M.A. Aliev et al., Phys. Lett., B554 (2003) 7.
- [14] V.N. Bolotov et al., Preprint IHEP 95-111, Protvino, 1995.
-
[15]
I.V. Ajinenko et al., Yad. Fiz., 65 (2002) 2125;
I.V. Ajinenko et al., Phys. At. Nucl., 65 (2002) 2064;
I.V. Ajinenko et al., Phys. Lett., B574 (2003) 14;
O.P. Yushchenko et al., Phys. Lett., B589 (2004) 111. -
[16]
I.V. Ajinenko et al., Yad. Fiz., 66 (2003) 107;
I.V. Ajinenko et al., Phys. At. Nucl., 66 (2003) 105;
O.P. Yushchenko et al., Phys. Lett., B581 (2004) 31. - [17] I.V. Ajinenko et al., Phys. Lett., B567 (2003) 159.
- [18] R. Brun et al., Preprint CERN-DD/EE/84-1.
- [19] Particle Data Group, K. Hagiwara et al., Phys. Rev., D66 (2002) 010001.
- [20] V.B. Anikeev, V.P. Zhigunov, Phys. Part. Nucl., 24 (1993) 989.