****** Start of file apssamp.tex ******
SLAC–PUB–10774
October 2004
Direct Measurements of and using Vertex/Kaon Charge Tags at SLD∗
Koya Abe,(25) Kenji Abe,(15) T. Abe,(22) I. Adam,(22) H. Akimoto,(22) D. Aston,(22) K.G. Baird,(11) C. Baltay,(31) H.R. Band,(30) T.L. Barklow,(22) J.M. Bauer,(12) G. Bellodi,(17) R. Berger,(22) G. Blaylock,(11) J.R. Bogart,(22) G.R. Bower,(22) J.E. Brau,(16) M. Breidenbach,(22) W.M. Bugg,(24) D. Burke,(22) T.H. Burnett,(29) P.N. Burrows,(19) A. Calcaterra,(8) R. Cassell,(22) A. Chou,(22) H.O. Cohn,(24) J.A. Coller,(4) M.R. Convery,(22) V. Cook,(29) R.F. Cowan,(13) G. Crawford,(22) C.J.S. Damerell,(21) M. Daoudi,(22) S. Dasu,(30) N. de Groot,(2) R. de Sangro,(8) D.N. Dong,(13) M. Doser,(22) R. Dubois,(22) I. Erofeeva,(14) V. Eschenburg,(12) E. Etzion,(30) S. Fahey,(5) D. Falciai,(8) J.P. Fernandez,(27) K. Flood,(11) R. Frey,(16) E.L. Hart,(24) K. Hasuko,(25) S.S. Hertzbach,(11) M.E. Huffer,(22) X. Huynh,(22) M. Iwasaki,(16) D.J. Jackson,(21) P. Jacques,(20) J.A. Jaros,(22) Z.Y. Jiang,(22) A.S. Johnson,(22) J.R. Johnson,(30) R. Kajikawa,(15) M. Kalelkar,(20) H.J. Kang,(20) R.R. Kofler,(11) R.S. Kroeger,(12) M. Langston,(16) D.W.G. Leith,(22) V. Lia,(13) C. Lin,(11) G. Mancinelli,(20) S. Manly,(31) G. Mantovani,(18) T.W. Markiewicz,(22) T. Maruyama,(22) A.K. McKemey,(3) R. Messner,(22) K.C. Moffeit,(22) T.B. Moore,(31) M. Morii,(22) D. Muller,(22) V. Murzin,(14) S. Narita,(25) U. Nauenberg,(5) H. Neal,(31) G. Nesom,(17) N. Oishi,(15) D. Onoprienko,(24) L.S. Osborne,(13) R.S. Panvini,(28) C.H. Park,(23) I. Peruzzi,(8) M. Piccolo,(8) L. Piemontese,(7) R.J. Plano,(20) R. Prepost,(30) C.Y. Prescott,(22) B.N. Ratcliff,(22) J. Reidy,(12) P.L. Reinertsen,(27) L.S. Rochester,(22) P.C. Rowson,(22) J.J. Russell,(22) O.H. Saxton,(22) T. Schalk,(27) B.A. Schumm,(27) J. Schwiening,(22) V.V. Serbo,(22) G. Shapiro,(10) N.B. Sinev,(16) J.A. Snyder,(31) H. Staengle,(6) A. Stahl,(22) P. Stamer,(20) H. Steiner,(10) D. Su,(22) F. Suekane,(25) A. Sugiyama,(15) A. Suzuki,(15) M. Swartz,(9) F.E. Taylor,(13) J. Thom,(22) E. Torrence,(13) T. Usher,(22) J. Va’vra,(22) R. Verdier,(13) D.L. Wagner,(5) A.P. Waite,(22) S. Walston,(16) A.W. Weidemann,(24) E.R. Weiss,(29) J.S. Whitaker,(4) S.H. Williams,(22) S. Willocq,(11) R.J. Wilson,(6) W.J. Wisniewski,(22) J.L. Wittlin,(11) M. Woods,(22) T.R. Wright,(30) R.K. Yamamoto,(13) J. Yashima,(25) S.J. Yellin,(26) C.C. Young,(22) H. Yuta.(1)
(1)Aomori University, Aomori, 030 Japan, (2)University of Bristol, Bristol, United Kingdom, (3)Brunel University, Uxbridge, Middlesex, UB8 3PH United Kingdom, (4)Boston University, Boston, Massachusetts 02215, (5)University of Colorado, Boulder, Colorado 80309, (6)Colorado State University, Ft. Collins, Colorado 80523, (7)INFN Sezione di Ferrara and Universita di Ferrara, I-44100 Ferrara, Italy, (8)INFN Laboratori Nazionali di Frascati, I-00044 Frascati, Italy, (9)Johns Hopkins University, Baltimore, Maryland 21218-2686, (10)Lawrence Berkeley Laboratory, University of California, Berkeley, California 94720, (11)University of Massachusetts, Amherst, Massachusetts 01003, (12)University of Mississippi, University, Mississippi 38677, (13)Massachusetts Institute of Technology, Cambridge, Massachusetts 02139, (14)Institute of Nuclear Physics, Moscow State University, 119899 Moscow, Russia, (15)Nagoya University, Chikusa-ku, Nagoya, 464 Japan, (16)University of Oregon, Eugene, Oregon 97403, (17)Oxford University, Oxford, OX1 3RH, United Kingdom, (18)INFN Sezione di Perugia and Universita di Perugia, I-06100 Perugia, Italy, (19)Queen Mary, University of London, London, E1 4NS United Kingdom, (20)Rutgers University, Piscataway, New Jersey 08855, (21)Rutherford Appleton Laboratory, Chilton, Didcot, Oxon OX11 0QX United Kingdom, (22)Stanford Linear Accelerator Center, Stanford University, Stanford, California 94309, (23)Soongsil University, Seoul, Korea 156-743, (24)University of Tennessee, Knoxville, Tennessee 37996, (25)Tohoku University, Sendai, 980 Japan, (26)University of California at Santa Barbara, Santa Barbara, California 93106, (27)University of California at Santa Cruz, Santa Cruz, California 95064, (28)Vanderbilt University, Nashville,Tennessee 37235, (29)University of Washington, Seattle, Washington 98105, (30)University of Wisconsin, Madison,Wisconsin 53706, (31)Yale University, New Haven, Connecticut 06511.
Abstract
Exploiting the manipulation of the SLC electron-beam polarization, we present precise direct measurements of the parity violation parameters and in the boson– quark and boson– quark coupling. Quark/antiquark discrimination is accomplished via a unique algorithm that takes advantage of the precise SLD CCD vertex detector, employing the net charge of displaced vertices as well as the charge of kaons that emanate from those vertices. From the 1996-98 sample of 400,000 decays, produced with an average beam polarization of 73.4%, we find and
Submitted to Physical Review Letters
∗ Work supported in part by Department of Energy contract DE-AC02-76SF00515
Measurements of fermion production asymmetries at the pole determine the extent of parity violation in the coupling. At Born level, the differential cross section for the process can be expressed as a function of the polar angle of the fermion relative to the electron beam direction,
where is the longitudinal polarization of the electron beam ( for predominantly right-handed polarized beam). The parameter , where is the vector (axial vector) coupling of the fermion to the boson, expresses the extent of parity violation in the coupling.
From the conventional forward-backward asymmetries formed with an unpolarized electron beam (), such as that used by the CERN Large Electron-Positron Collider (LEP) experiments, only the product of parity-violation parameters can be measured Abbaneo et al. (2000). With a longitudinally polarized electron beam, however, it is possible to measure independently of by fitting simultaneously to the differential cross sections of Eq. (1) formed separately for predominantly left- and right-handed beam. The resulting direct measurement of is largely independent of propagator effects that modify the effective weak mixing angle, and thus is complementary to other electroweak asymmetry measurements performed at the pole.
In this Letter, we present measurements of and based on the use of the invariant mass of displaced vertices to select and events. The charge of the underlying quark is determined via a unique algorithm that exploits the net charge of the displaced vertices, as well as the charge of tracks emanating from the vertices that are identified as kaons.
The operation of the SLC with a polarized electron beam has been described elsewhere et al (1997). During the 1996-98 run, the SLC Large Detector (SLD) et al (1996, 2001) recorded an integrated luminosity of 14.0 pb-1, at a mean center-of-mass energy of 91.24 GeV, and with a luminosity-weighted mean electron-beam polarization of Abe et al. (2000).
The SLD measures charged particle tracks with the Central Drift Chamber (CDC), which is immersed in a uniform axial magnetic field of 0.6T. The VXD3 vertex detector provides an accurate measure of particle trajectories close to the beam axis. For the 1996-98 data, the combined () impact parameter resolution of the CDC and VXD3 is 7.8 (9.7) m at high momentum, and 34 (34) m at = 1 GeV/c, where is the momentum transverse to the beam direction, and () is the coordinate perpendicular (parallel) to the beam axis. The combined momentum resolution in the plane perpendicular to the beam axis is . A Cerenkov Ring-Imaging Detector (CRID) K. Abe et al. (1990), using a combination of liquid and gaseous radiators, allows efficient separation in the range for tracks with . The thrust axis is reconstructed using the Liquid Argon Calorimeter, which covers the angular range . We employ a Monte Carlo (MC) simulation of the production and detection processes that makes use of the JETSET 7.4 event generator Sjostrand (1994), the QQ p:c (unpublished) package for hadron decay specially tuned to match the CLEO inclusive production distributions L. Gibbons et al. (1997) and the ARGUS particle production distributions H. Albrecht et al. (1989), and the GEANT 3.21 framework Brun et al. (1987) for the simulation of the SLD detector.
Events are classified as hadronic decays if they: (1) contain at least seven well-measured tracks (as described in Ref. et al (1996)); (2) exhibit a visible charged energy of at least 18 GeV; (3) have a thrust axis polar angle satisfying ; and (4) have a thrust magnitude greater than 0.8 (to suppress events with both heavy hadrons in the same hemisphere). Vertex identification is done using a topological algorithm Jackson (1997), enhanced via the application of a neural-network selection based on the flight distance and angle of the reconstructed vertexWright (2002). According to the MC, secondary vertices are found in 72.7% of bottom-quark, 28.2% of charm-quark, and 0.41% of light-quark event hemispheres.
Due to the cascade nature of decays, tracks from the decay may not all originate from the same space point. An independent neural network, exploiting the location of the point of closest approach of the track to the line connecting the primary and secondary vertices Wright (2002), is used to attach tracks with two or more VXD hits that are not already included in the secondary vertex. ‘VXD-only’ tracks with three or more VXD hits, but no CDC segment, are also considered for attachment; if attached, the fit vertex location is used as an additional space point to improve the charge determination.
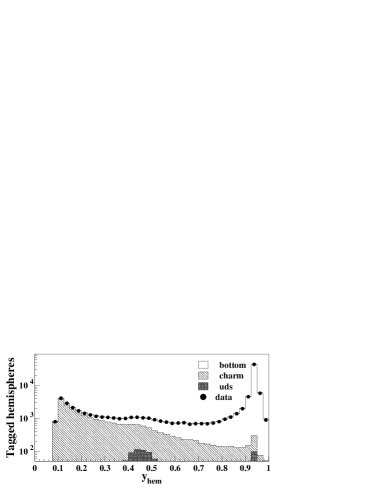
A final neural network, making use of the -corrected vertex mass () Abe et al. (1998), the total momentum of the vertexed tracks (), the flight distance from the IP to the vertex, and the number of tracks in the vertex Wright (2002), is used to discriminate between bottom and charm events. The output of this neural net is shown in Figure 1.
The analysis makes use of two mutually exclusive tags. The -tag, optimized to select hemispheres, requires and GeV/. The -tag, optimized to select requires and GeV/. From the MC simulation, we find that 84% (98%) of events with one (two) -tagged hemisphere(s), and no -tagged hemispheres, are decays, while 97% (100%) of events with one (two) -tagged hemisphere(s) are decays.
Within tagged hemispheres, two quantities are used to discriminate quark from antiquark production: the net charge of all vertexed tracks () and the net charge of all vertex tracks that are identified as kaons (). The presence of a quark is indicated by or for the -tag, and for the -tag; for this latter tag, the kaons do not make a significant additional contribution. If an or -tagged hemisphere cannot be assigned a nonzero charge using these methods, or if an -tag has both and nonzero and in disagreement, it is treated as untagged. The resulting charge distributions are shown in Figure 2.

By comparing the tagging and sign-determination results between hemispheres in data events, it is possible to determine most of the per-hemisphere tagging efficiencies and their correct-sign probabilities for the tags Wright (2002). The fractions of single- (), double- (), mixed (), single- () and double- () tagged events are sensitive to the hemisphere tagging efficiencies; a maximum likelihood fit to these fractions is used to constrain the values of , , , and (Table 1), assuming Standard Model (SM) values for the fraction () of () events from annihilation at the pole. The hemisphere correct-sign probabilities , , and (Table 1) are constrained by a similar fit to the fractions of oppositely-signed hemispheres in , , and events, using the previously determined tagging efficiencies as input.
In constraining the tagging efficiencies and correct-sign probabilities from the inter-hemisphere tagging and signing information, it is necessary to account for inter-hemisphere correlations that alter the nominal relationship between single-hemisphere and full-event tagging and charge signing performance. MC studies confirm that, for vertex-based tagging and signing, inter-hemisphere correlations are due primarily to correlation in the energy and angle of the hadrons containing the heavy quarks, and from events for which both heavy hadrons are produced in the same hemisphere. To account for these effects, we have used the MC simulation to explore the dependence of the tagging and signing parameters as a function of the number of heavy hadrons in the hemisphere, and of the polar angle and energy (after restricting to hemispheres with a single heavy hadron) of the heavy hadron. The effects of the inter-hemisphere correlations can then be accounted for by convolving these dependences with the distributions of the number, energy, and polar angle of heavy hadrons within and opposite to tagged hemispheres, as described in Wright (2002). Ignoring these effects would incorrectly lower and by approximately 1.5% of their subsequent fit values.
| , -tag | 0.121 | 0.1150.002 | 0.932 | 0.9180.010 |
|---|---|---|---|---|
| , -tag | 0.020 | 0.0220.001 | 0.545 | 0.5430.031 |
| , -tag | 0.005 | 0.0060.002 | — | — |
| , -tag | 0.323 | 0.3250.002 | 0.807 | 0.8210.005 |
The fit for the parameter makes use of events with at least one -tagged hemisphere and neither -tagged, while the fit uses events with at least one H tag. Events with two L or two H tags are discarded if the charges in the two hemispheres are in disagreement. For events with one H and one L tag, only the H tag is used to sign the thrust axis. From the MC simulation, we find that 84% (98%) of events with one L tag (two L tags) are events, while 97% (100%) of events with one H tag (two H tags) are events.
Unbinned maximum-likelihood fits are performed to the Born-level differential cross section:
| (1) |
where is the polar angle of the signed thrust axis, and the electron beam polarization is signed so that for right-handed electrons. The fitted effective asymmetry is given by the sum over the flavor composition of the sample:
| (2) |
where is the fraction of and the correct-signing probability for the flavor , calculated separately for single- and double-tagged events, making use of the values in Table 1 when possible. For the light flavor contribution, the simulated mistag rates are used for , while is set to (uniform probability between 0 and 1). Mechanisms for developing a charm signal in the -tagged sample tend to favor incorrect charge assignment Wright (2002), leading to the assumption . Because events at larger values of carry larger statistical weights in the fits, but poorer overall tagging qualities, the MC simulation is used to parameterize these values as a function of . Failing to account for this effect would incorrectly lower the fitted values of and by 1-2%.
The corrections for gluon radiation are evaluated as in Abbaneo et al. (1998). The corrections are evaluated in Abbaneo et al. (2000) as 4.5%(3.8%) for () events, using the calculation in Catani and Seymour (1999) based on the parton thrust axis (we ignore the hadronization corrections of Abbaneo et al. (2000) since they are implicit in our signed thrust axis analyzing power). Additionally, the analysis procedure suppresses events with hard gluon radiation, and so these results are further scaled by factors of 0.270.13(0.530.08) for (), as determined by the MC simulation.
The terms correct the asymmetries for the effects of initial-state QED radiation and interference, and are determined by ZFITTER Bardin et al. (2001) to be and .
From a sample of 9970 events, using the SM value as input, we obtain , while from a sample of 25917 events, using the Standard Model value of as input, we obtain .
We have explored a number of potential sources of systematic error; these are summarized in Table II. For both and , the dominant systematic uncertainty arises from the limited statistics available for the calibration of the purity of the flavor-selected sample, and of the correct-sign tagging probability of the sample, resulting in a relative systematic uncertainty of () for (). By studying a sample enriched in quark production ( GeV/c2 and GeV/c), the fake-vertex efficiency is constrained to be within 25% of its MC expectation, leading to uncertainties of () on ().
The procedure for calibrating the sample purity and correct-signing probabilities is subject to uncertainties in the correlation between the quark and antiquark energies, and in the fraction of events for which the quark and antiquark appear in the same hemisphere. Comparisons between data and MC of the correlation between the heavy hadron energies in -quark and -quark enriched samples constrain the and hadron energy correlations to be within 2.6% and 0.3% of their MC expectation (Table II), while comparisons of samples enhanced in three-jet production showed the same-hemisphere production rates to be within 1.1% and 0.7% of their MC expectations. The resulting overall uncertainty in () due to tagging correlations is found to be 0.6% (0.3%).
The correction coefficients for hard gluon radiation (‘QCD corrections’) are subject to uncertainties in , quark masses, and missing higher order terms, given by Abbaneo et al. (2000) as for both . The determination of the scale factor applied to account for the selection bias against events with hard gluon radiation is limited by Monte Carlo statistics to () for (). The resulting overall uncertainty in the QCD correction is () for ().
Adding all sources of systematic error in quadrature, we find
| (3) | |||||
| (4) |
Averaging these results (V) with complementary results for using momentum-weighted track charge (Q) Abe et al. (2003) and the charge of identified kaons from secondary vertices for data prior to 1996 (K) Abe et al. (1999a), for using fully-reconstructed charmed-meson decays (D) Abe et al. (2001), and for and together using identified leptons (L) Abe et al. (1999b), we arrive at the overall SLD average of systematic correlations between the measurements were taken into account via the Best Linear Unbiased Estimator (BLUE)
| (5) | |||||
| (6) |
independent of the extent of parity violation in the coupling of the electron to the boson, consistent with the Standard Model expectations of and .
Alternatively, and can be extracted from LEP measurements of the unpolarized heavy-quark forward-backward asymmetries via the relation . The values Abe et al. (1999b) and , from fits solely to LEP data, combined with the value Abe et al. (1999b) derived from leptonic forward-backward and leptonic polarization asymmetries measured at LEP and SLD, determine the heavy-quark coupling parity violation parameters to be and , consistent with the direct measurements provided by the polarized differential cross-section data from SLD.
We thank the staff of the SLAC accelerator department for their outstanding efforts on our behalf. This work was supported by the U.S. Department of Energy (in part by Contract No. DE-AC02-76SF00515), the U.S. National Science Foundation, the UK Particle Physics and Astronomy Research Council, the Istituto Nazionale di Fisica Nucleare of Italy and the Japan-US Cooperative Research Project on High Energy Physics.
References
- Abbaneo et al. (2000) D. Abbaneo et al. (LEP Electroweak Working Group), CERN-EP-2000-016 (2000).
- et al (1997) K. Abe et al., Phys. Rev. Lett. 78, 2075 (1997).
- et al (1996) K. Abe et al., Phys. Rev. D53, 1023 (1996).
- et al (2001) K. Abe et al., Ann. Rev. Nucl. Part. Sci. 51, 345 (2001).
- Abe et al. (2000) K. Abe et al., Phys. Rev. Lett. 84, 5945 (2000), eprint hep-ex/0004026.
- K. Abe et al. (1990) K. Abe et al., Nucl. Instrum. Meth. A343, 74 (1994).
- Sjostrand (1994) T. Sjostrand, Comput. Phys. Commun. 82, 74 (1994).
- p:c (unpublished) QQ - The CLEO Event Generator, http://www.lns.cornell.edu/public/CLEO/soft/QQ (unpublished).
- L. Gibbons et al. (1997) L. Gibbons et al., Phys. Rev. D56, 3783 (1997).
- H. Albrecht et al. (1989) H. Albrecht et al., Z. Phys. C44, 547 (1989).
- Brun et al. (1987) R. Brun, F. Bruyant, M. Maire, A. C. McPherson, and P. Zanarini, Tech. Rep. CERN-DD/EE/84-1 (1987).
- Jackson (1997) D. J. Jackson, Nucl. Instrum. Meth. A388, 247 (1997).
- Wright (2002) T. Wright, SLAC-R-602 (2002).
- Abe et al. (1998) K. Abe et al., Phys. Rev. Lett. 80, 660 (1998).
- Abbaneo et al. (1998) D. Abbaneo et al. (LEP Heavy Flavor Working Group), Eur. Phys. J. C4, 185 (1998).
- Catani and Seymour (1999) S. Catani and M. H. Seymour, JHEP 07, 023 (1999), eprint hep-ph/9905424.
- Bardin et al. (2001) D. Bardin et al., Comput. Phys. Commun. 133, 229 (2001), eprint hep-ph/9908433.
- Abe et al. (2003) K. Abe et al., Phys. Rev. Lett. 90, 141804 (2003), eprint hep-ex/0208044.
- Abe et al. (1999a) K. Abe et al., Phys. Rev. Lett. 83, 1902 (1999a).
- Abe et al. (2001) K. Abe et al., Phys. Rev. D63, 032005 (2001), eprint hep-ex/0009035.
- Abe et al. (1999b) K. Abe et al., Phys. Rev. Lett. 83, 3384 (1999b).
- systematic correlations between the measurements were taken into account via the Best Linear Unbiased Estimator (BLUE) Statistical correlation coefficients were found to be , , , , , for the measurement, and , , for the measurement. systematic correlations between the measurements were taken into account via the Best Linear Unbiased Estimator (BLUE) algorithm described by L. Lyons. , D. Gibaut, and P. Clifford, Nucl. Instr. Meth. A270, 110 (1988).
- Abe et al. (1999b) D. Abbaneo et al. (LEP Electroweak Working Group), eprint hep-ex/0412015, December, 2004.
TABLE II: Relative systematic errors for the and measurements, in percent (%). A ‘+’ (‘-’) sign indicates that increases (decreases) if the true value of the parameter is larger than expected. Corrections to the Monte Carlo tracking efficiency and resolution simulation have been determined from data; “Remove” refers to the difference in the result for when the corrections are not applied.
| source | variation | ||
|---|---|---|---|
| Calibration statistics | |||
| data statistics | 2.96 | 1.41 | |
| data statistics | 0.68 | 0.63 | |
| EW parameters | |||
| 0.17230.0031 | -0.18 | +0.07 | |
| 0.21630.0007 | +0.25 | -0.24 | |
| 0.6670.027 | n/a | +0.04 | |
| 0.9350.021 | -0.06 | n/a | |
| Detector modeling | |||
| tracking efficiency | remove | -0.36 | +0.34 |
| tracking resolution | remove | -0.49 | +0.04 |
| CRID mis-ID | data | -0.12 | +0.00 |
| QCD correction | |||
| 0.0063 | +0.18 | +0.35 | |
| 0.13, 0.08 | +0.59 | +0.31 | |
| Backgrounds | |||
| 0.250.14 | +0.83 | -0.56 | |
| 2.960.38% | +0.22 | +0.01 | |
| 0.2540.051% | +0.06 | -0.02 | |
| fake vertex | 25% | +0.13 | -0.01 |
| fake vertex | 0.6 | -0.43 | -0.09 |
| Tagging correlations | |||
| same-hemisphere | 2.821.13% | +0.33 | -0.01 |
| same-hemisphere | 2.450.74% | -0.04 | +0.21 |
| energy correlation | 1.42.6% | +0.48 | -0.14 |
| energy correlation | 1.40.3% | -0.07 | +0.10 |
| Other | |||
| Beam polarization | 0.5% | -0.50 | -0.50 |
| MC statistics | 1 | 0.64 | 0.34 |
| Total | 3.48 | 1.89 |