Comparison of Three-jet Events in Collisions at TeV to Predictions from a Next-to-leading Order QCD Calculation
Abstract
The properties of three-jet events with total transverse energy greater than 320 GeV and individual jet energy greater than 20 GeV have been analyzed and compared to absolute predictions from a next-to-leading order (NLO) perturbative QCD calculation. These data, of integrated luminosity 86 pb-1, were recorded by the CDF Experiment for collisions at TeV. This study tests a model of higher order QCD processes that result in gluon emission and can be used to estimate the magnitude of the contribution of processes higher than NLO. The total cross section is measured to be pb. The differential cross section is furthermore measured for all kinematically accessible regions of the Dalitz plane, including those for which the theoretical prediction is unreliable. While the measured cross section is consistent with the theoretical prediction in magnitude, the two differ somewhat in shape in the Dalitz plane.
In perturbative QCD, hard scattering of the constituent partons in the proton and antiproton results in events with large total transverse energy, . Outgoing scattered partons hadronize and may be detected as hadronic jets. Three-jet events can be produced when a hard gluon is radiated from any of the initial, intermediate, or final state partons in an event with two primary outgoing partons.
We analyze here some properties of the cross section for three-jet event production in proton-antiproton collisions at the Fermilab Tevatron Collider at center-of-mass energy 1.8 TeV. The data, which were recorded by the Collider Detector at Fermilab (CDF) [1], are compared with predictions by the first complete next-to-leading order (NLO) QCD generator, Trirad [2], for hadronic three-jet production at hadron colliders. We compare the measured and predicted absolute cross sections to test our understanding of the higher order QCD processes that result in gluon emission and to estimate the magnitude of the contribution of processes higher than NLO.111While no quantitative estimate of the contribution of next-to-next-to-leading order processes to the cross section is available at this time, considerable progress has recently been made in calculating two loop parton processes [3], important groundwork for the future. In some kinematical regions, we provide a measurement of the cross section where the theoretical prediction is not reliable; this measurement may be a useful guide for theoretical calculations. We also compared the shapes of the measured and predicted cross sections when normalized, to examine the sensitivity of the cross section to variations in the value of the strong coupling, . The data sample corresponds to an integrated luminosity of 86 pb-1 collected during the 1994-1995 run (Run 1b).
A previous paper [4] examined a smaller dataset and was limited to a comparison with leading order theoretical calculations [5]. A subsequent analysis [6] compared a larger dataset to predictions from the HERWIG [7] parton shower Monte Carlo program and to the NJETS [8] leading order parton-level prediction. The NLO calculation used here has the benefit of reduced renormalization scale dependence (and consequently lower systematic uncertainty) as well as a more reliable description of multijet production throughout phase space. This study expands upon the previous investigations by comparing the data to absolute cross section predictions. The measurements presented here include differential cross sections that may be useful constraints upon parton distribution functions.
We use a coordinate system with the axis along the proton beam, transverse coordinate perpendicular to the beam, azimuthal angle , polar angle , and pseudorapidity . The analysis uses the CDF calorimeters [9], which cover the pseudorapidity range . The calorimeters are constructed in a tower geometry and are segmented in depth into electromagnetic and hadronic components. The calorimeter towers are 0.1 unit wide in . The tower widths in are in the central region and for greater than approximately 1.2.
We begin by considering events from the data sample selected by the trigger requirement 175 GeV. We refer to this 175 GeV as below. Event reconstruction uses a cone algorithm [4] described in more detail below. The transverse energy is defined as , where is the scalar sum of energy deposited in the calorimeter within a particular cone and is the angle between the beam direction in the laboratory frame and the cone axis. All calorimeter energy clusters [4] in the event with 10 GeV are summed. The three leading jets in the laboratory frame are used as the basis of transformation into the three-jet rest frame. In the three-jet rest frame, the incoming partons are, by convention [10], labeled partons 1 and 2, and their momenta are designated and , respectively. The highest energy jets in this frame have energies labeled , , and and are ordered such that . The outgoing partons associated with these jets are correspondingly labeled partons 3, 4, and 5.
A three-jet system in the massless parton approximation can be uniquely described by five independent variables (see Figure 5 in [11]). We use the following:
-
1.
the invariant mass of the three-jet system,
-
2.
the cosine of the angle between the average beam direction () and parton 3 in the three-jet rest frame:
-
3.
the cosine of the angle between the plane containing the average beam direction and parton 3 and the plane containing partons 3, 4, and 5 in their center of mass frame:
-
4.
the Dalitz variable (see below) for the leading jet, and
-
5.
the Dalitz variable (see below) for the next-to-leading jet.
The invariant is calculated by sorting jets by their energies in the laboratory frame, boosting to the rest frame of those with the three highest energies, re-sorting jets by energy in that frame, then computing , where the are the energies of jets 3, 4, and 5 in the rest frame. We have investigated the probability that a jet with energy less than the weakest of the three jets in the laboratory frame may have an energy greater than in the 3-jet rest frame from which it is excluded by this algorithm. The restriction imposed by the cut on full trigger efficiency (see below) makes this probability negligible.
The Dalitz variables, , are defined as . Momentum conservation restricts the ranges of the Dalitz variables to
A set of trigger and offline requirements [12] rejects events associated with cosmic rays, beam halo, and calorimeter malfunctions. Events are required to have a reconstructed primary vertex, defined as the vertex with the largest (where is the total momentum of particle i leaving the vertex in the event), within 60 cm. Events are defined to have resolved multiple interactions if a second vertex with at least ten associated tracks is reconstructed in the vertex track detector, and if that vertex is separated from the primary one by at least 10 cm. Because multiple interactions can change the jet multiplicity in an event, for example, misidentifying two-jet events as three-jet events, events with resolved multiple interactions are removed. The number of events with unresolved multiple interactions in which an additional jet could be misidentified is estimated to be less than 2% so no correction for them is applied. The resulting effective total integrated luminosity of the data sample is 774 pb-1, where the uncertainty reflects both the overall luminosity uncertainty (4.2%) and the uncertainty (0.5%) associated with the removal of resolved multiple interactions.
An iterative cone algorithm [4] with cone radius is used to identify jets. Here and . The subscripts 1 and 2 correspond to the axes of the cone and calorimeter tower, respectively.
Jets that share towers are combined if the total of the shared towers is greater than 75% of the of either jet; otherwise the towers are assigned to the nearest jet. Jet energies are corrected [4] for errors in the absolute and relative energy scales and for additional energy associated with the underlying event. Since partons that are radiated out of the cone lead to the same losses in the theoretical calculation and in the data, out-of-cone corrections are not applied. The of a jet is calculated from the reconstructed position of the primary event vertex. All three leading jets are required to have 20 GeV and 2.0. Events with fewer than three jets are rejected. To avoid collinear soft gluon instability in the iterative jet clustering algorithm [13], a cone overlap cut is imposed: events are rejected if the distance in - space between the axes of any two of the three leading jets is less than 1.0 (see Figure 5 of [4], which shows that this selection requirement reduces to approximately zero the probability of the two jets being merged by the clustering algorithm). To exclude regions in which the geometrical acceptance [11] is less than about 95%, we require , where is the mass of the two leading jets in the three-jet system and is defined analogously to .
We require full trigger efficiency, which occurs when 320 GeV, where the sum is over the three highest energy jets in the event with corrected 20 GeV [14]. The data are compared to the theoretical prediction by sorting events into bins of size in - space, the Dalitz plane. Figure 1 shows the Dalitz distribution of data that remain after all of the selection requirements have been applied.

Before the final binning is done, the data are corrected for the effects of the combination of detector resolution and energy mismeasurement. A correction factor is determined for each bin in the plane as follows. A sample of events is generated at the parton level with the HERWIG Monte Carlo. The final state partons are hadronized. The events are then binned in the Dalitz plane. The same events are next passed through the CDF detector simulation and rebinned. For each bin the ratio of the number of events after and before detector simulation is computed. This ratio (ranging from 0.85 to 1.5) is the factor subsequently used to correct the number of events in each data bin. The data are also corrected for the -vertex cut efficiency and then normalized to the effective total luminosity.
The principal sources of systematic uncertainty [15] on the cross section are those on the absolute and relative (-dependent) jet energy scales. The uncertainty on absolute jet energy derives from the resolution on the calibration of the calorimeter (uncertainty 1.3%-1.8%, and -dependent), the uncertainty associated with choice of jet fragmentation model (decreasing from 1.7% to 1.2% with increasing ), the uncertainty associated with calorimeter stability over time (1%), and the uncertainty on the correction for the contribution of the underlying event (1 GeV). The uncertainty on the relative jet energy scale ranges from 2% to 6%. Uncertainties are also associated with the measurement of the effective total integrated luminosity (4.2%) and with the -vertex cut efficiency (2%). There is also an uncertainty of less than 5% associated with the implementation of simulated events in the correction procedure. The upper (lower) limits on these uncertainties are added (subtracted) from the four-momenta of the jets in the data sample to obtain the systematic uncertainties on the cross section associated with each contribution. The uncertainties are then combined to produce the total experimental systematic uncertainty.
The Trirad calculation consists of parton processes at one loop and parton processes at tree level. For gluons , incoming quarks , and outgoing quarks or , the subprocesses involved are , , , and those related by crossing symmetry, all computed to one loop; and , , , and and the crossed processes computed at tree level. The program uses the “subtraction improved” [13] phase space slicing method to implement infrared cancellation.
The cross section is predicted with the CTEQ4M [16] parton distribution function (PDF) for each bin in the Dalitz plane. The result is multiplied by the effective total integrated luminosity of the data to predict a number of events in each bin. We restrict the prediction to bins for which ; this is necessary as the perturbative expansion is not reliable where the three-jet configuration approaches a two-jet configuration. The comparison between the data and the calculation is made for 215 bins.
Figure 2 compares Dalitz distributions of the data and the absolute theoretical prediction. The theoretical distribution is more strongly peaked—a trend that persists in comparisons with all members of the CTEQ4 family222The CTEQ4 family includes CTEQ4A1, CTEQ4A2, CTEQ4M, CTEQ4A5, and CTEQ4A6, which differ in the value of input to their global fit, and CTEQ4HJ, for which a higher statistical emphasis was given to the high data from CDF. of PDFs. This trend, in which the edges of the Dalitz plane are more populated by data than by the prediction, may give some indication of the size of the higher order contributions to the cross section.

The data and theory are compared in two different ways. In Figure 3, we compare the shapes of their Dalitz distributions by normalizing the data and theory predictions to the same number of events. In Figure 4, we normalize theory to the experimental luminosity and compare the absolute values of the cross sections that are observed and predicted. In both figures, the prediction is made using the CTEQ4M parton distribution function, and the difference between observed and predicted number of events, scaled by the number of predicted events, is computed.
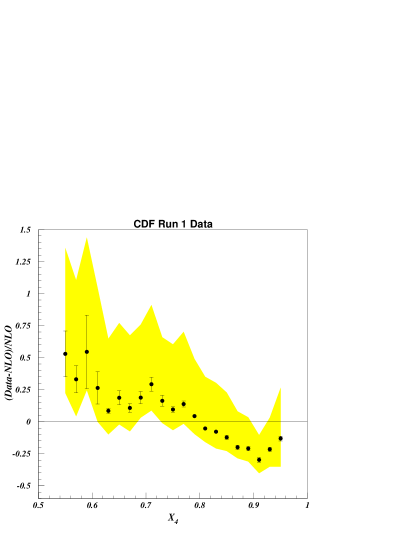
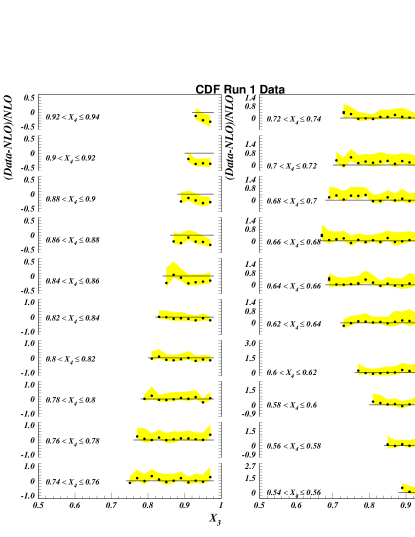
The theoretical prediction for the cross section, using CTEQ4M and all bins in the Dalitz plane but those with , is pb. The theoretical uncertainty associated with choice of renormalization and factorization scales, and respectively, is estimated by varying the scales, whose default value is , to values of and while keeping . The theoretical uncertainty associated with choice of PDF is estimated from the spread in the predictions generated with all members of the CTEQ4 family. The measurement is not sensitive to the value of as is also shown in [17]. The measured cross section, using all bins in the Dalitz plane but those with , is 4583(stat.)(syst.) pb. This is consistent with the theoretical prediction and with a previous CDF measurement [14] after corrections are made for the efficiencies of additional cuts introduced in this analysis. The measured cross section, using all bins in the Dalitz plane, is 4663(stat.)(syst.) pb.
The measurements at high may provide useful constraints on future theoretical models in that region. It appears that up to NLO the theory predicts more soft radiation than the data have in the region where the primary partons are approximately back-to-back. The data, especially in the region above where a perturbative expansion is not reliable, may be useful input to theoretical models of gluon-emission processes.
We thank William Kilgore and Walter Giele for providing us with the code that computes the next-to-leading order calculation, and for their guidance concerning its use. We acknowledge the Center for High Performance Computing at the University of New Mexico and the University of Wisconsin Condor Project for providing a combined 26,000 CPU-hours for the Trirad NLO computations. We thank the Fermilab staff and the technical staffs of the participating institutions for their vital contributions. This work was supported by the U.S. Department of Energy and National Science Foundation; the Italian Istituto Nazionale di Fisica Nucleare; the Ministry of Education, Science, Sports and Culture of Japan; the Natural Sciences and Engineering Research Council of Canada; the National Science Council of the Republic of China; the Swiss National Science Foundation; the A. P. Sloan Foundation; the Bundesministerium fuer Bildung und Forschung, Germany; and the Korea Science and Engineering Foundation.
References
- [1] CDF Collaboration, F. Abe et al., Nucl. Instr. and Meth. A 271, 387 (1988).
- [2] W. Kilgore and W. Giele, Hadronic Three Jet Production at Next-to-Leading Order, LANL-HEP-PH/9903361 (1999).
- [3] C. Anastasiou et al., Nucl. Phys. B601, 341 (2001); C. Anastasiou et al., Nucl. Phys. B605, 486 (2001); E.W.N. Glover and M.E. Tejeda-Yeomans, JHEP 05, 010 (2001).
- [4] CDF Collaboration, F. Abe et al., Phys. Rev. D 45, 1448 (1992).
- [5] Z. Kunszt and E. Pietarinen, Nucl. Phys. B164, 45 (1980); T. Gottschalk and D. Sivers, Phys. Rev. D 21, 102 (1980); F. Berends et al., Phys. Lett. 118B, 124 (1981).
- [6] CDF Collaboration, F. Abe et al., Phys. Rev. D 54, 4221 (1996).
- [7] G. Marchesini and B. Webber, Nucl. Phys. B310, 481 (1988).
- [8] F.A. Berends et al., Nucl. Phys. B333, 120 (1990); F.A. Berends et al., Phys. Lett. B 232, 266 (1990); F.A. Berends and H. Kuijf, Nucl. Phys. B 353, 59 (1991).
- [9] L. Balka et al., Nucl. Instr. and Meth. A 267, 272 (1988); S. Bertolucci et al., Nucl. Instr. and Meth. A 267, 301 (1988).
- [10] UA1 Collaboration, G. Arnison et al., Phys. Lett. B 158, 494 (1985).
- [11] S. Geer and T. Asakawa, Phys. Rev. D 53, 4793 (1996).
- [12] CDF Collaboration, F. Abe et al., Phys. Rev. Lett. 62, 1825 (1989).
- [13] W.B. Kilgore and W.T. Giele, Phys. Rev. D 55, 7183 (1997).
- [14] CDF Collaboration, F. Abe et al., Phys. Rev. Lett. 80, 3461 (1998).
- [15] CDF Collaboration, F. Abe et al., Phys. Rev. Lett. 77, 438 (1996); CDF Collaboration, F. Abe et al., Phys. Rev. Lett. 70, 1376 (1993); CDF Collaboration, F. Abe et al., Phys. Rev. Lett. 77, 5336 (1996); CDF Collaboration, D. Cronin-Hennessy et al., Nucl. Instr. and Meth. A 443, 37 (2000).
- [16] CTEQ Collaboration, H.L. Lai et al., Phys. Rev. D 55, 1280 (1997).
- [17] See also J. Pumplin et al., JHEP 0207, 012 (2002).