Precision planar drift chambers and cradle for
the TWIST muon decay spectrometer
Abstract
To measure the muon decay parameters with high accuracy, we require an array of precision drift detector layers whose relative position is known with very high accuracy. This article describes the design, construction and performance of these detectors in the TWIST (TRIUMF Weak Interaction Symmetry Test) spectrometer.
keywords:
DME , Drift chambers , Muon decayPACS:
29.40.Gx , 14.60.Ef , 13.35.Bv , 13.10.+q, , , , , , , , , , ,
1 Introduction
Muon decay involves only the weak interaction and is a major input to the Standard Model. The TWIST (TRIUMF experiment E614) results will provide a test of these inputs and provide an excellent window in which to search for physics beyond the Standard Model. The aim of the TWIST experiment is to measure the muon decay parameters , , , and from muon decays with accuracies 10 to 40 times better than existing data [1]. This will be achieved by measuring, with high precision, the energy and angle distribution of positrons (over a wide range) from the decay of polarized muons. TWIST utilizes the M13 beam line at TRIUMF to transport beams of 29.6 MeV/c surface muons from pion decay-at-rest into the TWIST spectrometer. These polarized muons [2] pass through a gas degrader and a foil degrader, which fine tune the muon energy, so that they pass through the first half of the spectrometer and stop in a target at the centre.
TWIST will measure, for the first time, all muon decay parameters simultaneously, and will do so by recording two dimensional (momentum and angle) distributions of the decay positrons.
2 Overview
Figure 1 is a conceptual view of the TWIST spectrometer. The superconducting solenoid has an inner diameter of 100 cm and a length of 223 cm. There are eight drift-chamber (DC) modules in each half of the spectrometer, for a total of 44 drift planes. These 16 DC modules are the main tracking elements of the TWIST spectrometer. At the upstream and downstream ends of the stack there are two proportional chamber (PC) modules, each having four MWPC planes. The target module, at the centre of the spectrometer, is a somewhat similar MWPC, but with the target foil acting as the central cathode. The twenty-two drift chamber layers and six MWPC layers are positioned both upstream and downstream of the muon stopping target, in a highly symmetrical pattern.
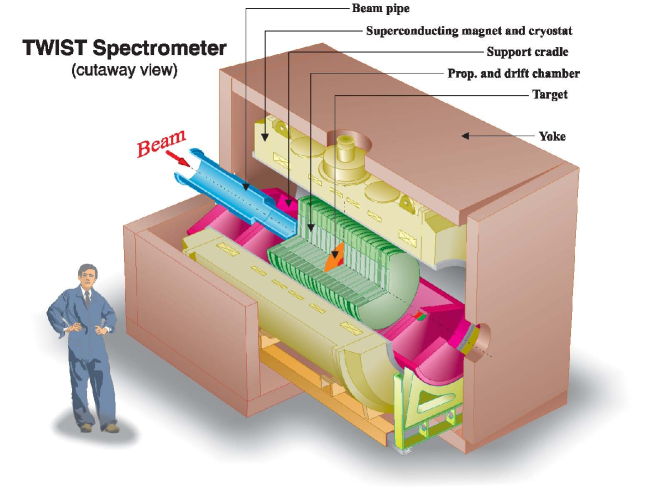
An external steel yoke was required to produce the highly uniform two Tesla axial field for the DC tracking volume. This yoke was modeled with OPERA-3d, then fabricated. It is 20 thick at the top and sides, and 8 thick at the ends. The downstream end of the yoke is hinged for easier access.
Figure 2 shows two field maps for the typical operating strength of 2.00 Tesla. The upper plot shows the field map on the beam axis (), the lower plot shows the field at a radius of 165 , at the edge of the tracking volume. Within this tracking DC volume (, ), the measurements determine the variations of the field as a function of position to gauss. It is uniform over the full volume to 80 G (full width). It has also been mapped at 1.96 Tesla and 2.04 Tesla.

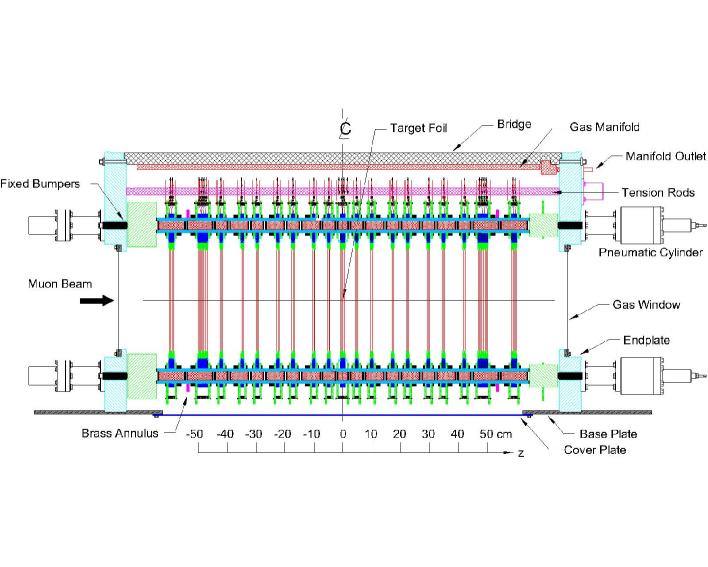
Figure 3 shows a side section view of the TWIST detector stack and the cradle that contains them. The 19 modules are compressed against the upstream end of the cradle by four custom built pneumatic cylinders (see Sections 3 and 8).
To measure the muon decay parameters with the proposed precisions, specific requirements must be met for; chamber resolution, precision of individual chamber construction, and precision of wire-plane positioning (especially in the direction).
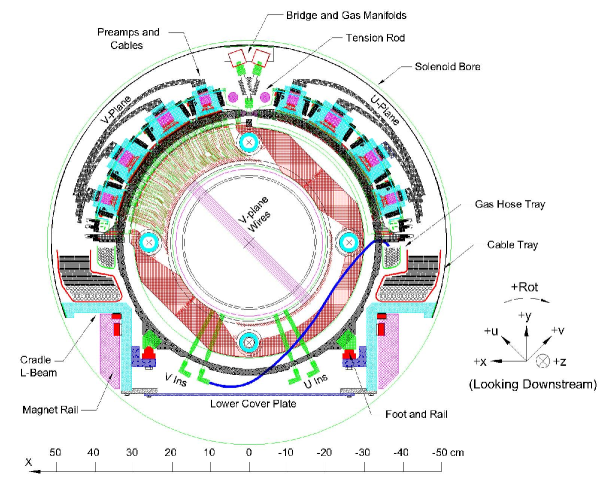
With 44 drift-chamber layers distributed over a tracking length of 1,000 , the positioning of the wire planes and thermal effects were major concerns for the spectrometer design. Figure 4 shows a front section view of a DC module within the cradle and magnet rail structure (only a few wires shown). A V layer is shown within the circular FR4 (flame resistant G10) gas box, and the coordinate system is indicated.
To position each wire plane and cathode foil as accurately as possible in the direction, each module layer (including gas box base and lid) contains a set of four high precision ceramic spacers of a Russian material known as Sitall CO-115M [3] (similar to Zerodur [4]). These materials were developed for telescopes and are made from a mixture of glass in two different states. The resultant material has an extremely small coefficient of thermal expansion () and can be machined and polished to optical flatness. This, combined with Sitall’s good strength (elastic modulus Pa) allows us to accurately determine each wire plane’s position.
Monte Carlo [5] estimates show that to measure the muon decay parameters with an accuracy of about a systematic error of not more than in reconstructed muon decay positron energy, , and angle, , is also required. The energy losses of the muon decay positrons along the axis of the spectrometer are proportional to and do not depend on the (,) positions of the stopped muons. This means that the true maximum positron energy, due to a muon decay, from a muon stopped in the target MeV can be calculated from the equation (where is an energy loss at ). Therefore an absolute energy calibration of the spectrometer can be defined from the muon decay spectrum itself. However, it is essential that the detector system is very precisely manufactured. Following is an estimate of systematic errors due to manufacturing accuracy. The major source of problems would be a systematic error in our length scales in the , , or directions.
The Monte Carlo study shows that a systematic shift in the location of the U wires in the direction of causes a bias in the three muon decay parameters of , , and . Since we determine the positions of all our wire planes in to (see Section 3), our error corresponds to a muon decay parameter bias of . Sitall’s very small thermal coefficient makes TWIST effectively insensitive (in the direction) to temperature. Sitall’s good strength means that the operating force of 1,470 N from a pneumatic cylinder compresses the 1000 column of Sitalls (extent of DC modules) by about (see Section 8). The cylinders have an uncertainty due to their O-ring friction of N, but this corresponds to only , or .
A systematic shift of or causes a similar bias in the muon decay parameters. This corresponds to an uncertainty of the pitch of the wires, or rather, the cumulative uncertainty in wire position across the 320 active area of the wire planes. Our wire planes are fabricated on glass substrates (see Section 6 for fabrication details) and surveying of many wire planes indicates that the width of the 320 wire plane varies only (see Section 3). This variation corresponds to which also leads to an insignificant bias in the muon decay parameters. Over 320 , the glass plate expands , so and are not highly sensitive to temperature.
Monte Carlo studies also showed that the wire positions within each wire plane should be known to less than RMS. While the positions of the wire planes in (,) can be verified, with calibration runs using high energy beam pions, the angles are too small to determine their positions. It is clear that the geometry of the TWIST spectrometer exceeds the mechanical tolerances required for this demanding experiment.
3 Chamber design
The layout and the materials of the TWIST drift chambers were chosen to minimize the effect of multiple scattering and energy loss of both the incoming muons and the positrons leaving the target from muon decay. Low mass was also a key requirement of the chambers because the incoming surface muons have a range of only (carbon equivalent). Helium/nitrogen () flows through the cradle and between the modules, and the first and last cathode foils in each module were also required to act as the module gas windows.
After several GARFIELD [6] studies, and successful prototyping, we chose a simple multi-wire design, where each DC chamber consists of eighty diameter sense wires at a pitch of 4.0 , plus two guard wires on each side. The cathode-to-cathode distance is also 4.0 . The cathodes are thick doubly aluminized Mylar foil. To keep them as flat as possible, all cathode foils were stretched to a high tension of N/m and a high precision gas system was designed, which maintains the differential pressure between the module gases and helium/nitrogen to mTorr (see Section 9).
Dimethylether (DME) was chosen as the working gas for DCs. It has some very attractive properties; low Lorentz angle, low atomic number, good resolution and excellent quenching abilities. Due to concerns of wire chamber aging and materials compatibility [7], a long duration aging study was carried out to test all component materials in single-wire test chambers with DME. Suitable materials were found and this damage study has been published [8].
All 44 DCs are identical (fabricated as X layers), but become U or V layers depending on how they are mounted inside the modules. U wires are tilted +45 degrees from vertical, (looking downstream), V wires at -45 degrees. There are seven (UV) modules on either side of the target module and an eight detector-layer module (VUVUUVUV), designated the dense-stack (DS), at each end of the DC tracking volume. The DC layers start at and extend to .
At the upstream and downstream ends of the stack there are two PC modules with configuration (UVUV). These play a central role in our pattern recognition process. These fast detectors (CF4/isobutane) provide discrimination amongst the various tracks that pass through the detector (muon, decay positrons, additional muons and/or decays, beam positrons, delta rays, etc.).
The target module, at the centre of the spectrometer, has a somewhat similar (UVUV) configuration, but with the target foil acting as the central cathode. This module plays an important role. The first two detector layers (TG#1 and TG#2) impose fiducial constraints on the () coordinates of the muon stopping location. These allow us to know that all decays are fully contained within the tracking region. The third TG#3 provides a veto so that any muons that stop past the target foil are eliminated. The muon yields in TG#1 vs TG#4 (from the tails of the stopping distribution) provide a sensitive estimate of the mean stopping location in the target foil, to a precision of .
The target and PC modules have a sense-wire pitch of 2 . CF4/isobutane was chosen for these modules, since it has high drift velocity and Lorentz angle is not a concern. The target layers extend from to . The PC layers start at and extend to .
Each wire plane is fabricated on a 3.18 thick 60 diameter circular glass plate, having a thin printed circuit board (PCB) laminated on the top surface. The four 4 thick Sitalls are glued into holes in the glass plate (see Figs. 4 and 5). The wires are strung at the top Sitall surface and a cathode foil sub-assembly positioned at the mid-Sitall point. An extra cathode foil is required to complete each module. This cathode only layer (CO), is also fabricated on a glass plate and uses the same cathode foil sub-assembly.
As mentioned in Section 2, the gas box base and lid also contain a set of four Sitall spacers. The result is that each module layer is in contact at the Sitalls. In the cradle, the modules touch each other only at their first and last Sitall surface. When the stack of 19 modules is pressed towards the upstream cradle endplate, the force ensures good Sitall-to-Sitall contact (see Section 8).
Our Sitalls typically had surfaces which were flat and parallel to . Within the thickness groups (4, 8, 20 and 40 ), the variation in individual Sitall thickness was m. All Sitalls thicknesses were measured and they were arranged in sets of four. Within each set the thickness variation was . The Sitall thickness data is used to determine the position of each wire plane. In addition, the compression of the Sitalls (in the cradle) frictionally locks each wire plane position in the (,) coordinate plane. The actual position of each wire plane is determined by fitting straight tracks from 120 MeV/c pions during calibration runs (see Section 12).
With the wire planes fabricated on glass substrates, the (,) positions of wires is less sensitive to temperature (as mentioned in Section 2). With a coefficient of thermal expansion of , the 320 wide wire planes expand .
Figure 4 shows a V layer within the circular FR4 gas box. The 80 sense wire signals pass through the gas box wall to nearby preamps, the output signals travel on mini-coax cables collecting in a cable tray on either side. These cable trays are removable, to allow removal of the cradle and detectors from the seven racks of readout electronics and other services.
The many 0.25” polyethylene gas input lines (one per detector layer) collect in two smaller permanent trays. These gas lines pass between and under the modules to inlet fittings that are accessible when the lower cover plate is removed. Within the modules, flat polyester “straws” inject the gas between the detector layers to the active areas. The module gas outlets are at the top and connect with soft neoprene bellows to two gas manifolds, one for DME, the other for CF4/isobutane.
Each module has two 6.35 thick FR4 feet, one flat and one V-shaped. These feet are doweled and screwed to the gas box base, they support and position the modules in the spectrometer by means of flat and V-shaped rails within the cradle support structure (see Section 8). Two large longitudinal L-shaped beams give the cradle great stiffness. The cradle rolls in and out of the solenoid on the large magnet rails (see Section 8).
During data taking, the 19 modules are immersed in helium/nitrogen () gas. The addition of the small amount of nitrogen is necessary to prevent HV breakdown on the module exteriors. Each module was tested for HV breakdown in this gas mixture as part of the fabrication quality control (QC).
4 The (UV)A module
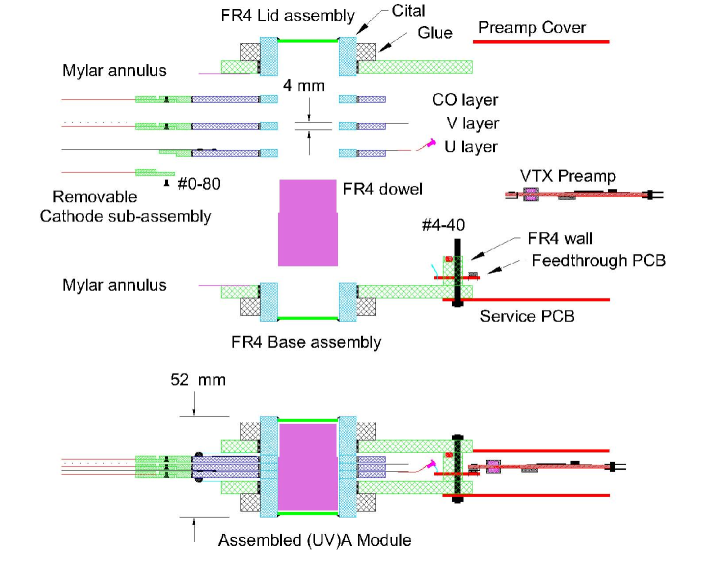
Figure 5 shows two section views of the (UV)A module (one disassembled). Section 5 describes the four other module types (two DC and two PC), but many of the design features of the (UV)A are common to all the module types.
The (UV)A module consists of five component layers:
-
1.
FR4 gas box base.
-
2.
U plane (U).
-
3.
V plane (V).
-
4.
Cathode-Only plane (CO).
-
5.
FR4 gas box lid.
4.1 Gas box base
The gas box base consists of a circular FR4 plate (6.35 thick and diameter). This plate has curved FR4 wall pieces laminated to it, building a full circular wall. In the U and V readout arcs, the wall contains 1.6 thick feedthrough printed circuit boards (PCBs), which transfer the 80 sense-wire signals (at HV) from the detector layer to the two 24-channel and two 16-channel preamplifiers mounted just outside the wall. These feedthrough PCBs also bring HV and pulser signals into the module.
A set of four 20 long Sitalls is also glued into holes in the base plate. Since the base and lid are bolted together at the O-ring seal, we were concerned that warps in the 6.35 thick FR4 plates would result in the gas box warping on final assembly. To avoid this, bases and lids of gas boxes are not swapped around, but stay as a pair. They are bolted together first, then the Sitalls are glued into the base. Finally, stacks of Sitalls are added inside the gas box to give the correct internal distance (12 for the (UV) modules). The Sitalls are then glued into the lid. In this way, the assembled gas box should have coplanar Sitall surfaces. Approximately 1 inside the outer surface of these Sitalls, 1.6 thick FR4 disks are permanently glued, making a gas seal. The top surface of the gas box wall contains an O-ring in a groove to seal against the gas box lid.
An FR4 dowel is inserted into each base Sitall, forming four posts onto which the other component layers are installed. For the (UV)A module, these four dowels protrude 11 into the module, then narrow and fit more loosely into the lid plate Sitalls.
The Sitall IDs are , and the dowel ODs are . If each of the four Sitalls in each detector layer were positioned perfectly, this would allow a relative movement of base, U and V layers of . In practice the movement was .
The gas box wall also contains two 0.25” Swagelok gas inlet fittings (one for each wire plane) and a 0.5” Swagelok fitting for the module gas outlet. Two 1.6 thick service PCBs are bolted to the gas box base. Each covers 82 degrees of arc in the area of the preamps and extend beyond the gas box wall. These PCBs have preamp mounting guides, grounding and the preamp power bus (+4 V).
It would have been convenient if the gas box base (and lid) could have had their own window foils glued across their central cutouts. Unfortunately, this option was ruled out by considerations of multiple scattering and the mass budget for the incoming muons. Instead, a thick Mylar annulus is permanently glued to the inner edge of these two FR4 plates. These Mylar pieces protrude 40 into the central cutout of the FR4 plates, but stop 4 outside the active area. After the module is assembled, these two Mylar pieces are glued to the U layer glass plate and CO layer PCB with latex rubber. This forms a mechanically soft gas seal and is easily removable. Latex rubber was chosen, after tests with other synthetic rubbers (silicones and urethanes) showed extremely high aging rates with DME ( per cm of wire) [8].
4.2 U plane
The U drift plane, as shown in Figs. 4 and 5, consists of one wire plane and one cathode foil sub-assembly.
This layer has four 4 thick Sitalls positioned accurately and glued into holes in a 3.18 thick 60 diameter circular glass plate. On the upper surface of the glass plate, a thin (180 ) PCB is laminated. This thin PCB has the solder-pad pattern for the wires, and traces from the pads to where flexible output Kapton/Cu ribbon cables are soldered. When the U drift plane is positioned inside the gas box base (on the FR4 dowels) the ribbon cables are plugged into connectors on the gas box feedthrough PCB. No solder connections are required. Section 6 describes the fabrication of the wire plane in detail.
There is an attached cathode foil sub-assembly within the central cutout of the glass plate (see Section 6). Both surfaces of the aluminized Mylar foil are clamped against copper surfaces and cross-connected. This foil connection is also brought out on two Kapton/Cu ribbon cables to the gas box wall PCB.
4.3 V plane
The V drift plane is identical to the U drift plane, simply positioned at 90 degrees to the U plane and on top of it.
4.4 Cathode-only plane
The cathode-only plane (CO) is similar to wire plane layers, in that it has four 4 Sitalls, a glass plate and a cathode foil sub-assembly. The PCB is however far simpler, since there is no wire plane and only two Kapton/Cu ribbon cable connections of the foil to the gas box wall PCB.
With only between the glass/PCB layers of the U, V and CO sub-layers, proper flushing of the two approximately 103 cc active volumes was a significant design concern. Our solution was to make flat polyester-film straws, that directly inject the chamber gas into these active volumes. These straws have a heat sealed edge and are permanently glued to the inlet gas fitting on the inside surface of the gas box wall. They are 10 wide in the flat region and extend to the active volumes of the U and V plane. During module assembly, the two straws are easily bent out of the way, the U plane installed, its straw laid down on it, then the V plane and its straw, then the CO plane. This simple and reliable system ensures good flushing of the active areas of the chambers.
4.5 Gas box lid
The gas box lid plate is simpler than the gas box base, with only four 20 long Sitalls and the 6.35 thick FR4 sheet (with Mylar annulus). As mentioned in Section 4.1, these Sitalls are glued in the FR4 lid plate in association with the gas box base. The lid is bolted down to the gas box base, forming a gas seal against the O-ring in its groove. As with the gas box base, there are 1.6 thick FR4 discs glued into the ends of the Sitalls to form gas seals. After module assembly, a latex rubber seal is made to the nearest detector layer (the CO).
5 The other four module types
The (UV)A drift module was described in Section 4. There are four other module types in the TWIST spectrometer, they are all based on the same simple structure. They are:
5.1 (UV)B module
This is also a drift chamber module (DC) using DME gas. It is almost identical to the (UV)A module. The only difference is that it has 40 long Sitalls in the gas box base instead of 20 . By alternating (UV)A and (UV)B modules, for the first seven modules on either side of the target, we produce a better tracking chamber pattern.
5.2 Dense stack
This is also a drift chamber module using DME gas. Like the (UV)B, it has 40 Sitalls in the gas box base and 20 Sitalls in the gas box lid. However, the wall of the gas box base is approximately three times as tall and, in the two readout regions, has feedthrough PCBs for four wire planes instead of one. Instead of having three detector layers inside the gas box (U,V and CO), the dense stack has nine detector layers (VUVUUVUV and CO). The pattern break in the center is meant to reduce tracking ambiguities. Of course, the FR4 dowels are 24 longer as well and there are eight gas inlet fittings and straws instead of two.
5.3 PC module
This module uses four PC wire planes instead of two DC planes. It has a taller gas box wall, with two feedthrough PCBs in each readout area. There are four gas inlets and straws. The five sub-layers in the gas box are UVUV and CO. The Sitalls in the gas box lid and base are all 40 long.
The PC wire plane has 160 sense wires, and three guard wires each side, all strung at 2 pitch. This gives an active area of 320 diameter. The central 32 wires are individually read out to better handle the incoming muon beam and the remainder are read out in groups of four wires, to reduce the number of readout channels needed. There are 64 readout channels for each PC plane, using four 16-channel preamps. CF4/isobutane was chosen for the PCs, since it has high drift velocity and the Lorentz angle is not a concern.
5.4 Target module
The target module is the most specialized module in the TWIST spectrometer. The five sub-layers in the gas box are UVUV and CO. Each of the wire planes has its own cathode foil sub-assembly, so there are five cathodes and four wire planes. The major difference of the target module is that the central cathode is also the experimental muon stopping target.
Each target wire plane has 48 sense wires and three guard wires on each side, all strung at 2 pitch, and use CF4/isobutane gas. The 48 sense wires are all individually read out, giving an active area of 96 diameter.
This module’s main function is to define beam particles entering and exiting the target. Since the axial field confines the low emittance beam particles to small radii, the smaller active area is sufficient.
The major target of interest for TWIST is high purity aluminum of thickness about 70 . However, high purity aluminum () foil was not available in the required size. Also, aluminum is far less elastic than Mylar and tests indicated that a foil 340 in diameter was not flat enough to act as a wire-plane cathode. A smaller diameter sub-assembly was also not an option, since we wished to keep the mass in this region as low as possible. Therefore, for the initial study of the TWIST spectrometer, the target was 125 thick Mylar with carbon [9] on each side (thickness between 5 and 20 ), for a total of , which has similar stopping power to 70 aluminum.
The target foil sub-assembly is fabricated similar to the usual 6.35 thick aluminized Mylar. The carbon-painted Mylar was stretched and glued between the same two 1.6 thick FR4 discs to make a foil sub-assembly. When this sub-assembly is attached to the second U plane, the foil is against the usual FR4 retaining ring, glued into the glass plate (see Section 6). Because of its greater thickness, this foil is not perfectly centered between the adjacent V and U wire planes. For the second U plane, the distance is the usual 1997 (2 minus half the foil thickness) and the wire plane is symmetrically placed between the adjacent cathode foils. However, for the first V plane, the wire plane to target foil distance is less than usual and the wire plane is effectively off-center. Since these wire planes are not used for precision tracking, this was acceptable.
While the Mylar target was in use, we developed a new technique for the aluminum target foil. This uses a stretched Mylar foil with a central cutout. A small diameter aluminum foil is then glued over this hole. The Mylar is 25 thick doubly aluminized, with a 120 diameter hole, and effectively acts as a spring to keep the aluminum foil tensioned and flat. The aluminum foil is 150 in diameter, so there is a 15 overlap glue region. TRA-CON conductive silver epoxy is used to ensure electrical connection to the Mylar foil. The aluminum foil is thick and the purity is [10]. To avoid any problems with this glue region, we also inserted a pair of 25 thick Kapton masks in each of the wire planes adjacent the target foil. These masks eliminate gas gain elsewhere and have a central cutout 110 in diameter. Only the central region of the target planes is of interest (their active width is only 96 ), so these masks do not affect the target module performance.
The end result is a target module with a well-tensioned high purity central aluminum target foil and an active area of about 100 diameter; but still having low mass out to 330 diameter. The resultant combination foil has worked very well. By choosing which side of the Mylar the aluminum foil is glued on, and using 39 thick spacers, we were able to position the center of the aluminum foil mid-way between the V and U wire planes. Now both these wire planes are closer to the target foil than their other foil, but the difference is only 32 instead of the 139 for the earlier Mylar/carbon target.
5.5 Mirror modules
The aim of the TWIST spectrometer is to be as symmetric as possible with respect to the central target foil. We therefore decided that the nine modules on either side of the target module should be mechanically mirrored, i.e., they should all have their gas box lid plates facing the central target.
With this in mind, the gas boxes were designed with removable feet. These feet, one flat and one V-grooved, position the module in the cradle. By switching the feet, and rotating about the vertical axis, a gas box can be used in either position. This effectively reduces the different module types from nine to five. However, rotating a module like this effectively turns a U plane into a V plane, and vice versa, introducing an asymmetry. Therefore, while the components are the same, a module is assembled differently if it is to be used in the upstream or downstream half of the spectrometer. For example, a downstream UV module has the first wire plane installed in the module gas box tilted +45 degrees (looking into the open gas box). So a downstream (UV) is assembled (Base, +45, -45, CO, Lid), while an upstream (UV) is assembled (Base, -45, +45, CO, Lid).
5.6 Spare modules
We also produced five fully instrumented spare modules, one of each type; (UV)A, (UV)B, dense stack, target and PC. In the two years since the TWIST spectrometer was commissioned, the performance of the TWIST modules has been excellent. All 3,520 DC wires operated at full efficiency with no dead or hot wires. One PC wire broke at the end of a long period of data taking, thereby requiring the module to be removed and replaced with the spare PC module. The damaged PC module was repaired and is now the spare. The second target module allowed the aluminum target to be installed and the module to be fully tested, ready for a quick replacement in the spectrometer.
6 Wire plane fabrication
As mentioned in Section 3, a TWIST wire plane layer, consists of one wire plane and one removable cathode foil sub-assembly. The wire plane design is based on a 3.18 thick circular glass plate. This plate has a diameter of , with a central cutout of diameter and four smaller diameter holes positioned every 90 degrees and 260 from the center.
The steps to fabricating a wire plane are as follows:
-
1.
Glue thin PCB (180 ) on a glass plate.
-
2.
Glue set of four 4 Sitalls into glass plate.
-
3.
Glue FR4 cathode retaining ring into central cutout of glass plate.
-
4.
String wires above PCB surface.
-
5.
Glue wires to glass plate (glue bumps), rotate winding table to vertical, allow to set overnight.
-
6.
Rotate winding table to horizontal, solder wires to PCB. Trim and clean.
-
7.
Measure wire tensions, replace if .
-
8.
Put wire plane on milling machine. Mill glue and solder bumps to from glass.
-
9.
Measure wire positions in and .
-
10.
Replace wires out of position in .
-
11.
Solder 19 flexible Kapton/Cu ribbon cables on readout edge of PCB.
-
12.
Clean and store until module assembly.
-
13.
Install cathode foil sub-assembly with #0-80 nylon screws.
The removable cathode foil sub-assembly is fabricated by stretching the 6.3 foil, then gluing it to a 1.6 thick FR4 annulus (ID=339 , OD=379 ). When the glue sets, two small dowel holes are cleaned and the Mylar pierced, then a second 1.6 thick FR4 annulus (ID=339 , OD=360 ) is doweled and glued to the other side of the Mylar. When trimmed and cleaned, the resultant assembly is reasonably flat. The foil sub-assembly is attached to the cathode retaining ring by 24 #0-80 nylon screws. The difference in ODs means that the foil surface is clamped against the retaining ring, making the foil position insensitive to the thickness of the FR4. Two “notches” in the larger FR4 annulus allow both sides of the aluminized Mylar to be clamped against copper surfaces, ensuring reliable low impedance connections to the thin PCB laminated on the glass plate. Two flexible Kapton/Cu cables bring these ground connections to the gas box wall feedthrough PCB.
Although the wire planes are mounted as U or V planes in the modules, during fabrication, they are considered as X planes (wires vertical). For step (2), the set of four Sitalls are clamped on a thick glass assembly table which is flat to . For step (3), the incomplete unit is again clamped on the assembly table (only at the Sitalls), the FR4 retaining ring is positioned on glass spacers in the cutout and glued in place. While the wires are strung at the surface height of the 4 Sitalls, the cathode foil retaining ring is positioned as accurately as possible 2 away, at the mid-thickness.
During stringing, the detector layer is clamped down (only at the Sitalls) to a similar thick flat glass winding table. The wire plane is strung using precision glass combs. Stringing was carried out manually, in a class 1000 clean room. The room temperature was held stable within . When positioned from comb-to-comb, the wire is above the PCB surface, so the height of the wires ( position) is set by the glass combs and is therefore precise relative to the Sitall surfaces.
All wire chambers use 15 diameter gold-plated tungsten/rhenium W(Re) sense wires. Lengths of wires vary from 40 in the center of a plane to 23 on the edge. As each wire is strung, one end is soldered to an external pad, then it passes across the two glass combs, and is then tensioned and soldered to another external pad. When the full plane of wires is strung in this way, each wire is glued to the glass plate (just beyond the cutout) with small epoxy glue beads. When this is completed for the whole plane, the winding table is rotated to the vertical position and the glue is allowed to set overnight. In this way, the wire plane is strung horizontally, but finally moved to the vertical, so that gravitational sags of the glass plate do not affect wire positions in . This matches how the wire planes are positioned in the TWIST experiment. The next day, the winding table is rotated back to the horizontal, the wires soldered to the PCB pads and trimmed.
With only between the glass/PCB pieces of the detector layers, the height of the wire solder bumps and glue beads was a problem. Attempts to keep them shallow were a failure and several glass plates were broken in early prototype modules. Our solution was to place the wound wire plane in a milling machine (mounted at the Sitalls), and machine any solder and glue surfaces that were too high. In this way we guaranteed a clearance of .
All drift chamber layers (DCs) are the same, having 80 sense wires, plus 2 guard wires on each side, with a pitch of 4.0 . The PC wire plane, has 160 sense wires, and an active area of 320 diameter. The target wire plane has 48 sense wires, and an active area of 96 diameter. The PC and target planes both have 3 guard wires on each side and a wire pitch of 2.0 . All three wire plane types are wound on the same winding table and with the same procedure.
The fully instrumented spectrometer has 19 modules and required 44 DC planes, 4 target planes, 8 PC planes and 19 CO planes. The five spare modules contain another 12 DC planes, 4 target planes, 4 PC planes and 5 CO planes.
Quality control was carried out during all steps of fabrication. This was essential to ensure reproducible results during the production. The mechanical parameters of every detector layer (dimensions of components, wire tensions and positions, etc.) were measured during production and stored in a data base.
For electrostatic stability at 2000 V, only a 4 g tension is theoretically required for 40 long 15 diameter tungsten wires. We used 35 g weights, well below the g typical breaking tension of 15 W(Re).
Average measured wire tensions are about 31 g, the difference being due to the friction of wires on the winding equipment. The distribution of measured tensions for all 6,784 sense wires on all 56 DC, 12 PC and 8 target layers had an RMS of only 1.25 g. All wires with tension less than 26 g were replaced.
After stringing, machining of the solder and glue bumps, and tension measurement, the position of each wire in the plane is mapped. This is usually only done in the plane of the wires, i.e., the value for two well separated values of (along the wire). However, since we were going to so much effort to control the positions, with glass surfaces and glass combs, etc., we also wanted to measure the position of each wire (at two values of ).
This mapping in and was achieved using a digital readout carriage with two CCD cameras. One camera observed the wire from directly above the plane. The carriage was moved until the wire was centered on a monitor with cross-hairs and the digital scale readout gave directly. To measure the coordinate, a second camera was mounted to view the wire from a 45 degree angle. Using a second monitor and cross-hairs, the difference in the two values of the digital readout gave the position. So, the (,) wire positions on each wire were measured at two values of , 20 apart.
Figure 6 shows wire position residuals (distance from correct location) for a typical DC wire plane, plus the distribution of those residuals. Two measurements were made of this wire plane, by different operators, eight months apart. The first measurement was done immediately after winding. The second was made after replacement of wire number 18 (shown as a star). This figure shows the excellent reproducibility of the measured wire positions and also of the wire replacement (). Tests on a glass ruler with precise diamond cut grooves indicate the measurement accuracy is for .
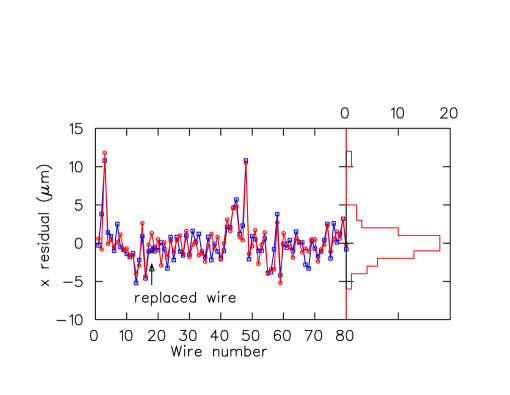
Figure 7 shows the distribution of measured wire position residuals summed for 6,304 wires (from 50 DC planes, 12 PC and 8 target layers), with . These residuals were from the readout side of the wire plane; similar results were obtained on the nonreadout side (20 away in ). A total of 77 wire planes were fabricated (including those in the spare modules), having 6,944 wires. Our database contains all measured () values.

For the 77 wire planes, there are very few wires out of position more than 15 in . As part of our QC, we replaced any wire more than 20 out of position. Only three were missed, all less than . The results demonstrate that our winding equipment has provided high quality wire plane production, despite using many people over a two year production period.
Similarly, Fig. 8 shows the wire position residuals for a typical PC plane in the direction (negative being down). The upper part shows the results for the plane unclamped, the lower part the same wire plane clamped. By clamped, we mean there was force applied to each Sitall, pushing it down against the granite surface of the scanning table. The change is significant. One can see that while the wire-to-wire variation is similar to the measurement, the range of the residuals is much larger, (for unclamped) compared to for the residuals of Fig. 6.

This is understood as follows. During the final stage of stringing (when the glue beads are setting) the wire plane was vertical and bolted firmly (at the Sitalls) to a solid and flat glass plate. However, during the (,) wire position mapping, the wire plane was horizontal and not clamped down. It was therefore subject to flexing and gravitational sag. The calculated gravitational sag of the glass plates (midway between Sitalls) is 17 . But we see in the upper part of Fig. 8, that this unclamped wire plane is not sagging down, but flexing up. The maximum bending of the glass plates due to wire tension loads was calculated using ANSYS [11] to be only 1.3 for a DC plane and 2.6 for a PC plane, this is not significant.
It was found that, because the glass plates were slightly warped, there had been concern that they would touch each other, since the gaps between detector layers are only . To avoid this, weights had been placed on the glass plates during their gluing to their set of Sitalls (step (2) in list). Naturally, when released, they sprang back to their natural shape. During gluing of the cathode retaining rings and stringing, the planes were again clamped to the assembly and winding tables respectively, but during (,) measurement they were unfortunately not clamped.
Figure 8 demonstrates that, when the same wire plane was clamped, the glass plate was forced much flatter again (lower part of figure). It now shows the center of the wire plane lower than the edges, in good agreement with the calculated gravitational sag of 17 . Unfortunately, this wire plane was the only one not in the experiment or in spare modules, so other clamped residual data could not be obtained.
Tests indicate that a load of only 50 N is required on each Sitall to clamp the glass plate to its flattened state. In the cradle, the Sitall columns are compressed with 1,470 N, so we believe all the wire planes are certainly flattened. Also, since the planes are vertical, the 17 gravitational sag should not be present. Our existing maps allow us to determine if any wire is out of position by more than (relative to its neighbors). As part of our QC we replaced any wire that was out of position by more than (relative to its neighbors). Only four wires out of position by more than in were missed.
Few of our 77 wire planes are badly warped in . The wire plane shown in Fig. 8 is among the worst. Most have warps . The summed data of residuals has . This is quite low, considering that even a clamped wire plane has a gravitational sag of 17 (calculated).
7 Bench tests
All modules were bench tested before use in the TWIST spectrometer. Gas gain was measured across each wire plane using an argon/isobutane (25:75) gas mixture and X-rays. This mixture has an operating voltage similar to that of DME.
These tests showed that signal pulse height uniformity is within 20%. The variation is mostly due to increase of anode-cathode gaps in the centers of planes because the outer cathode foils also serve as gas windows and differential pressure between chamber gas and environment was not perfectly zeroed for these tests. Another test was carried out with a 10 mCi uncollimated source in order to check the ability of each plane to hold high voltage with current up to 50 A for at least 30 seconds.
Modules were also tested for gas tightness with helium. For (UV), target, and PC modules, a leak rate less than cc/min was considered acceptable. For the dense stack modules, leak rates cc/min were accepted (see Section 9.3 for details).
Modules were also tested for HV stability in helium/nitrogen (). This was done with pure isobutane in the module to over-quench them and allow testing at higher than operating voltage. All assembled modules have passed these bench tests.
8 Module support - the cradle
The TWIST solenoid has a bore diameter of 1050 . To position the nineteen TWIST detector modules, the cradle was designed to be as rigid as possible, so the positions of wires (in ) are well understood and constant during long periods of data taking. As was seen in Fig. 4 (the front view of DC module in cradle structure), the L-shaped cradle beams and the magnet rails were made as large as possible while allowing the entire structure to be moved up to 10 (in any direction) within the solenoid bore. The cradle and magnet rails are made of aluminum (6061 T6). All screws, bolts and dowels are of non-magnetic titanium or brass.
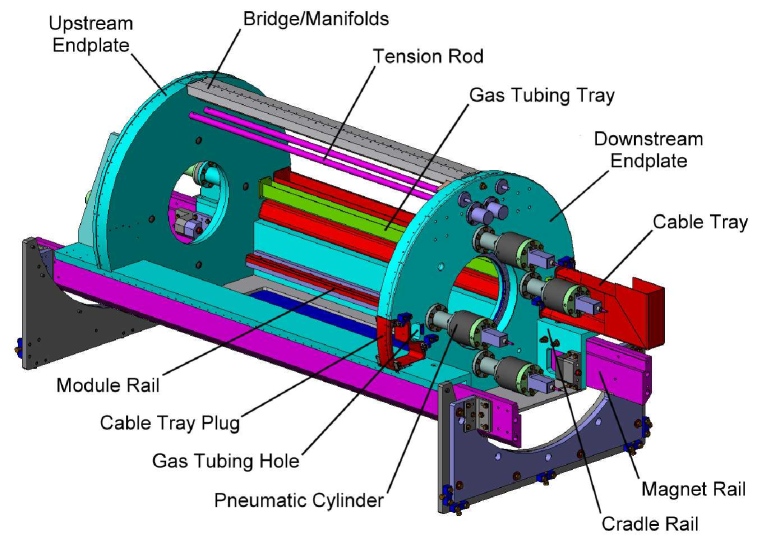
Figure 9 shows a 3d drawing of the cradle and magnet rail structure (not true colors). The two magnet rails are and 265 long. The downstream ends of the rails come almost to the magnet door. When the magnet door is open, an external cart having similar profile beams can be connected to the magnet rails to allow the cradle to roll in or out of the magnet. Seven racks of services associated with the cradle are mounted on a rolling platform. As the cradle is rolled out, this platform is rolled downstream. These services include the HV supplies, postamp/discriminators, +4 V preamp supplies, and the gas system.
The main components of the cradle are the two longitudinal beams, the two endplates, the “bridge” and the tension rods. The beams have an L shape, with the vertical part being 23 high and the horizontal part 18 wide, and both arms are 2.5 thick. On the inside face of each beam, there is a module support rail. As Fig. 4 showed, one of these module rails is V shaped, the other is flat. The insulating feet on the modules (FR4) match these profiles and position each module in the cradle in the () plane (or ()). The cradle beams continue 27 beyond the endplates. Four sets of Be/Cu roller bearings, under the ends of the beams, allow the cradle to roll on the magnet rails during installation or removal. During the final few inches of installation, four 2.54 diameter titanium dowels (rounded tips) on the cradle begin to engage dowel holes and horizontal slots in aluminum blocks mounted on the magnet rails. With a dowel hole and precision slot at each end of the cradle, it can be reinstalled with an () reproducibility of , which was as good as the measurement technique used. These dowels and blocks lift the cradle , so there is no mechanical conflict with the rollers and they are not under continuous load. The location of the cradle is ensured by having two mating surfaces at the downstream end.
The two cradle endplates are 76 thick aluminum (6061 T6). Each has a central cutout and step for a window assembly (O-ring sealed), the windows being 25 doubly aluminized Mylar and positioned 2.8 from the inside endplate face. The endplates are doweled, bolted and glued to the cradle rails. As discussed in Section 3, the accurate positioning of the wire planes in the direction relies on compressing the four columns of Sitalls coming from the nineteen modules. There are 113 Sitalls in each column and they are compressed towards the upstream direction by four custom pneumatic cylinders mounted on the downstream endplate. These aluminum cylinders each have a cross-sectional area of 42.7 and a maximum operating pressure of 100 psi. We operate them at 50 psi, where they each compress the Sitall columns against the upstream endplate with a force of 1,470 N. The gas used in the cylinders is helium rather than air, so that any small gas leaks don’t contaminate the cradle gas.
To further stiffen the upstream endplate against this 5,880 N load, there are two struts between this endplate and the L beams. Since the cradle beams are at the bottom of the cradle, there would still be a tendency for the endplates to separate at their top edges. To prevent this, the cradle also has two 2.5 diameter aluminum tension rods at the top. These rods are removed when modules are added or taken from the cradle. The tension rod design ensures the lengths are reproducible, so the upstream end plate’s position and shape don’t change.
As can be seen in Fig. 9, the downstream endplate has a pair of openings on each side. One is a simple cutout (approximately 34 ) just outside the cylinders at (). They are for two permanent trays that hold a total of sixty 0.25” polyethylene gas inlet lines, 56 for the detector layers plus four spares. These trays and gas lines are permanently installed and sealed with silicone glue as they pass through the downstream endplate. If the cradle is removed from the area, these gas lines are easily disconnected from a nearby external panel and the short hoses taken with the cradle. The bottom of the cradle has a 12.7 aluminum plate bolted and glued in place. This plate has a cutout and a set of blind tapped holes for a removable O-ring sealed bottom cover plate. This 6.4 bottom cover plate gives access to the bottom of the cradle (when it’s out of the magnet) to connect or disconnect input gas lines from the modules.
The other pair of openings on the downstream endplate have much larger cutouts (approximately 175 each) and are designed for cable trays containing the module output mini-coax cables, the preamp LV cables, the HV cables, module gas and cradle gas temperature probe cables, and two NMR cables used for field probes. If the cradle was to be removed from the area, we decided we wanted to open the cradle and unplug cables from the preamps, etc., then leave these two cable trays behind. The alternative was to disconnect all these many cables from the readout electronics, HV supplies, etc., then coil these long cables back to the cradle and remove them with it. In particular, the signal mini-coax cables (plus spares) were deemed too fragile for this process.
In order to leave these cable trays behind, two removable gas seals were required at the downstream endplate. Our solution was to make a curved and tapered 76 thick aluminum plug that surrounded a short section of the cable tray and could mate with an appropriately shaped cutout in the downstream endplate. A 3.2 thick Poron rubber gasket, between the plug and cutout, is compressed to during its installation forming a good gas seal.
The tray was screwed and glued to the plug, then the cables were sealed within the tray with silicone rubber. The latter was difficult with so many cables; air leaks around and through these cables dominate the cradle leakage. The cradle air leak rate of cc/min is quite acceptable and only results in the cradle gas containing air. The cradle has been removed and installed several times. The removable cable tray design has shown itself to be simple and reliable.
The “bridge” is a removable aluminum structure that is positioned at the top of the cradle above the modules and tension rods. It holds the two outlet gas manifolds (see Fig. 4 and Section 9). The sixteen DC modules are connected to one manifold, the target and two PC modules to the other. The connections are via soft neoprene rubber bellows, so little or no force is applied to the modules. The last and major gas seal of the cradle is made by two 2.4 thick aluminum shells that have gasket seals (Poron) to the bridge, the endplates and the outside edge of the cradle L-beams. Each of the shells cover an angle range of approximately 103 degrees on each side of the cradle.
8.1 The 100 mm thick upstream FR4 annulus
Unfortunately, one cannot simply push the most upstream module against the cradle upstream endplate. The endplate is aluminum and the modules are glass and FR4. They have thermal expansion coefficients of , and respectively. The Sitalls are at () and (). So, over 520 the differential thermal expansion is . For a change, the massive 76 thick endplate would be trying to stretch the module . This was considered too dangerous. In addition, pushing the brittle Sitalls against the aluminum plate was deemed unwise. As a final concern, the endplate could not be guaranteed flat enough or stiff enough.
Our solution was to use a 100 thick annulus of FR4 upstream of the first module. This FR4 annulus has OD of 680 and an ID 340 , with four holes milled through it, at () and (). These four holes each have a larger diameter step in the upstream face. Four 40 long Sitalls are glued into the downstream face, using the same optically flat assembly table used for the detector layers. The holes in the Sitalls are sealed with 1.6 thick FR4 discs and the holes in the FR4 annulus are filled with a mixture of epoxy and fine sand. Finally, 19 thick hard brass inserts (naval brass) are glued and screwed to the upstream face of the annulus.
This system creates a coplanar set of Sitalls for the upstream module to be pushed against, and transfers the four 1,470 N loads to the annulus. Because the FR4 has a thermal coefficient close to glass, the module should not be stressed. Being 100 thick, it is very rigid. The sand-filled epoxy creates a smooth load transition to the FR4 and has less compression than regular epoxy. Contact to the brass inserts is made with four 25 diameter rounded aluminum bumpers that are mounted on the outside of the upstream endplate and protrude into the cradle. Their position is adjustable and lockable. The threaded region is 22 from the inside surface of the cradle. This distance allows the bumpers to flex slightly in the () plane, to minimize the effects of the different thermal coefficient of FR4 and the aluminum endplate. The FR4 annulus has suitable feet machined into it, for the V shaped and flat rails inside the cradle.
8.2 The downstream FR4 piece
At the downstream end of the cradle, the situation is quite different. It is still important to provide a transition for the four 1,470 N loads from the pneumatic cylinders to the brittle Sitalls. The issue of differential thermal coefficients is also the same as for the upstream end of the cradle. However, while great stiffness of the upstream annulus was an asset, at the downstream end of the cradle, compliance is desired. The reason is obvious; we want the four 1,470 N loads transferred to the downstream module’s Sitalls. A stiff annulus, if its four Sitalls were not perfectly coplanar, might not transfer those four loads evenly.
Our solution is to have four 80 diameter, 100 thick FR4 rods mounted on a 6.4 thick FR4 annulus. Each of these FR4 rods has a through hole, with a 40 long Sitall, and brass insert glued into it, just like those of the upstream annulus. These four 80 mm diameter FR4 rods provide the force transitions; the 6.4 thick FR4 annulus supports them, but is quite flexible. The pneumatic cylinders, mounted on the downstream side of the endplate, each have a 25 diameter rounded aluminum bumper attached to its piston.
These bumpers protrude into the cradle. This distance from the brass insert to the piston allows the bumpers to flex slightly in the () plane, minimizing the effects of the different thermal coefficient of FR4 and the aluminum endplate. The 6.4 mm thick FR4 annulus has suitable feet machined into it, for the V-shaped and flat rails inside the cradle.
8.3 Compression of the 19 modules
The stack of 19 modules is compressed by the four pneumatic cylinders. At their maximum pressure of 100 PSI, each of these cylinders pushes its Sitall column with a force of 2,940 N. Compression tests were performed to check that we understand what this compression of the modules is actually doing.
With such tests in mind, the pneumatic cylinders were designed with the shaft protruding from both ends of the cylinder. In this way, dial gauges could be mounted outside the cradle to measure the movement of the cylinders. Unfortunately, since the gauges have to be mounted on the cylinder casing, their measurements also include movement of the cradle endplates (especially the downstream endplate). This cradle movement is about eight times larger than the compression of the Sitalls (see top curve in upper part of Fig. 10). To subtract the effect of the movement of the cradle, we substituted four aluminum pipes for the detector stack. The response was approximately linear, especially for . This data was corrected for the expected compression of the pipes ( /N) and used as the deflection characteristic of the cradle (see bottom curve in upper part of Fig. 10). The lower curve in Fig. 10 shows the compression tests of the module stack, after subtraction of the cradle deflection.

As can be seen, the stack of 19 modules shows an initial large compression, which becomes linear for N. This response is understandable; the modules have to be pushed into contact and then the increased force hopefully drives them into nearly optical contact of their flat surfaces. After optical contact, the expected slope of the data should be determined by the elastic modulus of the Sitall ( Pa), the total inside length of the cradle (1,483 ) and the area of the Sitalls (11.6 ). Assuming the 171 of non-Sitall FR4 end pieces act like the 1,324 of Sitall, one gets a calculated slope of /N. The slope of the measured compression in Fig. 10 is even less, only /N. This test should only be taken to indicate that our operating force of 1,470 N on each Sitall column is reasonable to properly compress the Sitalls in the nineteen modules.
A second study gave us a direct measurement of the length of the detector stack. As there is no access to the Sitall faces when the modules are compressed, four brass annuli were installed on the 40 long Sitalls of the dense stack base plates (visible on Fig. 3). Since these Sitalls extend beyond the FR4 gas box, there was room for the 10 thick annuli. They were positioned from the ends of the Sitalls using precision spacers.
These surfaces were then accessible on the upstream and downstream dense stack module, allowing a direct measurement of most of the length of the detector stack, including the target module and all sixteen of the drift chamber modules.
The distance between these upstream and downstream brass surfaces was measured using a dial gauge mounted in a long aluminum tube holder. This one meter long “aluminum dial gauge” was obviously subject to temperature changes and needed calibrating. This was done by repeatedly measuring the length of a calibrated custom gauge block. This gauge block was long and made of Invar, which has a low thermal coefficient of .
Measurements were made at 1,470 N force, then the two measured brass-Sitall distances were added. This gives the total length of the central 17 modules (end PCs not included). The value was . The calculated lengths of these columns, using the measured thicknesses of the Sitalls from our data base, is . This value should be reduced by the calculated compression of the Sitall column at 1,470 N, which is 24 . The final value is . The difference between this and the measured value is 23 , within the uncertainty.
This excellent agreement confirms that the columns of Sitall are properly compressed and we know the length of the detector assembly with a precision considerably better than 50 . With the “aluminum dial gauge” in place, the cylinder forces were increased from 1,470 N to 2,940 N and the reduction in the stack length recorded. The measurement of this change is more accurate; the value was . This is in a good agreement with calculated value of .
Knowledge of the detector stack length within 50 means that relative position of each 4 Sitall in the stack is known with a precision of a few microns, an accuracy much higher than is required.
9 Gas system
Helium/nitrogen () flows through the cradle and between the modules, and the first and last cathode foils in each module act as the module gas windows. Two gas systems are required for the TWIST modules, one for the DME gas of the sixteen DC modules, the second for the CF4/isobutane gas for the target and the two PC modules (T+PC). These gas systems are required to provide stable gas flows to each of the 56 individual detectors while maintaining a very low differential pressure between the modules and the helium/nitrogen gas of the cradle.
9.1 Description
Flow control for the DC system is provided by a pressure regulated input manifold feeding DME through 44 precision needle valves to the 44 individual detector layers. Each of the 44 input flows is continuously monitored by inexpensive mass flowmeters. The pressure between the common DC output manifold and the cradle gas is measured with a precision differential pressure transducer. This transducer signal is used to adjust the output flow to the DME system output pump, thus realizing differential pressure control. To ensure all sixteen DC modules have a common differential pressure with respect to the cradle, the short neoprene bellows () connecting the outputs to the manifold, and the output manifold itself (), have very low flow impedance. Solenoid valves prededing the DME input manifold and following the outlet manifold allow the 16 DME modules to be isolated, to provide protection against accidental over or under pressure. These valves are programmed to close if the differential pressure exceeds mTorr from the desired setpoint pressure. A pressure relief bubbler is also set to vent at mTorr with respect to atmosphere, providing a final “fail safe” protection.
The flow and pressure control features of the (T+PC) gas system are identical to the DC gas system described above. The only differences are that the gas is CF4/isobutane (80:20), there are only 12 detector layers (4 in the target and 4 in each of the two PC modules), and a lower quality differential pressure transducer is used. Because CF4 is an expensive gas, 80% of the chamber output flow is filtered, mixed with the incoming fresh supply, and recycled.
The helium/nitrogen () gas is supplied from a pressure regulated source and uses a simple mechanical flowmeter with a manual needle valve. The flow rate is typically 1 l/min to the cradle. The helium/nitrogen from the cradle is exhausted through a 1” diameter copper tube to vent at an elevation 99 below the midplane of the modules. The low impedance output tube is necessary to reduce cross coupling of pressure fluctuations between the (T+PC) and DC pressure control systems that can result from pressure fluctuations being transmitted through the windows of the modules of one system, through the cradle gas and into the windows of the modules of the other system. Venting the cradle gas to atmosphere 99 below the midplane creates a static overpressure of mTorr with respect to atmosphere at the modules’ midplane. A pressure relief bubbler, identical to those used in the (T+PC) and DC gas systems, provides protection against accidental over pressuring of the cradle.
9.2 Pressure control
A significant challenge for the gas system design was to maintain the external cathode foils as flat as possible and with a positional stability of or less. There are three sources of differential pressure that can deflect the module windows:
-
1.
Electrostatic pressure due to the anode-to-cathode electrostatic attraction.
-
2.
Gravitational pressure due to the vertical orientation of the cathodes and the difference in density between gasses on either side of the first and last cathodes.
-
3.
Gas pressure applied by the gas supply systems.
To minimize the impact of all three effects, it was necessary to make the foil tension as high as was practical. Preliminary tension tests of stretched 339 diameter, 6.3 thick foils (doubly aluminized) revealed that after being stretched and glued to the cathode frame, the foil tension relaxes exponentially with a time constant of days, to an asymptotic value of the initial tension. Figure 11 shows the relaxation of a test foil.
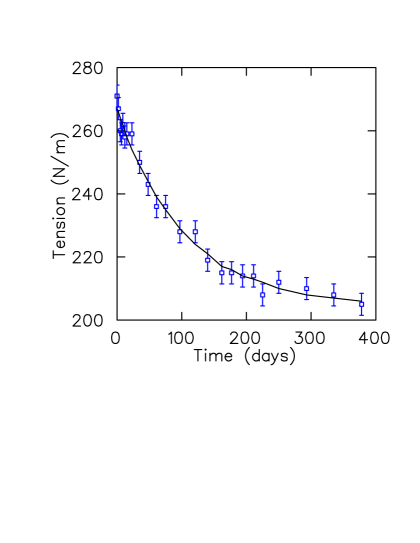
The first 59 production cathode foils were stretched to an initial tension of N/m. Due to concerns of foils ripping from the high tension, the final 107 cathode foils were stretched to a lower initial tension of N/m. After gluing to the cathode frame, the tension in each foil was measured and the expected final relaxed tension was calculated. From these measurements, the average expected final tension of all the foils was calculated to be N/m.
A tension of 206 N/m corresponds to an average foil deflection rate of 4.7 /mTorr, at the center of the circular foil. This implies that to keep the position of the centre of the foils stable to , we would need to keep the differential pressure across the window foils constant to mTorr.
After assembly, the pneumatic capacity of each module was measured by flowing gas into the closed module and monitoring the resulting rate of change of pressure. Pneumatic capacity () is defined by , where is the volume flow rate at STP and the rate of change of pressure in the closed volume. From these measurements, we calculated the average tension of the window foils of each module and the average deflection rate of these foils (). The average measured capacity of the 19 TWIST modules was cc/mTorr corresponding to an average tension in the foils of N/m, and a deflection rate of mTorr.
Since roughly one year ( tension-decay time constants) passed between the initial foil tension tests and their final assembly into modules, the results of the initial foil tension tests and the module tests are consistent.
The total capacity of the 16 DC modules (in the cradle) was also measured several times during various running periods of the TWIST spectrometer. A repeatable pattern emerged. After one day of exposure to DME the total capacity would be cc/mTorr. The total capacity would continue to increase over the next few weeks until it stabilized at cc/mTorr, significantly higher than the expected cc/mTorr. After exposure to air or argon for a few weeks, the total capacity would again decrease to cc/mTorr. The DC operating total capacity of 16.5 cc/mTorr implies an average foil deflection rate of 11.6 /mTorr, which requires a differential pressure stability of mTorr to maintain foil position stability of .
The total capacity of the target and two PC modules was also measured during the various running periods. Total capacity appeared to be stable at cc/mTorr regardless of time of exposure to CF4/isobutane, argon/isobutane, or air. This is slightly higher than the expected total capacity of cc/mTorr, and implies an average foil deflection rate of mTorr.
From these results, in particular the responses to the different gas mixtures, we suspect that the DME is being absorbed by the Mylar foils of the DC modules, causing the foil tension to relax. Some of this relaxation appears to be permanent. Bagaturia et al. [12] have also noticed foil relaxtion associated with DME. In their case, the foils were Kapton GEM detectors.
A high precision pressure transducer is used to measure the differential pressure between the DC modules and the cradle gas. At our typical operating differential pressure the manufacturer’s specifications imply a temperature drift of 0.023 mTorr/. This is sufficient for our requirements, where typical extremes of temperature are less than . The foil stability requirements for the target and PCs are considerably less strenuous and consequently a less precise (less expensive) pressure transducer is used on the (T+PC) system. The manufacturer’s specifications indicate a temperature drift of 1.08 mTorr/ for this gauge at our typical operating differential pressure.
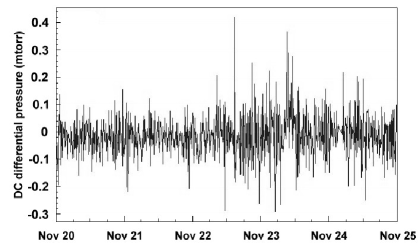
For each gas system, the output signal from the pressure transducer is connected to a PID controller that in turn controls the output mass flow controller (MFC) preceding the exhaust pump, thereby controlling the differential pressure between the modules and the cradle volume. As shown in Fig. 12, the control stability obtained is the order of mTorr. Thus, the combined transducer temperature drift and control instability contribute an error less than mTorr for the DC system, corresponding to only foil stability. Unfortunately, these are not the only sources of differential pressure instability.
Space constraints and high magnetic fields around the cradle required that the pressure transducers be located several meters from the measurement points. “Blind” 0.25” OD copper tubes that traverse rising, horizontal and falling sections, connect the transducers to their measurement points. These three pressure sensing tubes are initially flushed out with the appropriate gas mixtures (DME, CF4/isobutane, or helium/nitrogen) and then left closed at the pressure transducer end. Accurate knowledge of the differential pressure at the centre of the chambers depends on accurate knowledge of the gas density in these tubes. A 1% change in density due to atmospheric pressure or ambient temperature change causes a 1.1 mTorr change in the measured DC differential pressure. Since atmospheric pressure and the gas temperature at several locations in the pressure sensing tubes are monitored, these changes can be compensated for.
More problematic are changes in gas composition due to diffusion or small leaks into the pressure sensing tubes. During the 2002 running period a technique was developed for periodically measuring the gas density in the pressure sensing tubes. These measurements revealed changes of up to 40 mTorr in the actual differential pressure at the centre of the window foils of the DC modules. Subsequent intensive leak checking revealed some small leaks in the pressure sensing tubes. These leaks were fixed and during the 2003 running period the actual DC differential pressure was stable to mTorr implying a foil position stability of .
To further improve the positional stability of the window foils, we are considering a modification, so that the three pressure sensing tubes are continuously flushed with small flows of the appropriate gas mixtures. These small flows would start at the pressure sensors, pass through the sensing lines and into the chamber gas manifolds and the cradle. Flows of cc/min would not cause significant flow related pressure drops in the pressure sensing tubes.
Currently we are calculating the foil deflections based on pressure, temperature and chamber capacity measurements. An independent indication of the foil deflections is desirable. We are investigating the possibility of using online TDC data from the detectors to independently monitor external cathode foil deflections.
9.3 Gas composition stability
Since helium/nitrogen cradle gas surrounds the wire chambers, diffusion of helium into the chambers is a major source of contamination. GARFIELD simulations predict that a 1% change in helium concentration in the DME (from say 1% to 2%) would cause roughly a 1% change in electron drift times. Preliminary tests of numerous pieces of 6.3 aluminized Mylar foil determined an average helium diffusion rate of cc/(s Torr m2) or about 0.015 cc/min through each window foil. Our normal flow rate of cc/min per detector layer results in a helium concentration of 0.075% with a stability of for the (UV) modules. Since 80% of the (T+PC) gas is recycled, the helium contamination in the CF4/isobutane due to diffusion through the window foils is expected to stabilize at .
Small leaks through pinholes in the cathode foils or holes in the module gas boxes could easily exceed diffusion through the window foils. For this reason all modules were leak checked after final assembly by filling them with helium to mTorr with respect to atmosphere. The inlet valve was then closed and the differential pressure to atmosphere was monitored for at least 15 minutes. Leak rates were calculated from the module’s measured capacity and any resulting changes in differential pressure. Continuous measurements of gas temperature and atmospheric pressure allowed us to compensate for these effects. Only (UV), target and PC modules with measured leak rates less than 0.3 cc/min were installed in the cradle. Due to the four times higher operational total flow through dense stack (DS) modules, leak rates up to 0.6 cc/min were accepted for the DS modules. The average measured helium leak rate of the 14 (UV) modules was cc/min per module. This corresponds to an average helium concentration of 0.35% with a concentration instability of at our nominal flow rate and flow rate stability. This instability should cause a similar uncertainty of in the drift velocity, which is well within our required tolerances.
During running periods we periodically estimated the total leak rates of the DME, CF4/isobutane and cradle volumes. This was done by increasing the differential pressure in the volume to be measured by a few hundred mTorr, isolating the volume and monitoring the pressure over a period of time. These tests are sensitive to leak rates in the modules and all their connecting tubing between the isolation valves at the gas racks and the volumes under test. The measurements were primarily used to detect changes in leak rates following reinstallation of modules. The typical measured total leak rate for the DCs (DME) was 4.5 cc/min or 0.28 cc/min per module. The cradle leak rate typically measured approximately 60 cc/min. The differential pressure in the CF4/isobutane volume typically showed an increasing pressure when isolated. We suspect this effect is due to diffusion of helium or air into the detector end of the (T+PC) pressure sense line.
The CF4/isobutane (80:20) for the (T+PC) system is mixed with MFCs having a manufacturer’s specified accuracy of of full scale. At the mixing flow rates employed, this results in a mixture of CF4 and isobutane. Since pure DME is used for the DCs mixture accuracy is not an issue. The manufacturer’s specifications for DME and isobutane supplies are 99.5% purity with typical impurities of n-butane and other alkanes. The CF4 used is 99.95% pure. Oxygen contamination of all gas supplies is measured before use and typically found to be less than 20 ppm. The oxygen concentration in the exhaust gasses was measured at various times during running periods. Typical oxygen concentrations were 75 ppm in the DCs, 50 ppm in the (T+PC) and 500 ppm in the cradle exhaust gas. For a 1 l/min flow through the cradle, this 500 ppm oxygen concentration implies an oxygen flow in of 0.5 cc/min, and an air leak rate of 2.5 cc/min. To compensate for this implied leak, the nitrogen content of the cradle input gas was reduced from 3% to 2.75%, so the cradle gas is actually helium/nitrogen/air ().
10 Readout electronics
On all modules the cathode foils are grounded and positive high voltage is applied to the wires. This allows each detector layer to have its own operating voltage or to be turned off. The signals are brought through the gas box wall at high voltage and then decoupled on the preamplifier boards. Two service PCBs are mounted on each module gas box (in the readout arcs). They provide mounting and +4 V distribution for the preamplifiers.
All signal, preamplifier power, and HV cables are permanently fixed in two cable trays and sealed with a silicone rubber. The cable trays can be disconnected from the cradle and chamber stack when the detectors need to be moved out of the experimental area for service or tests (as discussed in Section 8).
We use a preamplifier developed at Fermilab for use at their Colliding Detector Facility [13]. This preamplifier is used for all the TWIST chambers and has a gain of 1 mV/fC and a dynamic range of -400 fC to +20 fC. Both 16 and 24 channel versions of this preamplifier are used on the detector modules.
All signals from the DCs, target and PCs go to post-amplifier/discriminators via 9.5 m long micro-coaxial cables. These custom made post-amplifier/discriminator modules have sixteen channels in a single width CAMAC unit and are housed in twelve CAMAC crates within two racks on the service platform next to the spectrometer. Each CAMAC crate contains up to 24 of these units plus a custom made controller module. This controller module interfaces with the TWIST Slow Control system and allows the adjustment of discriminator thresholds and application of test pulses. Temperature and power supply voltages are also monitored via this controller module.
The discriminator circuit produces a differential ECL logic, time over threshold output. Our operating threshold for the DC postamps is typically 150 mV. With their gain of twenty, this means a threshold equivalent to 7.5 mV at the preamp output. The VTX preamplifier has a gain of 1 mV/fC and our DC gas gain is estimated at (at 1950 V). This implies the effective threshold is electrons collected from a passing track. A more direct measurement indicated that detection of single electrons produced mV pulses from the preamps, so our threshold was in fact electrons. The latter is more likely, since the specified preamp gain will depend on frequency. Under these operating conditions, the noise rate was measured and found to be negligible ( Hz/wire).
These discriminator ECL logic signals are sent to the FASTBUS TDCs (LeCroy model 1877) via 15 m long, 16-pair flat-twisted cables. The cables are bundled and wrapped with copper laminated Mylar foil to reduce oscillations caused by RF radiation. The TDCs are multihit type and have 0.5 ns resolution. They are operated in Common Stop mode.
The FASTBUS TDCs are housed in 2 crates each containing an SIS4100NGF FASTBUS to VME interface. Each interface contains a Motorola MVME 2306 PowerPC which is responsible for transferring the TDC data to the data acquisition system [14] through an Ethernet connection. The FASTBUS crates are positioned 8 m from the service platform, to eliminate the interference from their switching power supplies.
11 Efficiency
The first efficiency tests on the drift chambers were conducted with the spectrometer magnet off, using a 120 MeV/c pion beam.
The efficiency code uses tracking information to determine which wire in a given plane is expected to display a hit. Once a track is successfully reconstructed, the track parameters are used by the efficiency algorithm to traverse through the detector stack and find the entrance and exit points of the track through each detector layer. This information is then converted into cell numbers, and the plane is searched to determine whether the TDCs corresponding to these cells (or the neighboring cells) recorded a hit. In this context, the term efficiency refers to the intrinsic efficiency of the chamber. This efficiency depends on the gas properties, cell geometry and construction (cell size, wire thickness, presence of drift wires, etc.), high voltage and threshold.
To determine an operating point for the DCs, data were obtained with the high voltage of approximately half the modules at 1900 V while the high voltage on the other half was varied from 1600 V to 2000 V in steps of 50 V. Figure 13 shows the efficiency as a function of high voltage averaged over all DC planes for which the HV was being varied. The figure insert is an expanded view of the “plateau region”, showing that the efficiency reached a value greater than 99.95%.
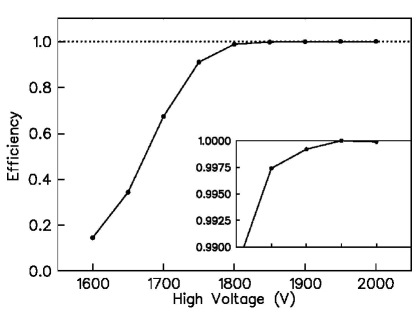
In order to check possible plane-to-plane variations, the efficiency of each plane as a function of high voltage was calculated. Variations at 1900 volts were found negligible with all functioning planes showing efficiencies better than 99.8%. Differences in the shape of the efficiency as a function of high voltage in the region of interest were also found to be negligible, thereby allowing a single operating high voltage for all DC chambers. This is 1950 V. Similarly, the operating voltage of the target and PC modules was determined to be 2050 V.
Since variations in efficiency across a plane may introduce variations in energy and angular acceptance, the efficiency algorithm was also expanded to calculate a wire-by-wire efficiency. Variations in efficiency from wire to wire were also found negligible. The chamber efficiencies per plane are continuously monitored during data taking to ensure stability.
The algorithm used for efficiency calculations was carefully tested for possible biases. A fraction of the hits was rejected right after the unpacking of the TDCs, with the rejection factor varied by different amounts. In particular, to test the efficiency code for possible small biases, as well as sensitivities to inefficiencies of the order of , the rejection factor was set to 0.001 and 0.002 and the difference in the calculated efficiency between the two cases was computed. This resulted in the expected efficiency difference of 0.001.
Since 120 MeV/c pions deposit more energy than muon-decay positrons, and since the Lorentz angle may in principle cause the efficiency to deteriorate when the field is on, the DC efficiency was also calculated using decay positrons at the operating high voltage of 1950 V. The results were very similar to the pion data reported above, thereby showing no deterioration in efficiency.
12 Alignment
The chamber construction techniques give a high precision in inter-plane alignments within a detector layer (i.e., wire positions, foil positions, etc.), as was discussed in Section 6. The use of Sitall spacers and the cradle compression system also gives extremely high precision in the position of the wire planes (as was discussed in Sections 2, 3, and 8).
However, the module assembly and mounting does not allow such a high precision in the transverse chamber positions (() or ()) or rotations around the axis. A high precision, however, is not required, since straight tracks allow for a high precision determination of both.
The TWIST alignment code uses 120 MeV/c pion tracks obtained with the spectrometer magnet off to determine the transverse plane alignments and rotations around the axis. For translational alignments, only tracks close to the center of the chamber are selected to make sure that translational and rotational alignments do not mix at a significant level. Each track is fitted using a Kalman filter, and the means of the tracking residuals for each plane (except two for each alignment direction which are kept fixed) are used to adjust the transverse position of that plane. This process is repeated until all plane positions converge.
Figure 14 shows the Monte Carlo convergence of wire plane differential offsets (difference between Monte Carlo offsets and means of the tracking residuals), for the upstream 22 DC planes. The upper part shows the translational differential offsets of the tracking residuals at the end of each iteration for Monte Carlo data where translational misalignments of twice those obtained from data were introduced. The iteration procedure converges nicely, as is evident from the figure, and the precision to which the alignment code is able to recover these misalignments determines the accuracy of this procedure to be .
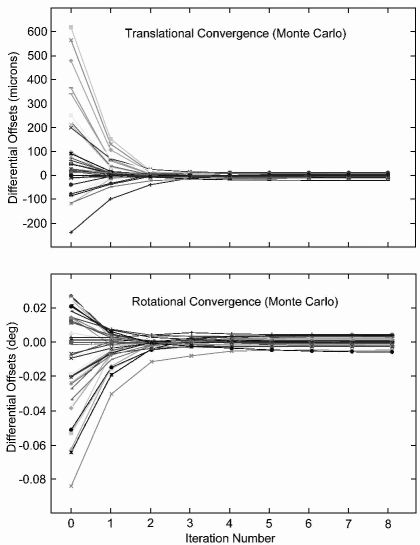
For rotational alignments, the tracking residuals are computed in bins along the wire length, and the means of the tracking residuals along the wire length are converted into a rotation angle. This angle is then used to introduce a plane rotation correction, and the process is iterated until the plane rotations converge. The lower part of Fig. 14 shows the rotational differential offsets at the end of each iteration for Monte Carlo data where rotational misalignments of twice those obtained from data were introduced. The figure demonstrates convergence of the alignment process. The alignment code was also tested using Monte Carlo data and verified to be independent of the starting plane positions and independent of the alignment axis, defined by the fixed planes. The precision is better than 0.02 degrees.
For the actual chambers, this code was used to determine the corrections for the 22 upstream DC planes and also the 22 downstream DC planes. The corrections were found to quickly converge. The derived corrections were reproducible to better than 10 for translations and better than 0.02 degrees for rotations, independent of the starting values of the misalignments. When the same 22 upstream DC planes were analyzed two months later, the new translational corrections differed by less than 9 for the worst planes (). This is quite consistent with the technique’s accuracy of .
The required wire-plane corrections were found to vary up to for translations and up to degrees for rotations. These plane position corrections reflect relative plane-to-plane alignments, and their magnitude depends on the planes which were fixed to determine an alignment axis. The corrections, therefore, do not translate directly into actual plane positions. While the planes are expected to be positioned to an accuracy of within a module, the module-to-module misalignments can be up to few times larger.
Since this alignment procedure requires the magnet to be off, calibrations runs are made at the beginning and end of each running period to ensure there are no changes. In addition, there is an optical alignment system on the cradle to monitor its position. This system uses the end of an optical fiber as a target. A halogen light illuminates the other end of the fiber and the light emitted from the target end is focused with lenses and viewed with a CCD camera element. Four such targets are mounted on the bottom surface of the cradle, two widely spaced near each endplate and a fifth target is near beam height and pointing horizontally at right angles to the beam direction (the direction). These five targets are viewed through holes drilled in the magnet yoke. The optical system does not touch the magnet and is firmly bolted to the concrete floor. This system indicates that the magnet and cradle system is mechanically stable to and not affected by the magnetic field being turned on or off.
One shortcoming of the alignment procedure using straight tracks is the inability to determine the direction of the axis of the detector relative to the direction of the axial magnetic field. However, this quantity can be determined using positron helices when the magnetic field is turned on. The hit pattern of the positrons on each detector plane (i.e., as a function of ) was used to determine this axis to better than 0.035 degrees.
13 Resolution
As discussed in previous sections, the high precisions of the wire plane construction and the Sitall system for positioning of the wire planes result in a negligible impact on the overall spatial resolution of the spectrometer. The transverse plane positions (perpendicular to the axis), and rotations around this axis result in a significant contribution. However, once the translational and rotational corrections of each wire plane are applied, their contribution to the spatial resolution of the spectrometer are small.
There are two major contributions to the spatial resolution of the chamber; the properties of the drift cell and the mechanical precision of the detector assembly. The properties of the drift cell are mainly determined by the choice of drift gas. The high ionization density, low drift velocity and small Lorentz angle make DME a desirable choice for this experiment.
To determine the resolution of the DC planes, a subset of the upstream 22 DC planes were chosen. To define the tracks properly, but minimize multiple scattering, only 8 planes were used (four U and four V). The planes chosen were DC#7 through DC#14. These would be used to test the resolution in a ninth plane (DC#6), a V plane. DCs #6 to #8 are the last three planes in the dense stack module and the other six are the next three (UV) modules. This choice of planes means the subset spans only 188 (minimizing the effects of multiple scattering) and the plane not in the track fit is only 4 mm away from the first plane, so projection errors are also minimized.
As in Sections 11 and 12, we use 120 MeV/c pion data with the magnet off. Events near normal incidence ( degrees) were chosen so we could map the resolution across the drift cell. For DC#7 through DC#14, events were selected that had drift distances , where the resolutions were better. These tracks were fitted to a straight line and compared with the drift times in DC#6, the plane being studied. The STRs (space-time relations) started with those derived from GARFIELD, but were allowed to iterate.
Figure 15 shows the final resolutions as a function of distance from the wire. The resolution is below 50 for tracks more than 1 from the wire, but closer than that it gets progressively worse. This deterioration in resolution closer to the wire is mainly the result of the ionization statistics.
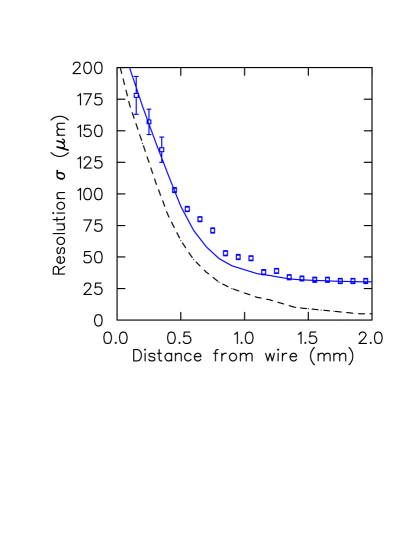
The lower curve shown in Fig. 15 is the resolution computed from GARFIELD using a threshold of 1.6 electrons, which corresponds to our best estimate of our actual threshold (see Section 10). While it shows the resolution deteriorating closer to the wire, it predicts too good a resolution in most of the cell. This is not surprising, since this calculation does not include contributions such as: (a) residual alignment errors () and (b) multiple scattering of the 120 MeV/c pions over the 188 distance of the nine wire planes, and (c) timing jitter associated with leading edge timing and pulse height variations.
To agree with our data, we would need an added resolution contribution that was at 1.8 and rises to at 0.4 . For example, a multiple scattering contribution of and a timing uncertainty of ns added in quadrature to the GARFIELD calculation produce good agreement with our measured resolutions (see upper curve in Fig. 15). Such contributions, or others, could easily account for the discrepancy.
These results were obtained with the DC chambers operating at 1900 V. Since then the operating voltages of the DCs have been raised to 1950 V. Since the resolution is threshold dependent, we will be collecting more test data with voltages of 1950 V, 2000 V and 2050 V. At 2050 V, the gas gain should be higher.
Cindro et al. [15] used this technique for determining the resolution of their DME chambers. They concluded that their threshold was 10 electrons (2.0 clusters of 5 electrons each) and added a constant value of 20 (not in quadrature) to match their observed resolution, which were only about worse than ours.
Figure 16 shows the distribution of tracking residuals for DC#6. Since resolution deteriorates for tracks closer to the sense wire (Fig. 15), this distribution is only for hits having drift distances greater than 0.5 . The distribution has FWHM = . The tails extend to , and undoubtedly have contributions from; (a) multiple scattering over 188 and 9 detector layers, and (b) hits near the 0.5 rejection distance, where the resolution is already .

The resolution measurements indicate that the TWIST drift chambers are giving resolutions as good as were expected.
14 Conclusions
The TWIST spectrometer was commissioned two years ago. There have been many calibration and data collection runs. The operation and the performance of the TWIST chambers was virtually flawless. There are no hot or dead wires in the entire spectrometer, containing 5,056 sense wires from 44 DC planes, 8 PC planes and 4 target planes. Of particular importance, the DC planes operated at full efficiency ().
The detector system has been extremely reliable, with only one broken wire. This required the PC module to be removed and replaced with the spare PC module.
Incorporating a set of low thermal expansion Sitall spacers in every detector layer has resulted in a system where the positions of each wire plane are known to a few microns and cumulative tolerances over the 120 long tracking region are less than 50 . Using glass plate substrates for the detector layers has also resulted in a cumulative tolerance across the 320 wide active areas of less than .
Within each wire plane the sense wires were strung with excellent precision ( in the direction), with very few wires out of position more than 15 .
The mechanical system of the cradle was well designed to utilize the high quality of the module construction and to make installation and removal of modules (or even the whole cradle) as straightforward as possible.
15 Acknowledgements
We thank the full TWIST collaboration. The design and construction of the TWIST detectors and the cradle support system could not have been accomplished without their suggestions, advice and support. D.R. Gill and N.L. Rodning, as the first two spokespersons of the TWIST collaboration, deserve special mention. We thank H.C. Walter and J.A. Macdonald for their contributions, G. Stanford for his invaluable engineering advice and A. Prorok for his excellent design office skills. We thank C.A. Ballard, M.J. Barnes, S. Chan, B. Evans, M. Goyette, D. Maas, G.M. Marshall, S. Mullin, J. Soukup, C. Stevens, P. Vincent, and L. Wampler, who contributed to the construction and operation of the TWIST chambers and cradle system. We also acknowldge many contributions by other members of the TRIUMF professional and technical staff. This work is supported in part by the Natural Sciences and Engineering Reasearch Council and the National Reasearch Council of Canada, the Russian Ministry of Science, and the U.S. Department of Energy.
References
- [1] S. Eidelman et al., Physics Letters B592, 1 (2004). See article by W. Fetscher and H.J. Gerber, p. 410.
- [2] A.E. Pifer, T. Bowen, and K.R. Kendall, Nucl. Instr. and Meth. 135, 39 (1976).
- [3] Sitall CO-115M, Northern Lights Optics 8B-186, 3110 8th St., E. Saskatoon, Saskatchewan S7H 0W2, Canada. http://www.minerals.sk.ca
- [4] Schott Glass Technologies, 400 York Ave, Duryea, PA 18642, USA.
- [5] GEANT, version 3.2114.
- [6] R. Veenhof, GARFIELD, a drift chamber simulation program, Version 7.10.
- [7] Gas Encyclopedia, L’Air Liquide Scientific Division, Elsevier (1976) p. 533.
- [8] R. Openshaw and R. Henderson, Nucl. Instr. and Meth. A515, 89 (2003). (Proceedings of the International Workshop on Aging Phenomena in Gaseous Detectors, Hamburg, Germany, Oct 2001.)
- [9] GC Electronics, EMI-RFI Shield, cat. no. 10-4807. Manufactured by: GC/Waldom Inc, 1801 Morgan St, Rockford, IL 61102-2690, USA.
- [10] Goodfellow Corp, 800 Lancaster Ave, Berwyn, PA 19312-1780, USA.
- [11] ANSYS, Inc., Canonsburg, PA.
- [12] Y. Bagaturia et al., NIM A490, 223 (2002).
- [13] R.J. Yarema et al., IEEE Trans. on Nucl. Sci. NS-39, 742 (1992).
-
[14]
R. Poutissou et al., 13th IEEE-NPSS Real Time Conference 2003,
Montreal, May 2003. TRIUMF preprint
TRI-PP-04-16.
http://www.triumf.ca/publications/pplist/pp04.html - [15] V. Cindro et al., NIM A309, 411 (1991).