CERN–PH-EP/2004-017
27 April 2004
DELPHI Collaboration
Abstract
A test of the benchmark QED process () is reported, using the data collected with the DELPHI detector at LEP 2. The data analysed were recorded at centre-of-mass energies ranging from 161 GeV to 208 GeV and correspond to a total integrated luminosity of 656.4 pb-1. The Born cross-section for the process () was determined, confirming the validity of QED at the highest energies ever attained in electron-positron collisions. Lower limits on the parameters of a number of possible deviations from QED, predicted within theoretical frameworks expressing physics beyond the Standard Model, were derived.
(Accepted by Eur. Phys. J. C)
J.Abdallah,
P.Abreu,
W.Adam,
P.Adzic,
T.Albrecht,
T.Alderweireld,
R.Alemany-Fernandez,
T.Allmendinger,
P.P.Allport,
U.Amaldi,
N.Amapane,
S.Amato,
E.Anashkin,
A.Andreazza,
S.Andringa,
N.Anjos,
P.Antilogus,
W-D.Apel,
Y.Arnoud,
S.Ask,
B.Asman,
J.E.Augustin,
A.Augustinus,
P.Baillon,
A.Ballestrero,
P.Bambade,
R.Barbier,
D.Bardin,
G.J.Barker,
A.Baroncelli,
M.Battaglia,
M.Baubillier,
K-H.Becks,
M.Begalli,
A.Behrmann,
E.Ben-Haim,
N.Benekos,
A.Benvenuti,
C.Berat,
M.Berggren,
L.Berntzon,
D.Bertrand,
M.Besancon,
N.Besson,
D.Bloch,
M.Blom,
M.Bluj,
M.Bonesini,
M.Boonekamp,
P.S.L.Booth,
G.Borisov,
O.Botner,
B.Bouquet,
T.J.V.Bowcock,
I.Boyko,
M.Bracko,
R.Brenner,
E.Brodet,
P.Bruckman,
J.M.Brunet,
L.Bugge,
P.Buschmann,
M.Calvi,
T.Camporesi,
V.Canale,
F.Carena,
N.Castro,
F.Cavallo,
M.Chapkin,
Ph.Charpentier,
P.Checchia,
R.Chierici,
P.Chliapnikov,
J.Chudoba,
S.U.Chung,
K.Cieslik,
P.Collins,
R.Contri,
G.Cosme,
F.Cossutti,
M.J.Costa,
D.Crennell,
J.Cuevas,
J.D’Hondt,
J.Dalmau,
T.da Silva,
W.Da Silva,
G.Della Ricca,
A.De Angelis,
W.De Boer,
C.De Clercq,
B.De Lotto,
N.De Maria,
A.De Min,
L.de Paula,
L.Di Ciaccio,
A.Di Simone,
K.Doroba,
J.Drees,
M.Dris,
G.Eigen,
T.Ekelof,
M.Ellert,
M.Elsing,
M.C.Espirito Santo,
G.Fanourakis,
D.Fassouliotis,
M.Feindt,
J.Fernandez,
A.Ferrer,
F.Ferro,
U.Flagmeyer,
H.Foeth,
E.Fokitis,
F.Fulda-Quenzer,
J.Fuster,
M.Gandelman,
C.Garcia,
Ph.Gavillet,
E.Gazis,
R.Gokieli,
B.Golob,
G.Gomez-Ceballos,
P.Goncalves,
E.Graziani,
G.Grosdidier,
K.Grzelak,
J.Guy,
C.Haag,
A.Hallgren,
K.Hamacher,
K.Hamilton,
S.Haug,
F.Hauler,
V.Hedberg,
M.Hennecke,
H.Herr,
J.Hoffman,
S-O.Holmgren,
P.J.Holt,
M.A.Houlden,
K.Hultqvist,
J.N.Jackson,
G.Jarlskog,
P.Jarry,
D.Jeans,
E.K.Johansson,
P.D.Johansson,
P.Jonsson,
C.Joram,
L.Jungermann,
F.Kapusta,
S.Katsanevas,
E.Katsoufis,
G.Kernel,
B.P.Kersevan,
U.Kerzel,
A.Kiiskinen,
B.T.King,
N.J.Kjaer,
P.Kluit,
P.Kokkinias,
C.Kourkoumelis,
O.Kouznetsov,
Z.Krumstein,
M.Kucharczyk,
J.Lamsa,
G.Leder,
F.Ledroit,
L.Leinonen,
R.Leitner,
J.Lemonne,
V.Lepeltier,
T.Lesiak,
W.Liebig,
D.Liko,
A.Lipniacka,
J.H.Lopes,
J.M.Lopez,
D.Loukas,
P.Lutz,
L.Lyons,
J.MacNaughton,
A.Malek,
S.Maltezos,
F.Mandl,
J.Marco,
R.Marco,
B.Marechal,
M.Margoni,
J-C.Marin,
C.Mariotti,
A.Markou,
C.Martinez-Rivero,
J.Masik,
N.Mastroyiannopoulos,
F.Matorras,
C.Matteuzzi,
F.Mazzucato,
M.Mazzucato,
R.Mc Nulty,
C.Meroni,
E.Migliore,
W.Mitaroff,
U.Mjoernmark,
T.Moa,
M.Moch,
K.Moenig,
R.Monge,
J.Montenegro,
D.Moraes,
S.Moreno,
P.Morettini,
U.Mueller,
K.Muenich,
M.Mulders,
L.Mundim,
W.Murray,
B.Muryn,
G.Myatt,
T.Myklebust,
M.Nassiakou,
F.Navarria,
K.Nawrocki,
R.Nicolaidou,
M.Nikolenko,
A.Oblakowska-Mucha,
V.Obraztsov,
A.Olshevski,
A.Onofre,
R.Orava,
K.Osterberg,
A.Ouraou,
A.Oyanguren,
M.Paganoni,
S.Paiano,
J.P.Palacios,
H.Palka,
Th.D.Papadopoulou,
L.Pape,
C.Parkes,
F.Parodi,
U.Parzefall,
A.Passeri,
O.Passon,
L.Peralta,
V.Perepelitsa,
A.Perrotta,
A.Petrolini,
J.Piedra,
L.Pieri,
F.Pierre,
M.Pimenta,
E.Piotto,
T.Podobnik,
V.Poireau,
M.E.Pol,
G.Polok,
V.Pozdniakov,
N.Pukhaeva,
A.Pullia,
J.Rames,
A.Read,
P.Rebecchi,
J.Rehn,
D.Reid,
R.Reinhardt,
P.Renton,
F.Richard,
J.Ridky,
M.Rivero,
D.Rodriguez,
A.Romero,
P.Ronchese,
P.Roudeau,
T.Rovelli,
V.Ruhlmann-Kleider,
D.Ryabtchikov,
A.Sadovsky,
L.Salmi,
J.Salt,
C.Sander,
A.Savoy-Navarro,
U.Schwickerath,
A.Segar,
R.Sekulin,
M.Siebel,
A.Sisakian,
G.Smadja,
O.Smirnova,
A.Sokolov,
A.Sopczak,
R.Sosnowski,
T.Spassov,
M.Stanitzki,
A.Stocchi,
J.Strauss,
B.Stugu,
M.Szczekowski,
M.Szeptycka,
T.Szumlak,
T.Tabarelli,
A.C.Taffard,
F.Tegenfeldt,
J.Timmermans,
L.Tkatchev,
M.Tobin,
S.Todorovova,
B.Tome,
A.Tonazzo,
P.Tortosa,
P.Travnicek,
D.Treille,
G.Tristram,
M.Trochimczuk,
C.Troncon,
M-L.Turluer,
I.A.Tyapkin,
P.Tyapkin,
S.Tzamarias,
V.Uvarov,
G.Valenti,
P.Van Dam,
J.Van Eldik,
A.Van Lysebetten,
N.van Remortel,
I.Van Vulpen,
G.Vegni,
F.Veloso,
W.Venus,
P.Verdier,
V.Verzi,
D.Vilanova,
L.Vitale,
V.Vrba,
H.Wahlen,
A.J.Washbrook,
C.Weiser,
D.Wicke,
J.Wickens,
G.Wilkinson,
M.Winter,
M.Witek,
O.Yushchenko,
A.Zalewska,
P.Zalewski,
D.Zavrtanik,
V.Zhuravlov,
N.I.Zimin,
A.Zintchenko,
M.Zupan
11footnotetext: Department of Physics and Astronomy, Iowa State
University, Ames IA 50011-3160, USA
22footnotetext: Physics Department, Universiteit Antwerpen,
Universiteitsplein 1, B-2610 Antwerpen, Belgium
and IIHE, ULB-VUB,
Pleinlaan 2, B-1050 Brussels, Belgium
and Faculté des Sciences,
Univ. de l’Etat Mons, Av. Maistriau 19, B-7000 Mons, Belgium
33footnotetext: Physics Laboratory, University of Athens, Solonos Str.
104, GR-10680 Athens, Greece
44footnotetext: Department of Physics, University of Bergen,
Allégaten 55, NO-5007 Bergen, Norway
55footnotetext: Dipartimento di Fisica, Università di Bologna and INFN,
Via Irnerio 46, IT-40126 Bologna, Italy
66footnotetext: Centro Brasileiro de Pesquisas Físicas, rua Xavier Sigaud 150,
BR-22290 Rio de Janeiro, Brazil
and Depto. de Física, Pont. Univ. Católica,
C.P. 38071 BR-22453 Rio de Janeiro, Brazil
and Inst. de Física, Univ. Estadual do Rio de Janeiro,
rua São Francisco Xavier 524, Rio de Janeiro, Brazil
77footnotetext: Collège de France, Lab. de Physique Corpusculaire, IN2P3-CNRS,
FR-75231 Paris Cedex 05, France
88footnotetext: CERN, CH-1211 Geneva 23, Switzerland
99footnotetext: Institut de Recherches Subatomiques, IN2P3 - CNRS/ULP - BP20,
FR-67037 Strasbourg Cedex, France
1010footnotetext: Now at DESY-Zeuthen, Platanenallee 6, D-15735 Zeuthen, Germany
1111footnotetext: Institute of Nuclear Physics, N.C.S.R. Demokritos,
P.O. Box 60228, GR-15310 Athens, Greece
1212footnotetext: FZU, Inst. of Phys. of the C.A.S. High Energy Physics Division,
Na Slovance 2, CZ-180 40, Praha 8, Czech Republic
1313footnotetext: Dipartimento di Fisica, Università di Genova and INFN,
Via Dodecaneso 33, IT-16146 Genova, Italy
1414footnotetext: Institut des Sciences Nucléaires, IN2P3-CNRS, Université
de Grenoble 1, FR-38026 Grenoble Cedex, France
1515footnotetext: Helsinki Institute of Physics, P.O. Box 64,
FIN-00014 University of Helsinki, Finland
1616footnotetext: Joint Institute for Nuclear Research, Dubna, Head Post
Office, P.O. Box 79, RU-101 000 Moscow, Russian Federation
1717footnotetext: Institut für Experimentelle Kernphysik,
Universität Karlsruhe, Postfach 6980, DE-76128 Karlsruhe,
Germany
1818footnotetext: Institute of Nuclear Physics PAN,Ul. Radzikowskiego 152,
PL-31142 Krakow, Poland
1919footnotetext: Faculty of Physics and Nuclear Techniques, University of Mining
and Metallurgy, PL-30055 Krakow, Poland
2020footnotetext: Université de Paris-Sud, Lab. de l’Accélérateur
Linéaire, IN2P3-CNRS, Bât. 200, FR-91405 Orsay Cedex, France
2121footnotetext: School of Physics and Chemistry, University of Lancaster,
Lancaster LA1 4YB, UK
2222footnotetext: LIP, IST, FCUL - Av. Elias Garcia, 14-,
PT-1000 Lisboa Codex, Portugal
2323footnotetext: Department of Physics, University of Liverpool, P.O.
Box 147, Liverpool L69 3BX, UK
2424footnotetext: Dept. of Physics and Astronomy, Kelvin Building,
University of Glasgow, Glasgow G12 8QQ
2525footnotetext: LPNHE, IN2P3-CNRS, Univ. Paris VI et VII, Tour 33 (RdC),
4 place Jussieu, FR-75252 Paris Cedex 05, France
2626footnotetext: Department of Physics, University of Lund,
Sölvegatan 14, SE-223 63 Lund, Sweden
2727footnotetext: Université Claude Bernard de Lyon, IPNL, IN2P3-CNRS,
FR-69622 Villeurbanne Cedex, France
2828footnotetext: Dipartimento di Fisica, Università di Milano and INFN-MILANO,
Via Celoria 16, IT-20133 Milan, Italy
2929footnotetext: Dipartimento di Fisica, Univ. di Milano-Bicocca and
INFN-MILANO, Piazza della Scienza 2, IT-20126 Milan, Italy
3030footnotetext: IPNP of MFF, Charles Univ., Areal MFF,
V Holesovickach 2, CZ-180 00, Praha 8, Czech Republic
3131footnotetext: NIKHEF, Postbus 41882, NL-1009 DB
Amsterdam, The Netherlands
3232footnotetext: National Technical University, Physics Department,
Zografou Campus, GR-15773 Athens, Greece
3333footnotetext: Physics Department, University of Oslo, Blindern,
NO-0316 Oslo, Norway
3434footnotetext: Dpto. Fisica, Univ. Oviedo, Avda. Calvo Sotelo
s/n, ES-33007 Oviedo, Spain
3535footnotetext: Department of Physics, University of Oxford,
Keble Road, Oxford OX1 3RH, UK
3636footnotetext: Dipartimento di Fisica, Università di Padova and
INFN, Via Marzolo 8, IT-35131 Padua, Italy
3737footnotetext: Rutherford Appleton Laboratory, Chilton, Didcot
OX11 OQX, UK
3838footnotetext: Dipartimento di Fisica, Università di Roma II and
INFN, Tor Vergata, IT-00173 Rome, Italy
3939footnotetext: Dipartimento di Fisica, Università di Roma III and
INFN, Via della Vasca Navale 84, IT-00146 Rome, Italy
4040footnotetext: DAPNIA/Service de Physique des Particules,
CEA-Saclay, FR-91191 Gif-sur-Yvette Cedex, France
4141footnotetext: Instituto de Fisica de Cantabria (CSIC-UC), Avda.
los Castros s/n, ES-39006 Santander, Spain
4242footnotetext: Inst. for High Energy Physics, Serpukov
P.O. Box 35, Protvino, (Moscow Region), Russian Federation
4343footnotetext: J. Stefan Institute, Jamova 39, SI-1000 Ljubljana, Slovenia
and Laboratory for Astroparticle Physics,
Nova Gorica Polytechnic, Kostanjeviska 16a, SI-5000 Nova Gorica, Slovenia,
and Department of Physics, University of Ljubljana,
SI-1000 Ljubljana, Slovenia
4444footnotetext: Fysikum, Stockholm University,
Box 6730, SE-113 85 Stockholm, Sweden
4545footnotetext: Dipartimento di Fisica Sperimentale, Università di
Torino and INFN, Via P. Giuria 1, IT-10125 Turin, Italy
4646footnotetext: INFN,Sezione di Torino, and Dipartimento di Fisica Teorica,
Università di Torino, Via P. Giuria 1,
IT-10125 Turin, Italy
4747footnotetext: Dipartimento di Fisica, Università di Trieste and
INFN, Via A. Valerio 2, IT-34127 Trieste, Italy
and Istituto di Fisica, Università di Udine,
IT-33100 Udine, Italy
4848footnotetext: Univ. Federal do Rio de Janeiro, C.P. 68528
Cidade Univ., Ilha do Fundão
BR-21945-970 Rio de Janeiro, Brazil
4949footnotetext: Department of Radiation Sciences, University of
Uppsala, P.O. Box 535, SE-751 21 Uppsala, Sweden
5050footnotetext: IFIC, Valencia-CSIC, and D.F.A.M.N., U. de Valencia,
Avda. Dr. Moliner 50, ES-46100 Burjassot (Valencia), Spain
5151footnotetext: Institut für Hochenergiephysik, Österr. Akad.
d. Wissensch., Nikolsdorfergasse 18, AT-1050 Vienna, Austria
5252footnotetext: Inst. Nuclear Studies and University of Warsaw, Ul.
Hoza 69, PL-00681 Warsaw, Poland
5353footnotetext: Fachbereich Physik, University of Wuppertal, Postfach
100 127, DE-42097 Wuppertal, Germany
1 Introduction
An analysis of the process () is reported. The data analysed were collected with the DELPHI detector [1] at LEP 2, at collision energies, , ranging from 161 GeV up to 208 GeV, corresponding to a total integrated luminosity of 656.4 pb-1. The studied reaction is an almost pure QED (Quantum ElectroDynamics) process which, at orders above , is mainly affected by QED corrections, such as soft and hard bremsstrahlung and virtual corrections, compared to which the weak corrections due to the exchange of virtual massive gauge bosons are very small [2, 3, 4]. Therefore, any significant deviation between the measured and the predicted QED cross-sections could unambiguously be interpreted as a manifestation of non-standard physics. Moreover, the differential cross-section terms expressing interferences between QED and various non-standard physics processes, behave very differently from the QED term in their dependence on the scattering angle of the photons with respect to the incident electron/positron. Depending on the possible new physics scenario, a departure of the measured differential cross-section of from the Standard Model expectations, could then be interpreted as a measure of the energy scale of the QED breakdown [5, 6], of the characteristic energy scales of contact interactions [7], of the mass of excited electrons within composite models [8] or of the string mass scale [9, 10] (which could be of the order of the electroweak scale in the framework of models with gravity propagating in large extra-dimensions).
The data recorded by DELPHI at LEP 2 were treated according to common reconstruction procedures, selection criteria and treatment of systematic uncertainties. Previous results concerning the process , using DELPHI LEP 1 data are reported in reference [11]. An analysis of the LEP 2 data collected in 1996 and 1997 can be found in reference [12], while the analysis of the 1998 and 1999 DELPHI data, from which the present analysis framework evolved is reported in [13]. The results reported in the previous publications concerning the analyses of LEP 2 data are superseded by the results hereby reported. The most recently published results from the other LEP collaborations can be found in references [14, 15, 16].
2 Data sample and apparatus
The data analysed were recorded with the DELPHI detector at LEP 2 from 1996 through 2000. They were grouped in ten subsets, as listed in table 1, according to their centre-of-mass energy value or, in the case of the year 2000 data, split in two sets corresponding to different data processings (reconstruction procedures). This was made necessary due to an irreversible failure in a sector of the Time Projection Chamber, one of the most important tracking detectors, during the last part of the data taking period.
Events were generated for all the processes at the different centre-of-mass energies and passed through the full DELPHI simulation and reconstruction chain. The event generator used to simulate the QED process was that of reference [2] while Bhabha () and Compton () scattering111Compton events are produced when a beam electron is scattered off by a quasi-real photon radiated by the other incoming electron, resulting mostly in final states with one photon and one visible electron, the remaining being lost in the beam pipe. backgrounds were simulated with the BHWIDE [17] and TEEG [18] generators and events, including events, were generated with KORALZ [19]. Two photon collision events, yielding final states, were generated with BDK/BDKRC [20].
The luminosity corresponding to the data sets analysed was measured by counting the number of Bhabha events at small polar angles [21]. These were recorded with the Small angle TIle Calorimeter (STIC) that consisted of two cylindrical electromagnetic calorimeters surrounding the beam pipe at a distance of 220 cm from the interaction point, covering the polar angle222The polar angle, , was defined with respect to the direction of the electron beam. range from 2∘ to 10∘ and from 170∘ to 178∘.
Photon detection and reconstruction relied on the trigger and energy measurements provided by the electromagnetic calorimeters: the STIC, the High density Projection Chamber (HPC) in the barrel region and the Forward ElectroMagnetic Calorimeter (FEMC) in the endcaps. The HPC was a gas-sampling calorimeter, composed of 144 modules, each with 9 longitudinal samplings in 41 lead layers and a scintillator layer which provided first and second level trigger signals. It covered polar angles between 42∘ and 138∘. The FEMC was a lead glass calorimeter, covering the polar angle regions and . The barrel DELPHI electromagnetic trigger [22] required coincidences between scintillator signals and energy deposits in the HPC while in the forward region the electromagnetic trigger was given by energy deposits in the FEMC lead-glass counters.
The tracking system allowed the rejection of charged particles and the recovery of photons converting inside the detector. The DELPHI barrel tracking system relied on the Vertex Detector (VD), the Inner Detector (ID), the Time Projection Chamber (TPC) and the Outer Detector (OD). In the endcaps, the tracking system relied also on the VD and the TPC (down to about 20∘ in polar angle), and on the Forward Chambers A and B (FCA, FCB). The VD played an important role in the detection of charged particle tracks coming from the interaction point.
3 Event selection
Preselection requirements enabled the rejection of most final states not compatible with multi-photon events. Energy deposits in the HPC, FEMC and HCAL were used if their energy was greater than 500 MeV, 400 MeV and 900 MeV respectively. The multiplicity of well reconstructed charged particle tracks was required to be less than 6, where a well reconstructed charged particle track had to have momentum above 200 MeV/c, and impact parameters below 4 cm/ and 4 cm respectively, below 1.5 and could not have left signals in the VD only. Events containing signals in the muon chambers were rejected and the visible energy (in the polar angle range between 20∘and 160∘) was required to be greater than 0.1. After the application of the preselection requirements, the data sample was dominated by Bhabha and Compton scattering events. At =206 GeV, they amounted respectively to about 81% and 9% of the preselected simulated sample, while the events constituted about 3%. The remaining 7% corresponded to (4%), (1%) and (0.7%) events and to residual contributions from other processes. The next steps of the analysis consisted in first reconstructing photons, then selecting multi-photonic final states and finally selecting events.
3.1 Photon reconstruction
Photons are characterised by leaving energy in the electromagnetic calorimeters and no signals in the tracking devices, with the exception of photons converting within the tracking system. In both cases, the information provided by the calorimeters can be the input for photon reconstruction algorithms. A clustering algorithm was therefore developed, consisting of a double cone centered on calorimeter energy deposits, in which the inner cone should contain the energy deposited by the photon, while the absence of calorimetric deposits or charged tracks beyond a predefined energy threshold in the outer cone should ensure its isolation from other objects.
The parameters of the double-cone algorithm were optimized for the selection of the signal events using simulated () events. The best performance was obtained by choosing two cones with vertex in the geometric centre of the DELPHI detector and half-opening angles of 10∘ and 12∘ respectively. The energy in the inner cone was required to be above 5 GeV, while the total energy collected in the region between the two cones had to be below 5 GeV.
3.2 Selection of multi-photonic events
The main contamination to () events after preselection and photon reconstruction came from radiative Bhabha events with one non-reconstructed electron and the other electron lost in the beam pipe and from Compton scattering () events. Both backgrounds were dramatically reduced using the Vertex Detector as a veto against charged particles coming from the interaction point. Other sources of contamination of photonic final states such as calorimeter noise were eliminated by taking into account the profile of photonic showers in the electromagnetic and hadronic calorimeters. The photon identification criteria based on the response of the VD and of the calorimeters are listed below:
-
•
Charged particles coming from the interaction point were rejected by requiring that no VD track element333 A VD track element was defined by the presence of at least two signals in different VD layers separated in azimuthal angle by at most 0.5∘. was within 3∘ in azimuthal angle444 The azimuthal angle, , in the plane transverse to the beam direction, was defined with respect to the x-axis pointing to the centre of LEP. from photons reconstructed in the barrel. The corresponding angle in the endcaps was 10∘.
-
•
In order to be compatible with the energy profile of photons in the HPC, particles reconstructed within the polar angle range were required to either have energy deposits in at least 3 HPC layers - each containing more than 5% of the electromagnetic energy of the particle - or to have their azimuthal angle coinciding with the HPC modular divisions within 1∘.
-
•
Noise in the FEMC crystals was rejected by requiring that particles reconstructed within the FEMC acceptance had given signals in at most 50 lead-glass blocks and that at least 15% of their electromagnetic energy was in one of the blocks.
-
•
Photons reaching the hadronic calorimeter should leave all their energy in its first layer, therefore, the reconstructed particles were required to have less than 5 GeV of hadronic energy associated to them or that at least 90% of their hadronic energy component was recorded in the first layer of the HCAL.
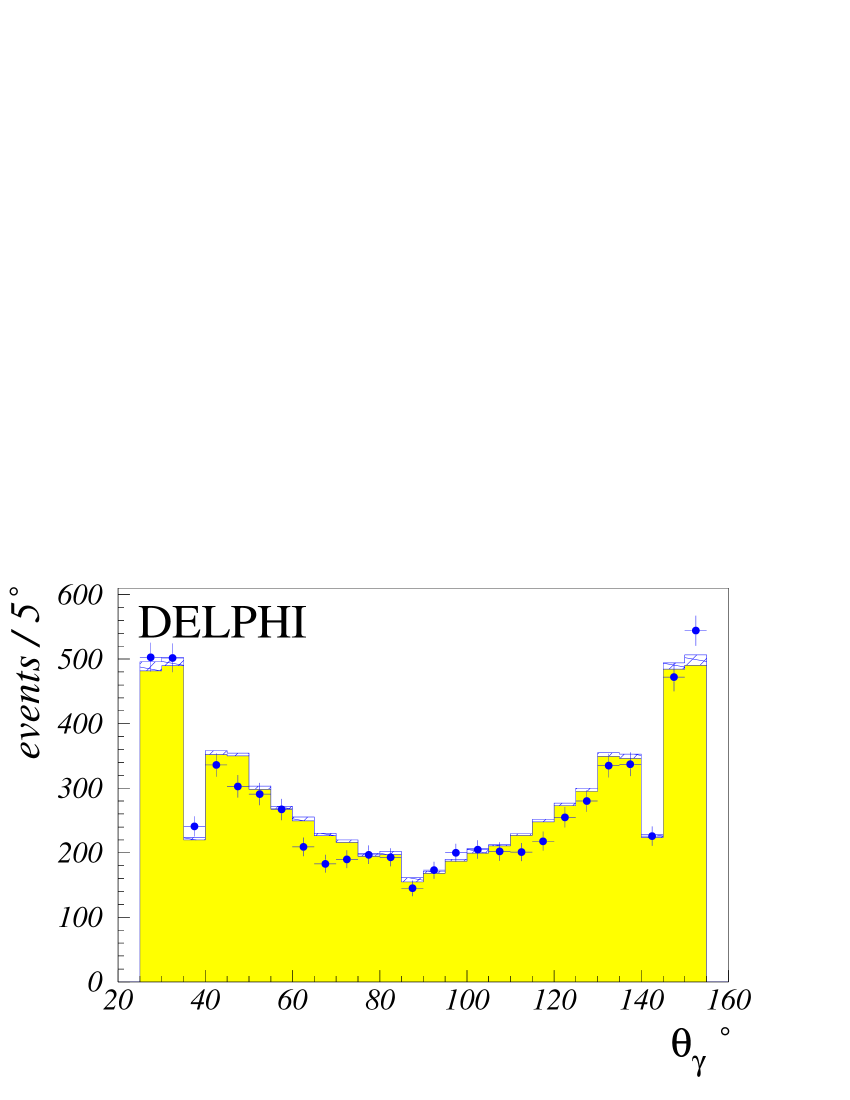
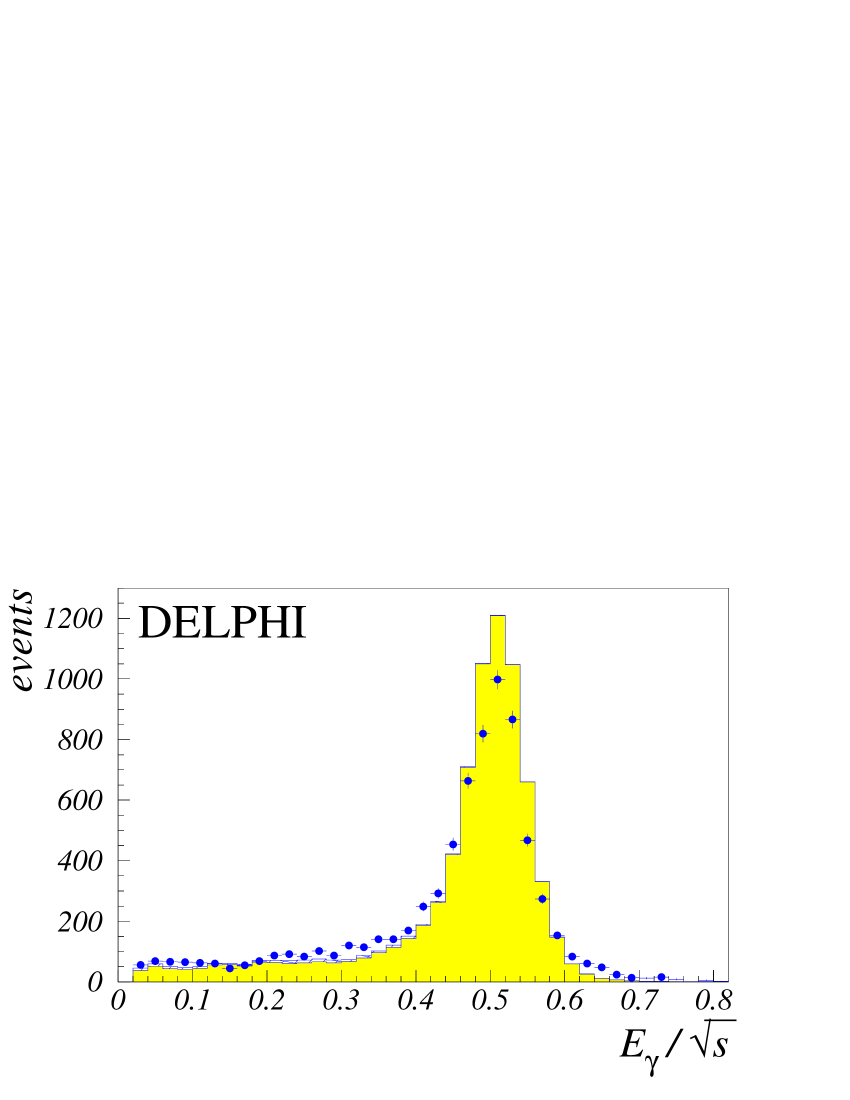
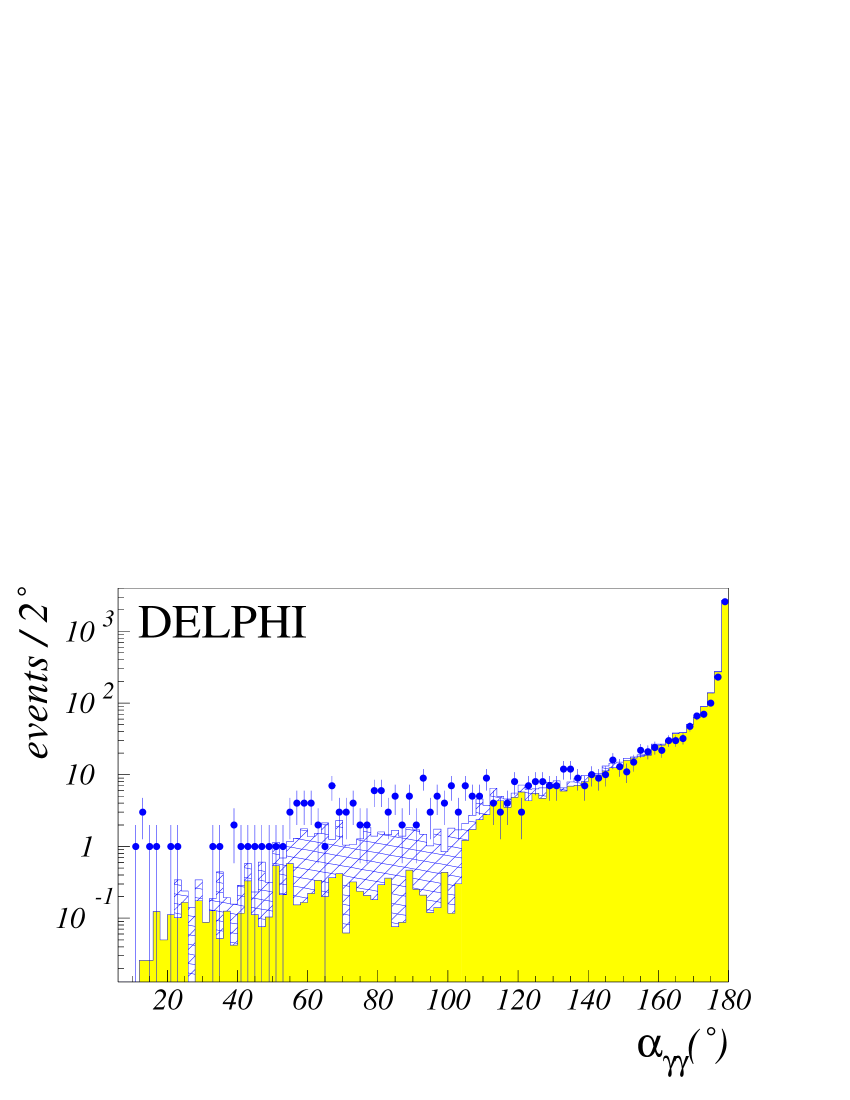
The selected sample consisted of events with at least two reconstructed particles fulfilling the photon reconstruction requirements and background rejection criteria described above. The two most energetic photons had to be located in the polar angle range between 25∘ and 155∘ and at most one converted photon, i.e. a reconstructed photon associated to well reconstructed charged particle tracks not associated to VD track elements, was allowed per event. The numbers of events thus selected from real and simulated data are compared, as a function of , in table 2. Figure 1 displays the selected event distributions of the polar angle, of the photon energy (normalised to ) and of the angle between the two most energetic photons for the full data set and compares them to the Standard Model predictions. For all distributions, the solid circles represent real data events, the shaded histogram represents the prediction and the hatched histogram the remaining background processes: Bhabha and Compton scattering and events. An overall deficit of about 4.5% was observed in the global data set with respect to the simulation predictions. It is attributed to the photon trigger efficiency, which is lower in the barrel region of the detector, and to differences between the real detector and its simulated description, especially in aspects of the calorimeter performances. Both effects are discussed and accounted for in section 4.
3.3 Selection of events
Events were considered as possibly due to the process if they contained two photons and no other reconstructed particles. Moreover, the two photons had to:
-
•
have an energy greater than 0.15 each;
-
•
be separated by a spatial angle of at least 130∘;
-
•
be contained within the polar angle acceptance of the VD and of the electromagnetic calorimeters:
.
The selection resulted in a very low rate of expected background events. The contamination from Bhabha events was already small after the selection criteria for multi-photon events were imposed (see table 2), while the contribution from Compton scattering and events was drastically reduced mainly by the requirement that the spatial angle between both photons was large, but also by the energy cut. The total contamination in the samples was found to be less than 0.2%. Since this contamination corresponded to a very small number of background simulated events, it was fully taken into account as a systematic uncertainty in the determination of the cross-section for . The final numbers of selected and expected events are given in table 3.
4 Determination of the Born level cross-section for the process ()
The analysis of the process was based on the study of distributions of for the selected samples, where is the polar angle of the photons with respect to the direction of the incident electron in the centre-of-mass of the collision. is defined by:
| (1) |
where and are the polar angles of the photons in the laboratory frame. This parameterisation of the polar angle of the photons enables the measurement of the differential cross-section of to be insensitive to Initial State Radiation photons radiated collinearly to the beam.
In the present analysis, the retained acceptance was divided into 16 intervals: the barrel part of the detector, corresponding to with 14 bins (each covering = 0.0505, except for the last two, for which = 0.045) and the forward region, corresponding to , which was divided in two equal bins.
4.1 Evaluation of the selection efficiency
The efficiency for selecting the samples was evaluated as a function of using simulated sets of events generated at different centre-of-mass energies. The average selection efficiency in the barrel region of DELPHI was close to 80%, whereas in the endcaps it was found to be about 52% for data taken prior to 1999 and 62% for the remaining data, resulting from improvements in the particle reconstruction algorithms used for the forward region of DELPHI.
Small differences between the real detector response and the detector simulation were observed. These differences came from aspects of the performance of the calorimeters, and were essentially caused by the limited accuracy of the simulation description in the edges of HPC modules. Differences due to the description of the amount of material in front of the calorimeters could also arise, especially in the endcaps. In order to investigate these differences, sets of real and simulated Bhabha events were selected using the information provided by the tracking devices alone. The two photon selection criteria based on calorimeter information were then imposed on the selected samples. The differences between the effect of the selection criteria on real and simulated data were then parameterised as a correction factor , which was taken as the ratio between simulated and real data rates of Bhabha events fulfilling all criteria. The correction factor reflects the necessary correction to the selection efficiency as evaluated from the simulation of ().
The corrections to the selection efficiency were evaluated as a function of the interval and of . Their average value for each analysed data set was found to be above 1.0 by 1% to about 2.8%, depending on the data set, reflecting an over-estimation of the selection efficiency. The main contribution for this difference was found to come from the barrel region of DELPHI, with exception for the 206.3 GeV data set where the correction to the selection efficiency in the endcaps amounted to 4.7%. The average selection efficiencies, for the barrel and endcaps of DELPHI, including the corresponding corrections are displayed in table 3 as a function of .
4.2 Evaluation of the trigger efficiency
The trigger efficiency for final states without photon conversions was computed with Bhabha () events and using the redundancy of the electromagnetic trigger with the track trigger. It was evaluated as a function of for each data set and taking into account the different trigger settings.
The trigger efficiency values in the forward region were close to 100% for all data sets. As for the barrel region, average values close to 97% were obtained. The lower value obtained for the 172 GeV data set (78%) was due to a malfunctioning of the barrel single photon trigger, present during part of the 1997 data taking period. The average trigger efficiencies for the barrel and endcaps are displayed in table 3.
Final states with one converted photon, were triggered by the single track coincidence trigger, whose efficiency was nearly 100% [22].
4.3 Radiative corrections
The event selection does not correspond to the Born level contribution from since no selection criteria can remove the higher order contributions coming from soft bremsstrahlung and the exchange of virtual gauge bosons. In order to take such higher order corrections into account, the radiative effects were estimated using the () physics generator of Berends and Kleiss [2] which computes the cross-section for up to . The radiative correction factor was evaluated as a function of by generating events at the average centre-of-mass energy value corresponding to each data set, although its variation within the considered range was negligible. It was taken as the ratio between the () cross-section computed up to order to the Born level cross-section (), which for a given acceptance (including the complement with respect to 90∘) is given by:
| (2) |
The radiative correction factor ranged between 1.03 for events with high values (forward events) and about 1.07 for low values of , and are displayed as a function of in table 4.
4.4 Systematic uncertainties
The systematic uncertainty on the cross-section measurement was obtained for each interval and for the ten data subsets by adding in quadrature the respective relative residual background expectations, the uncertainties on the selection efficiency and on the corresponding correction, the uncertainty on the trigger determination, the statistical error on the radiative corrections determination and the uncertainty from the determination of the luminosity.
The uncertainty on the determination of the selection efficiency had three components, coming from the statistical uncertainty due to the finite Monte Carlo statistics, from the uncertainty on its correction and from the experimental resolutions of the variables used in the selection. The latter were, as described in sections 3.3 and 4, the angle between the two photons, their energy and . The uncertainties were evaluated, for each of the () simulated samples, from the distributions of the difference between the values of the corresponding variables at generator level and after being passed through the full detector simulation and reconstruction chain. The uncertainties on the energy of the photons were taken as the r.m.s. values of Gaussian fits to these difference distributions. The same procedure was followed for the uncertainty on which was evaluated independently for each interval. The uncertainty on the spatial angle between the photons was taken as the quadratic sum of the shift in the central value and of half of the full width at half maximum of the distributions.
The uncertainty in the luminosity determination had both experimental and theoretical contributions. The experimental contribution corresponds to a 0.5% systematic uncertainty in the measurement of the luminosity. The theoretical contribution to the luminosity determination uncertainty was taken to be 0.25%, from the Bhabha event generator BHLUMI [23]. A total error of 0.56% on the luminosity determination was therefore obtained by adding in quadrature both the experimental and theoretical uncertainties.
The overall values for the systematic uncertainty associated to each data sample are presented in table 5, as well as the specific contributions coming from different sources of systematic error. The dominant contribution to the systematic error came from the uncertainty on the determination of the selection efficiency.
4.5 Cross-section for
The differential cross-section for was computed for each interval () as:
| (3) |
where is the integrated luminosity of the considered data set, is the corresponding number of selected events, is the corresponding product of trigger efficiency and selection efficiencies (including corrections) and is the radiative correction factor. The numbers of events selected from each data sample, are compared to the simulation predictions (accounting for trigger efficiency and for selection efficiency corrections) in table 3. A total number of 2679 events were selected from data while 276115 were expected from the () simulation, taking into account the trigger efficiency and the selection efficiency corrections. In table 6, the number of events and efficiency (the product of trigger and selection efficiencies) are displayed for each data set as a function of .
For the purpose of combining the DELPHI data with the data taken by the other LEP experiments, a different binning is used in table 7 to display the numbers of events and the analysis efficiency for a subsample of 2206 events, among the the 2679 events selected. The corresponding radiative correction factors are displayed as a function of in table 4.
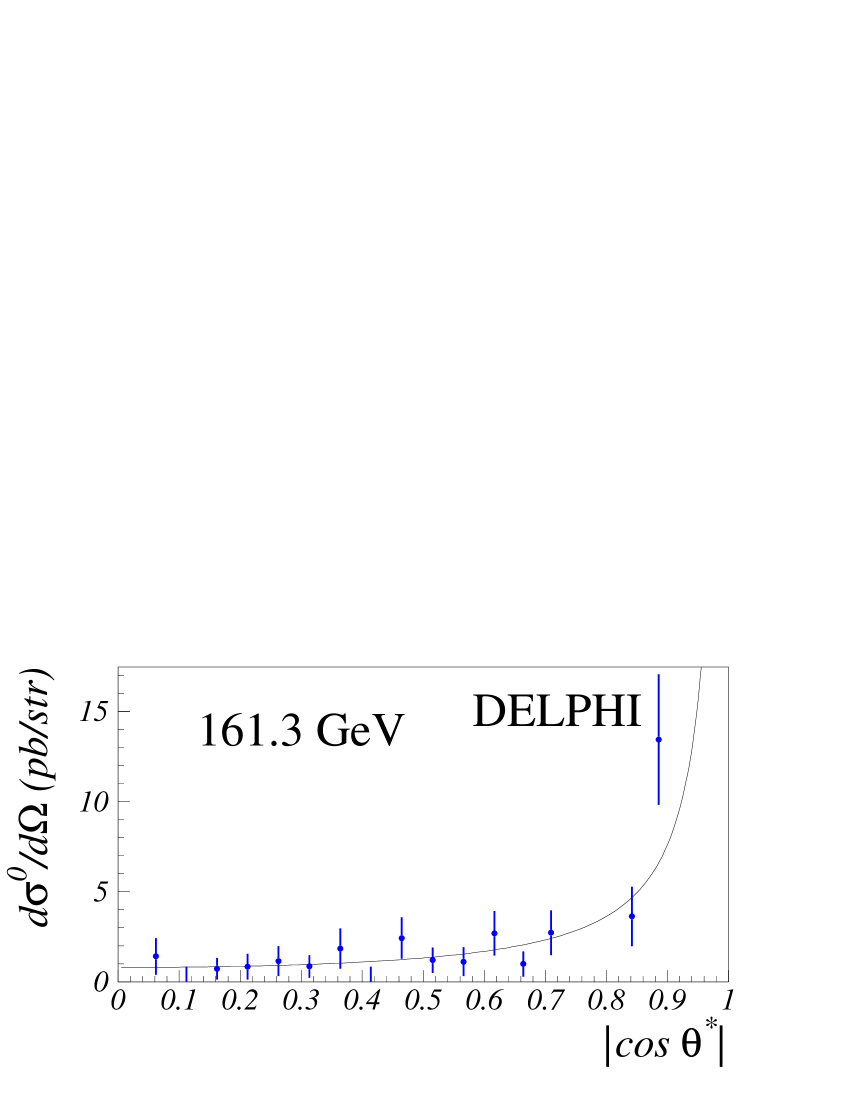
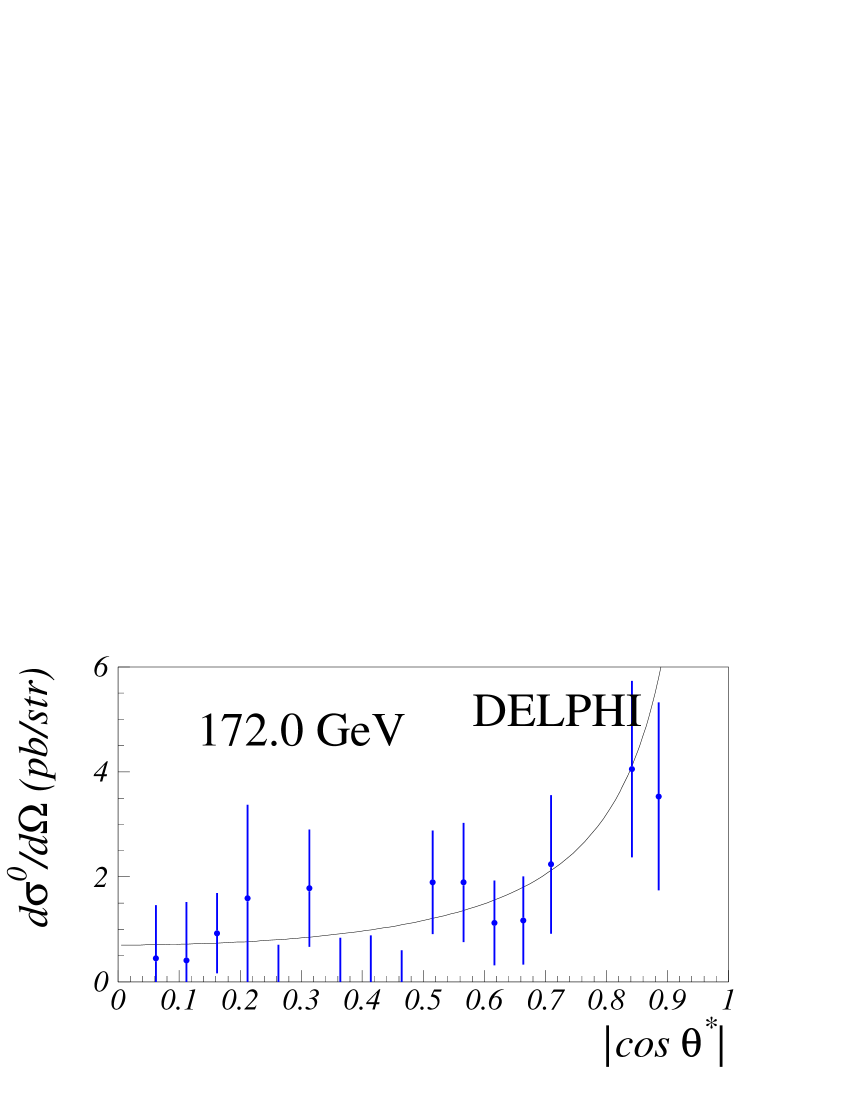
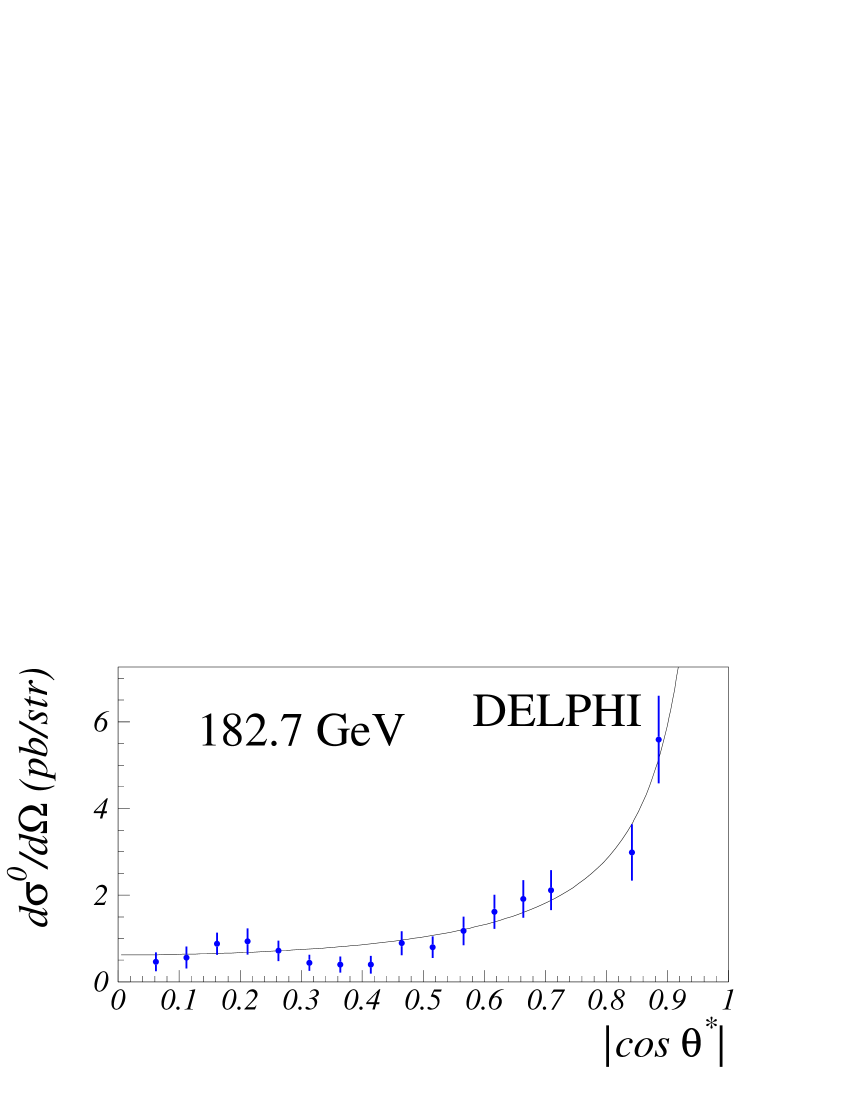
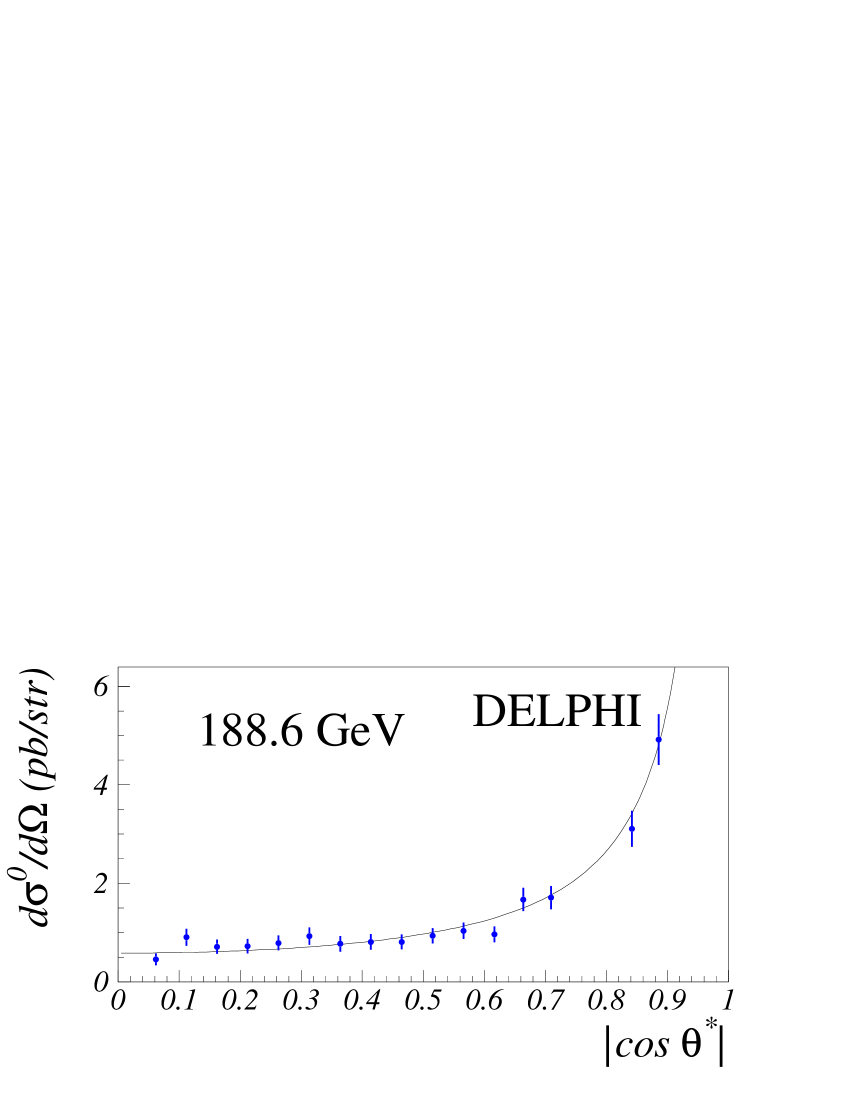
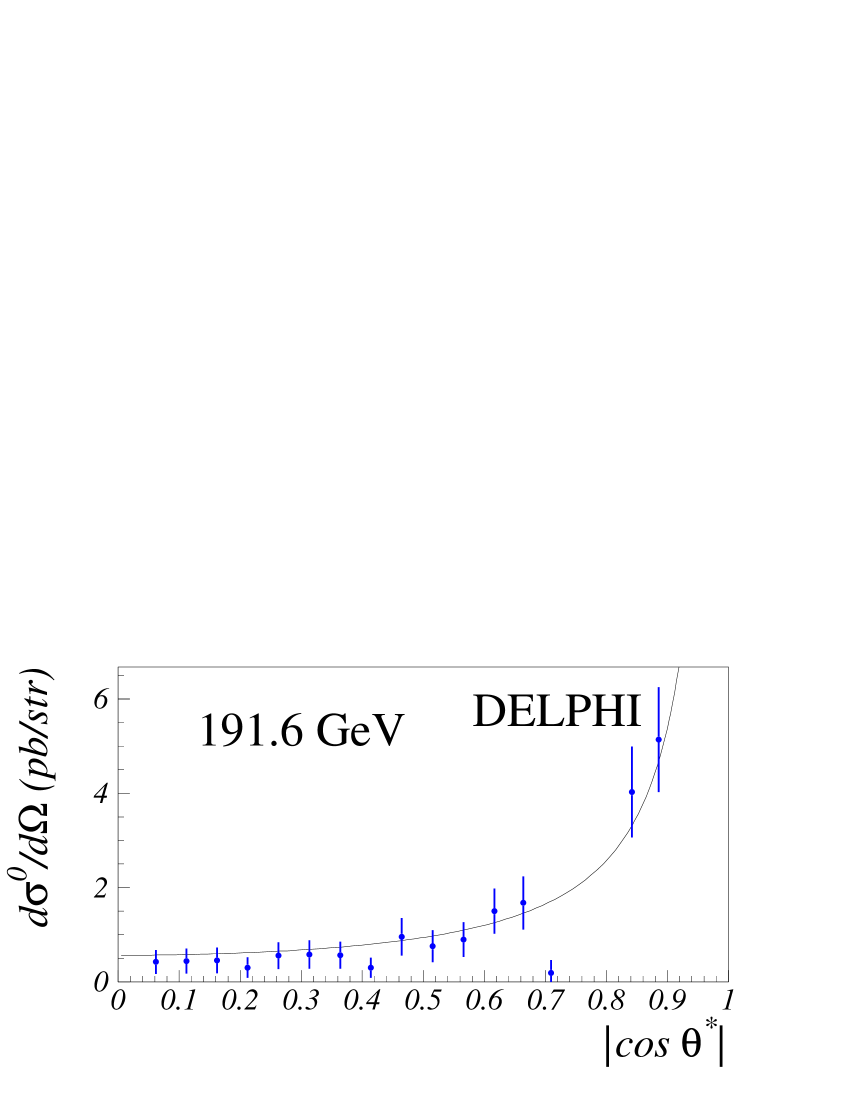
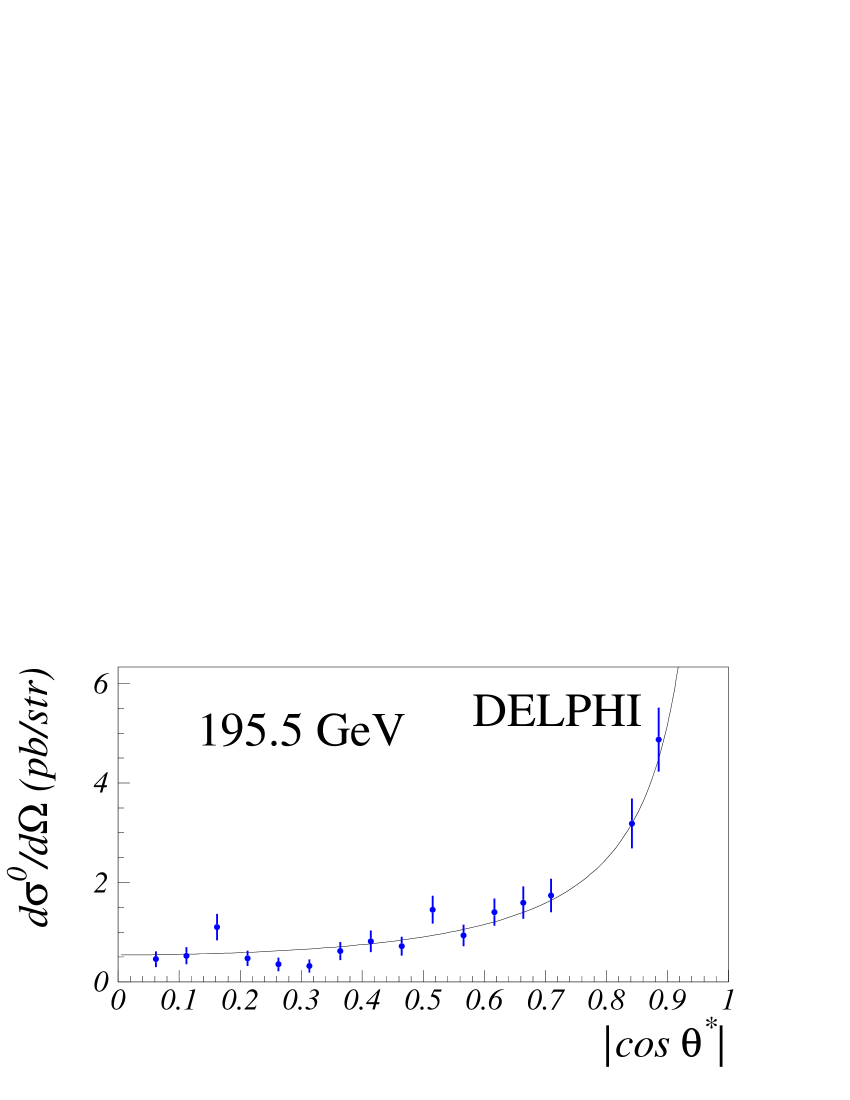
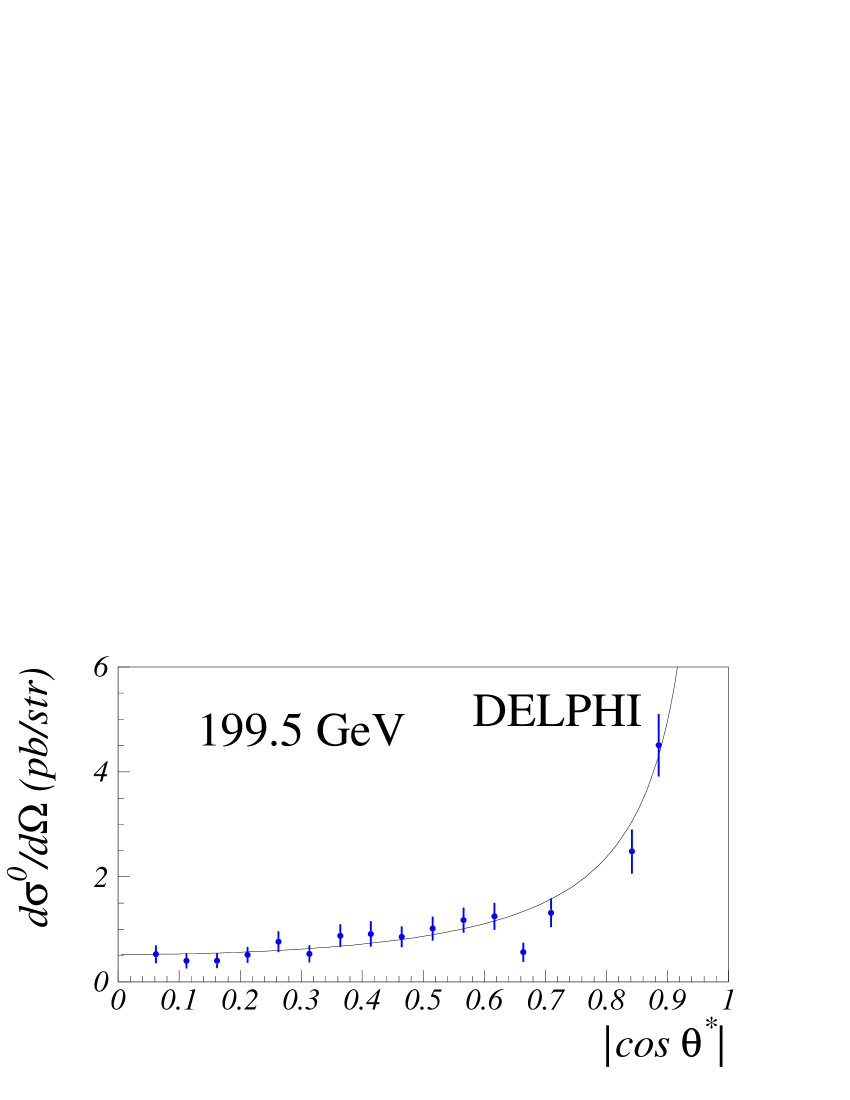
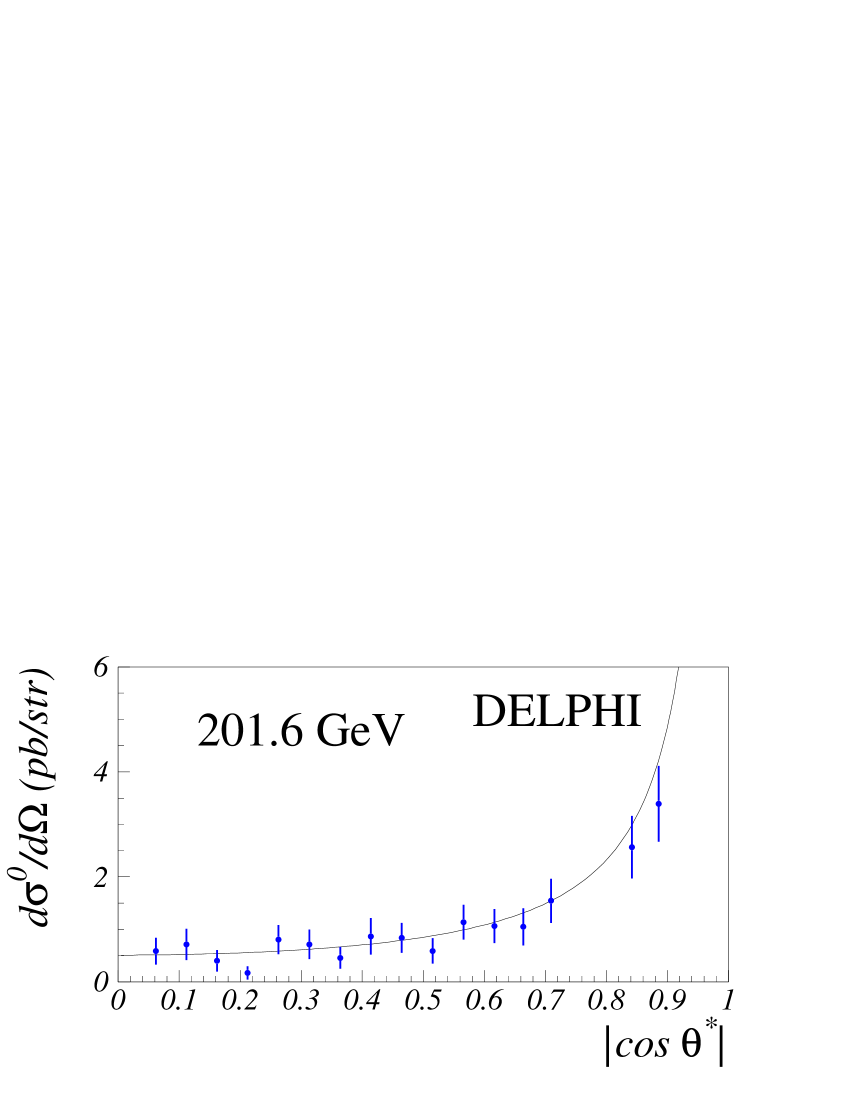
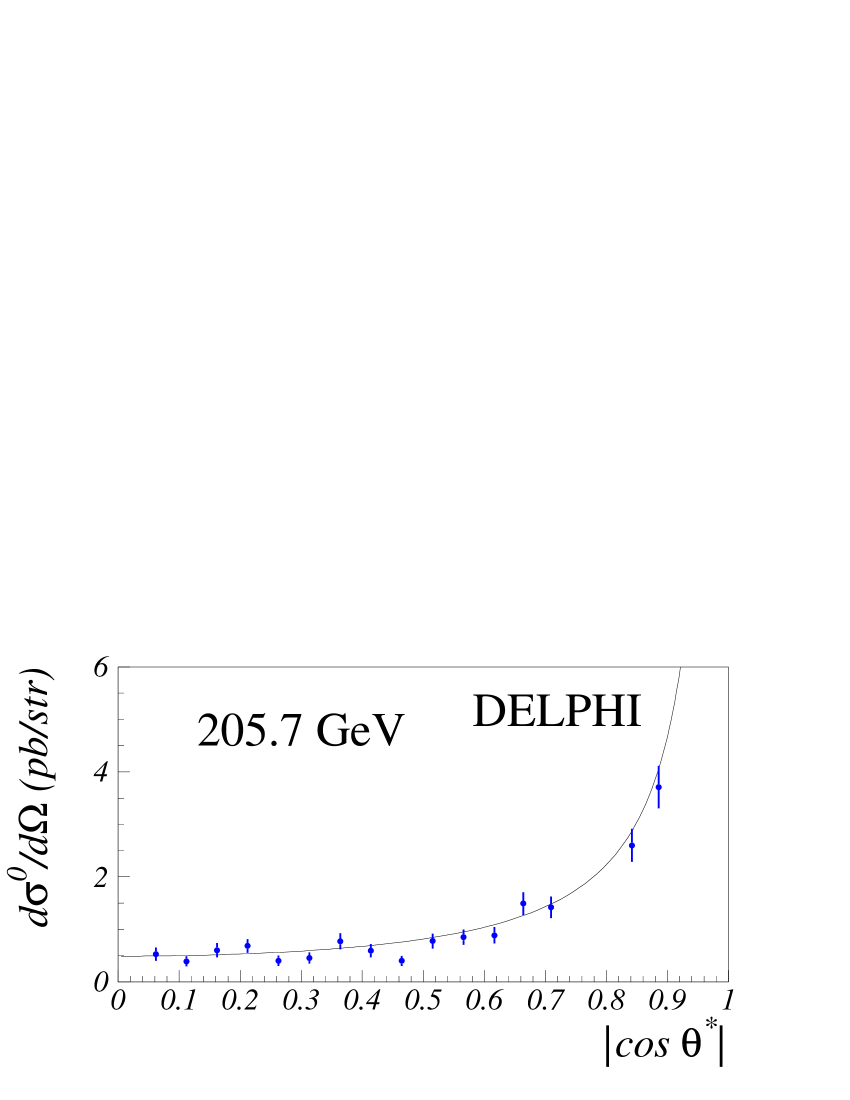
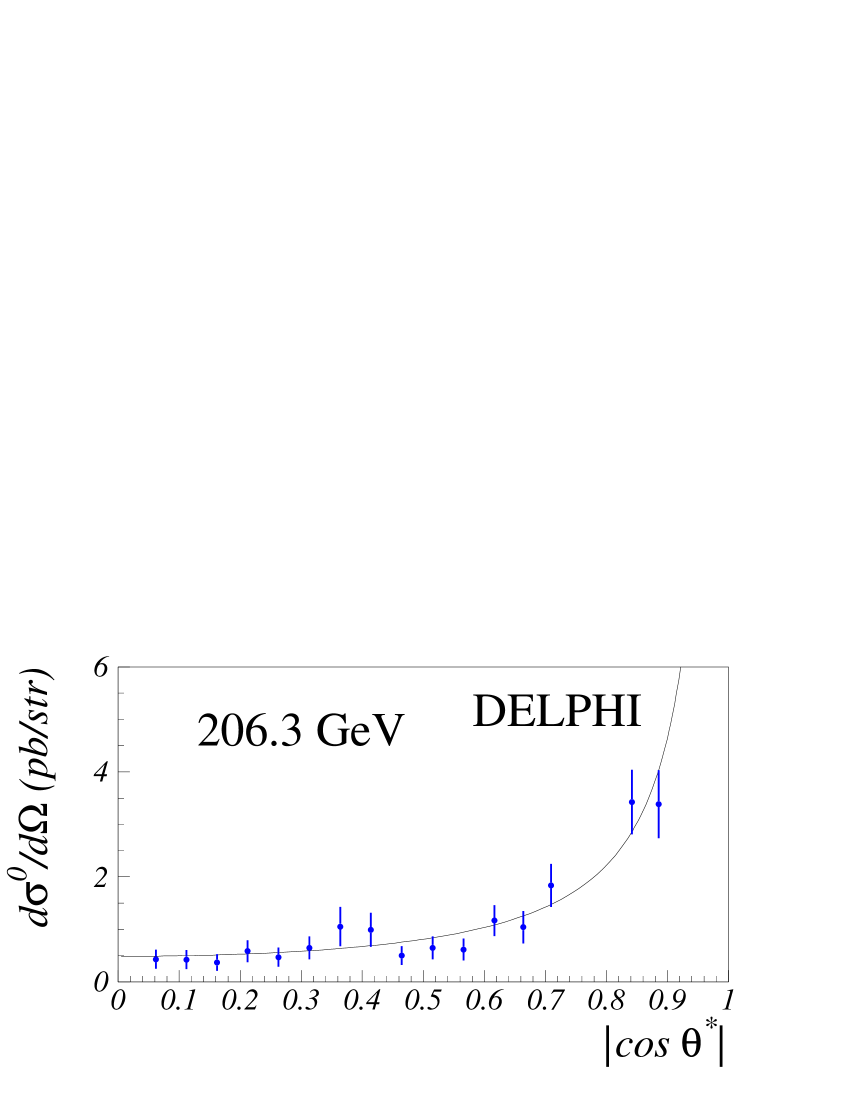
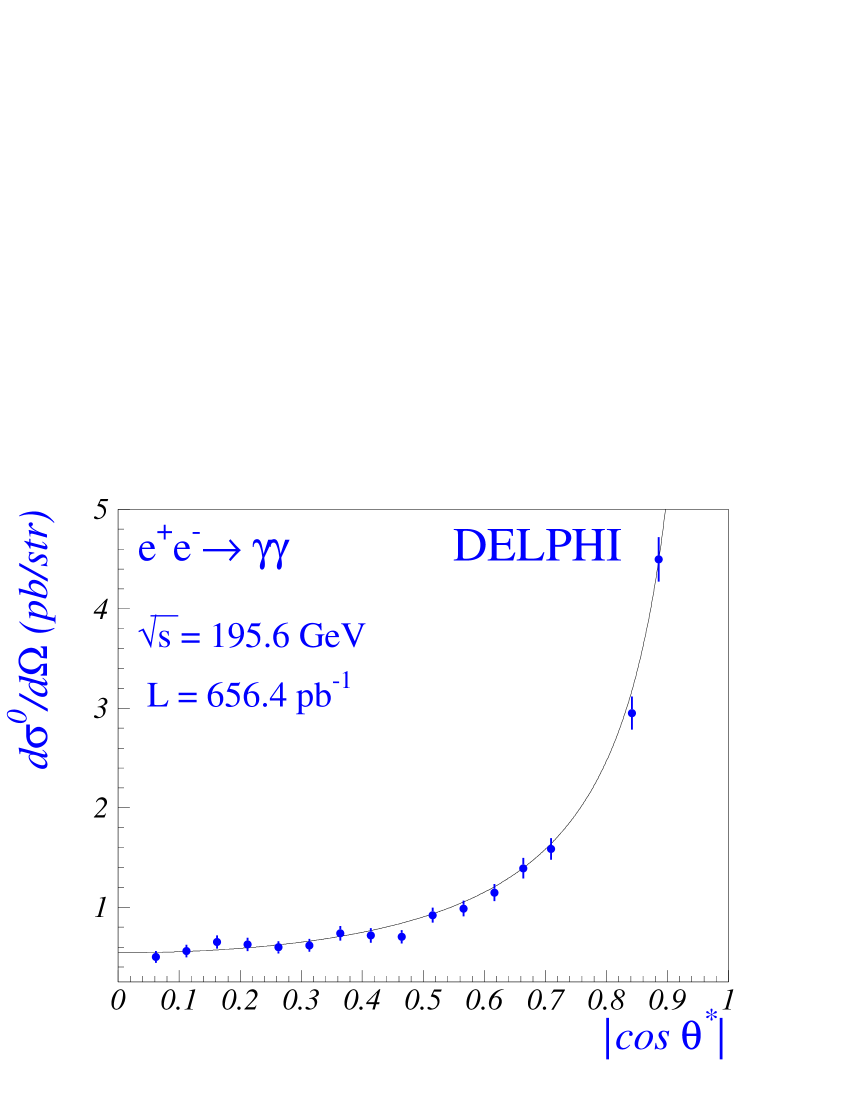
The Born level differential cross-section distributions for the ten data sets are compared in figure 2 to the corresponding theory predictions. An average centre-of-mass energy of 195.6 GeV was calculated for the entire data sample by weighting the integrated luminosities of the ten data sets by the corresponding factor, in order to take into account the dependence of the Born level cross-section on the centre-of-mass energy (equation 2). The average differential cross-section is compared to the theoretical prediction in figure 3 (top) and in table 8. It was computed for each interval from expression 3, where was the integrated luminosity of the full data set and the third fraction was replaced by the sum of the number of events in each bin divided by the corresponding correction, consisting of the product of the efficiency and of the radiative correction factor.
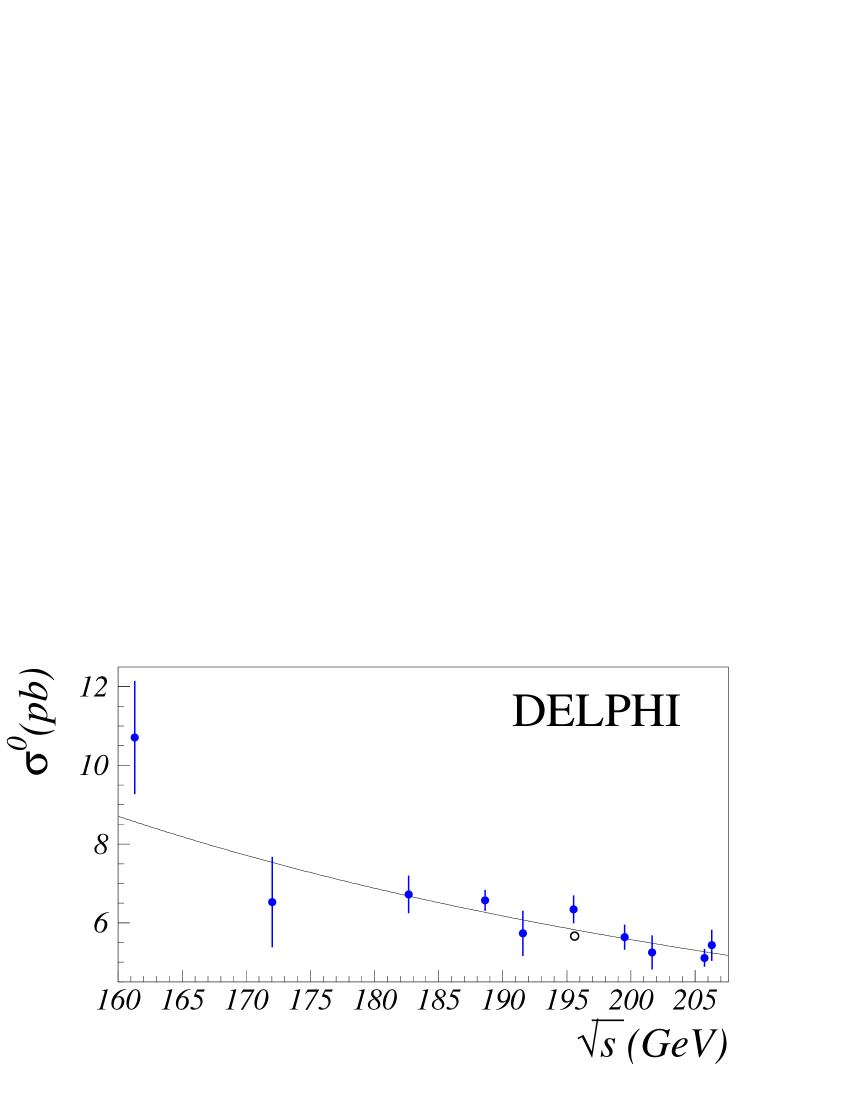
The total visible cross-section for the process , integrated over the full acceptance, i.e. , was evaluated for each centre-of-mass energy, using the expression:
| (4) |
The visible cross-section measurements as a function of are compared to theory in figure 3 (bottom) and their values (with statistical and systematic uncertainties) are displayed in table 9. The of the measured differential cross-section distributions with respect to theory555The theoretical uncertainty on the QED prediction, estimated to be below 1%, was neglected. were computed for each data set and are also presented in table 9, showing the agreement between the measurement and theory. The total visible cross-section at the average centre-of-mass energy of 195.6 GeV was computed as the ratio between the sum of the number of events found in each bin and for all data sets, corrected by the corresponding factors, and the integrated luminosity of the full data sample. The obtained cross-section was pb, in agreement with the pb expectation from the Standard Model.
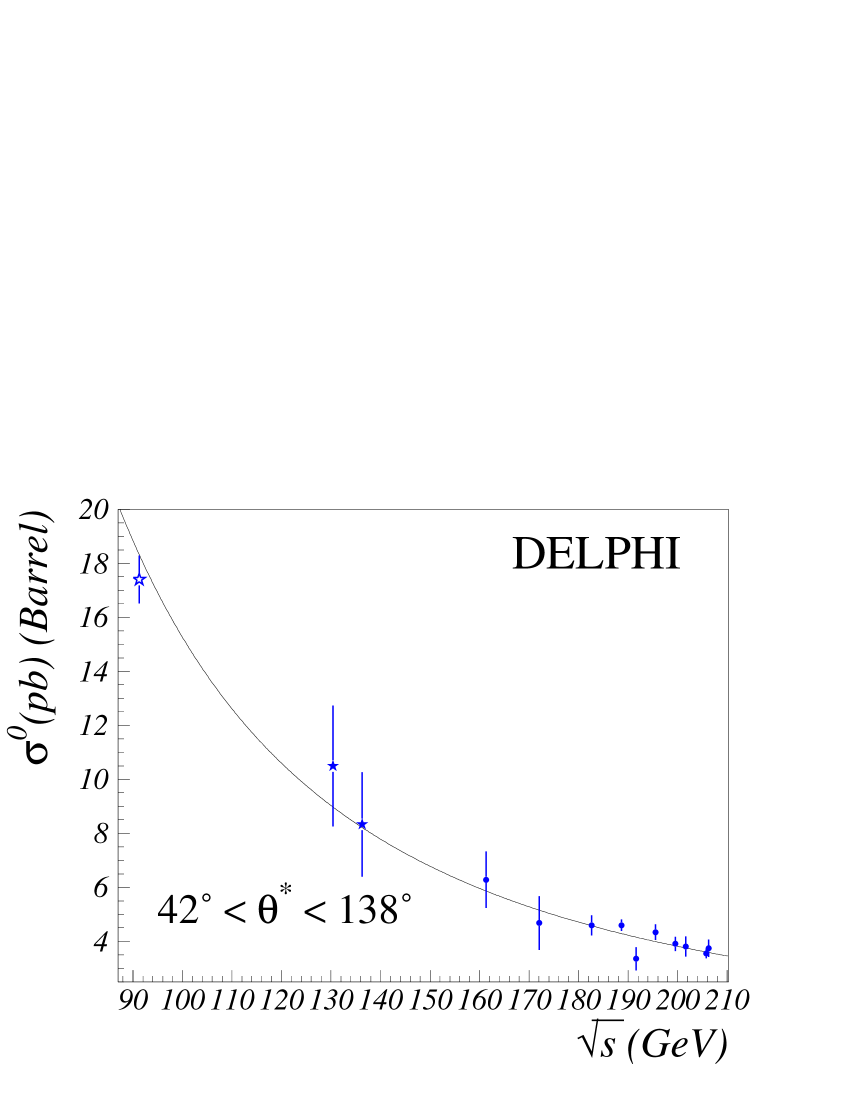
The Born level cross-section measurements in the region , were corrected to the full barrel acceptance of DELPHI, , and the obtained values are displayed in figure 4 as a function of the centre-of-mass energy, along with previously published results, derived from LEP 1 data collected between 1990 and 1992 [11] and from LEP 1.5 data collected at =130-136 GeV [12].
5 Deviations from QED
Possible deviations from QED are described in the context of several different models in which the Born level differential cross-section for is expressed, as in (5), as the sum of the QED term and of a deviation term, the latter parameterised as a function of an energy (or mass) scale of relevance for the model tested.
| (5) |
The 95% C.L. lower limits on the free parameters – energy/ mass scales – for different models were extracted using binned maximum likelihood functions. These were built as the joint probabilities for the number of observed events in each bin and data set, given the number of expected events from theory. For each model, the number of expected events was a function of the corresponding parameter, written in the form of an estimator , which, whenever possible, was chosen to yield an approximately Gaussian distribution for the likelihood function. The systematic uncertainties were taken into account as the r.m.s. values of Gaussian probability density functions of free normalization parameters. The maximization of the likelihood functions was performed using the program MINUIT [24]. For each model, the results were translated in terms of central and positive and negative r.m.s. values for the estimators, whereas the 95% C.L. lower limits for the parameters were obtained by renormalising the joint probability distribution to their physically allowed region [25].
The different models and the 95% C.L. lower bounds derived for the corresponding parameters presented in detail in the following sections are summarised in table 10.
5.1 QED cutoff
The most general way to parameterise a deviation from QED is by the introduction of a QED cutoff, representing the energy scale of the QED breakdown, , [5, 6]. This is the scale up to which the interaction can be described as point-like. The deviation cross-section would be given by expression (6) (where is the fine-structure constant) which allows for negative and positive interference in the form of the parameterisation.
| (6) |
The result of the maximum likelihood fit to data yielded TeV-4 for the estimator , resulting in lower bounds for the energy scale of the QED breakdown of 379 GeV and 300 GeV for and , respectively.
5.2 Search for contact interactions
Bounds on the mass scale of the contact interaction can be parameterised in different ways, depending on the dimensionality of the effective Lagrangian describing the interaction [7]. Operators of dimension 6, 7 and 8 translate into the characteristic scales , and . The corresponding deviation cross-sections can be expressed as:
| (7) | |||
| (8) | |||
| (9) |
where is the electron mass.
Maximum likelihood fits to data yielded the results TeV-4, TeV-6 and TeV-8, resulting in 95% C.L. lower bounds on the characteristic energy scales for contact interactions, , and of 1.5 TeV, 790 GeV and 21 GeV respectively.
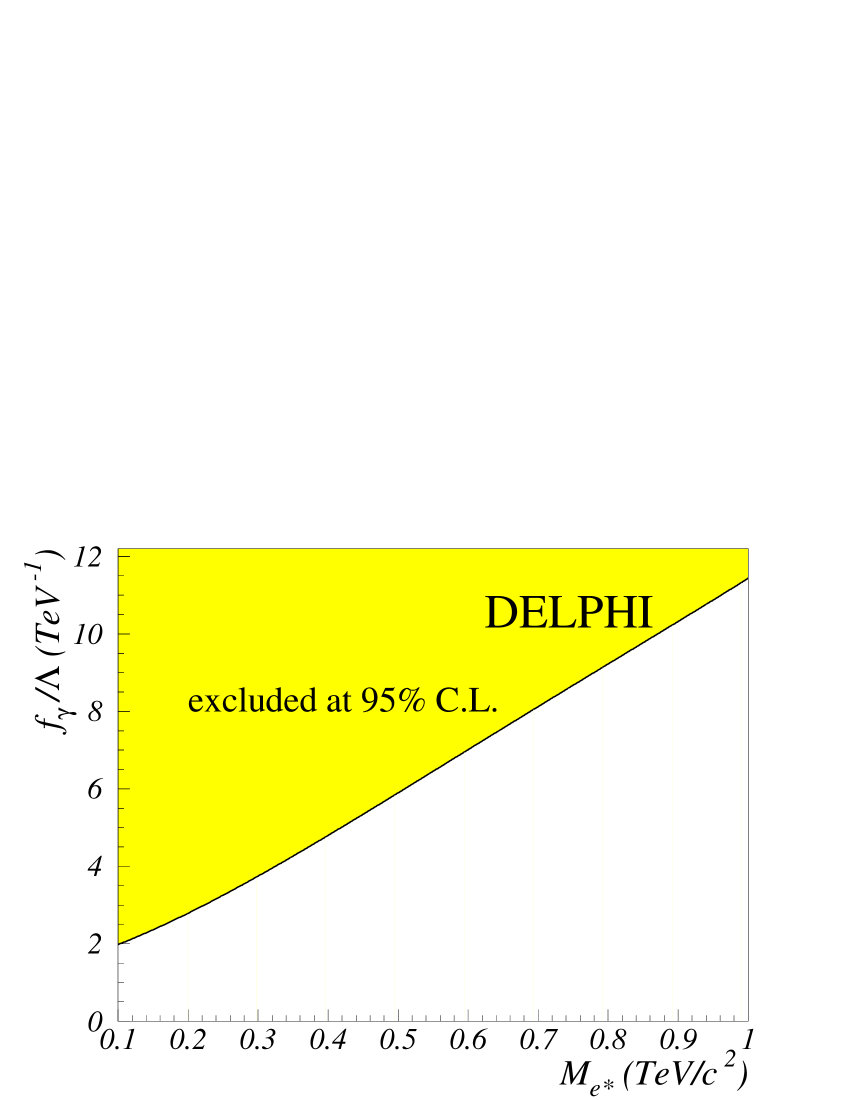
5.3 Search for excited electrons
Within the framework of composite models, deviations from QED could also follow from the t-channel exchange of an excited electron. In the case of an chiral magnetic coupling [8], the deviation from the QED differential cross-section is expressed by:
| (10) |
where is the imaginary number and Y=1+, being the mass of the excited electron. is the coupling constant with , where and are weight factors associated to the different gauge groups.
In order to derive a lower bound on the excited electron mass, was set to in expression (10). A 95% C.L. lower bound = 295 GeV/ was derived, corresponding to (TeV/c2)-4. In addition, limits on the coupling constant as a function of were derived by performing a scan over and are presented in figure 5.
The framework adopted in the interpretation of the previous DELPHI results [12, 13], corresponding to a purely magnetic coupling [26], is strongly limited by measurements [27, 28] for the energy scales accessible at LEP. In such a framework, the maximum likelihood fit yielded (TeV/c2)-4 and the 95% C.L. lower bound on was 356 GeV/c2 (for =1, where ).
5.4 Search for TeV-scale quantum gravity
The phenomenological implications of large extra-dimensions [9, 10] have lead to the suggestion of the possibility of observing the effect of virtual graviton exchange at LEP as a departure of the differential cross-section for from the QED prediction. The deviation cross-section, given by expression (11), can be parameterised as a function of the string mass scale , which in some string models could be as low as the electroweak scale, and of a phase factor, , conventionally taken to be 666The ratio which follows the notation of [29] is related to the quantum gravity scale in Ref. [9] as: ..
| (11) |
A maximum likelihood fit yielded (TeV/c2)-4, resulting in lower limits on the string mass scale of 771 GeV/ and 985 GeV/ for and , respectively.
6 Summary
The reaction () was studied using the LEP 2 data collected with the DELPHI detector at centre-of-mass energies ranging from 161 GeV to 208 GeV, corresponding to a total integrated luminosity of 656.4 pb-1. The differential and total cross-sections for the process were measured. Good agreement between the data and the QED prediction was found. The absence of a deviation from QED was used to set 95% C.L. lower limits on the parameters of models predicting deviations from QED. The QED cut-off parameters and were found to be greater than 379 GeV and 300 GeV, respectively. Lower limits on the characteristic energy scales of contact interactions, TeV, GeV and GeV were obtained. A lower limit for the mass of an excited electron with a chiral magnetic coupling to photon-electron pairs, 295 GeV/c2, was obtained. The possible contribution of virtual gravitons to the process was probed, resulting in the bounds 771 GeV/c2 and 985 GeV/c2 for and respectively (where is a phase factor in some quantum gravity models).
Acknowledgements
We are greatly indebted to our technical
collaborators, to the members of the CERN-SL Division for the excellent
performance of the LEP collider, and to the funding agencies for their
support in building and operating the DELPHI detector.
We acknowledge in particular the support of
Austrian Federal Ministry of Education, Science and Culture,
GZ 616.364/2-III/2a/98,
FNRS–FWO, Flanders Institute to encourage scientific and technological
research in the industry (IWT), Belgium,
FINEP, CNPq, CAPES, FUJB and FAPERJ, Brazil,
Czech Ministry of Industry and Trade, GA CR 202/99/1362,
Commission of the European Communities (DG XII),
Direction des Sciences de la Matire, CEA, France,
Bundesministerium fr Bildung, Wissenschaft, Forschung
und Technologie, Germany,
General Secretariat for Research and Technology, Greece,
National Science Foundation (NWO) and Foundation for Research on Matter (FOM),
The Netherlands,
Norwegian Research Council,
State Committee for Scientific Research, Poland, SPUB-M/CERN/PO3/DZ296/2000,
SPUB-M/CERN/PO3/DZ297/2000, 2P03B 104 19 and 2P03B 69 23(2002-2004)
FCT - Fundação para a Ciência e Tecnologia, Portugal,
Vedecka grantova agentura MS SR, Slovakia, Nr. 95/5195/134,
Ministry of Science and Technology of the Republic of Slovenia,
CICYT, Spain, AEN99-0950 and AEN99-0761,
The Swedish Natural Science Research Council,
Particle Physics and Astronomy Research Council, UK,
Department of Energy, USA, DE-FG02-01ER41155.
EEC RTN contract HPRN-CT-00292-2002.
References
- [1] DELPHI Coll., P. Aarnio et al., Nucl. Instr. and Meth. A303 (1991) 233; DELPHI Coll., P. Abreu et al., Nucl. Instr. and Meth. A378 (1996) 57.
- [2] F.A. Berends and R. Kleiss, Nucl. Phys. B186 (1981) 22.
- [3] M. Bhm and T. Sack, Zeit. Phys. C33 (1986) 157.
- [4] J. Fujimoto, M. Igarashi and Y. Shimizu, Prog. of Theor. Phys. Vol. 77 (1987) 118.
- [5] S. Drell, Annals Phys. 4 (1958) 75.
- [6] F.E. Low, Phys. Rev. Lett. 14 (1965) 238.
- [7] O.J.P. Éboli, A.A. Natale and S.F. Novaes, Phys. Lett. B271 (1991) 274.
-
[8]
B. Vachon,
“Excited electron contribution to the cross-section”,
hep-ph/0103132 (13 March 2001).(new version expected) -
[9]
G.F. Giudice, R. Rattazzi and J.D. Wells,
Nucl. Phys. B544 (1999) 3;
revised version in hep-ph/9811291 (13 March 2000). - [10] K. Agashe and N.G. Deshpande, Phys. Lett. B456 (1999) 60.
- [11] DELPHI Coll., P. Abreu et al., Phys. Lett. B327 (1994) 386.
- [12] DELPHI Coll., P. Abreu et al., Phys. Lett. B433 (1998) 429.
- [13] DELPHI Coll., P. Abreu et al., Phys. Lett. B491 (2000) 67.
- [14] ALEPH Coll., A. Heister et al., Eur. Phys. J. C28 (2003) 1.
- [15] L3 Coll., P. Achard et al., Phys. Lett. B531 (2002) 28.
- [16] OPAL Coll., G. Abbiendi et al., Eur. Phys. J. C26 (2003) 331.
- [17] S. Jadach, W. Placzek and B.F.L. Ward, Phys. Lett. B390 (1997) 298.
- [18] D. Karlen, Nucl. Phys. B289 (1987) 23.
-
[19]
S. Jadach, B.F.L. Ward and Z. Was,
Comp. Phys. Comm. 79 (1994) 503;
S. Jadach, B.F.L. Ward and Z. Was, Comp. Phys. Comm. 124 (2000) 233. -
[20]
F.A.Berends,P.H.Daverveldt and R.Kleiss,
Comp. Phys. Comm. 40 (1986) 285;
F.A.Berends,P.H.Daverveldt and R.Kleiss, Comp. Phys. Comm. 40 (1986) 271. - [21] S.J. Alvsvaag et al., Nucl. Instr. and Meth. A425 (1999) 106.
- [22] DELPHI Trigger Group, A. Augustinus et al., Nucl. Instr. and Meth. A515 (2003) 782.
- [23] S. Jadach, O. Nicrosini et al., “Event Generators for Bhabha Scattering” CERN Yellow Report 96-01, vol 2, p.299.
- [24] F. James, “MINUIT, Function Minimization and Error Analysis, V94.1” CERN Program Library Long Writeup D506, CERN (1994).
- [25] Particle Data Group, C. Caso et al., Eur. Phys. J. C3 (1998) 1.
- [26] A. Blondel et al., CERN-EP-87-50, appeared in Proceedings of ECFA Workshop on LEP 200, CERN 87-08 (ECFA87-108), p.414.
- [27] F.M. Renard, Phys. Lett. B116 (1982) 264.
- [28] S.J. Brodsky and S.D. Drell, Phys. Rev. D22 (1980) 2236.
- [29] J.L. Hewett, Phys. Rev. Lett. 82 (1999) 4765.
| Year | 1996 | 1997 | 1998 | 1999 | 2000 | ||||||||||
|---|---|---|---|---|---|---|---|---|---|---|---|---|---|---|---|
| (GeV) | 161.3 | 172.0 | 182.7 | 188.6 | 191.6 | 195.5 | 199.5 | 201.6 | 205.7 | 206.3 | |||||
| (pb-1) | 8.4 | 8.8 | 49.0 | 152.6 | 25.1 | 75.9 | 82.5 | 40.0 | 160.3 | 54.0 | |||||
| (GeV) | ||||||
|---|---|---|---|---|---|---|
| 161.3 | 69.34 1.99 | 0.990.91 | 0.040.02 | 0.430.04 | 70.8 2.2 | 76 |
| 172.0 | 64.23 1.85 | 0.910.84 | 0.030.02 | 0.460.04 | 65.6 2.0 | 47 |
| 182.7 | 316.97 9.11 | 3.572.03 | 0.060.02 | 2.540.23 | 323.1 9.3 | 304 |
| 188.6 | 892.97 4.81 | 7.990.50 | 0.070.05 | 7.910.73 | 908.9 4.9 | 888 |
| 191.6 | 147.87 1.27 | 1.370.25 | 0.070.01 | 1.550.17 | 150.9 1.3 | 133 |
| 195.5 | 429.80 3.68 | 3.990.74 | 0.190.03 | 4.000.35 | 438.0 3.9 | 437 |
| 199.5 | 453.86 3.91 | 4.160.77 | 0.200.03 | 4.390.33 | 462.6 4.0 | 434 |
| 201.6 | 215.45 1.86 | 1.970.37 | 0.100.02 | 1.730.20 | 219.3 1.9 | 207 |
| 205.7 | 835.04 7.20 | 10.651.54 | 0.380.03 | 8.130.76 | 854.2 7.4 | 804 |
| 206.3 | 275.72 3.16 | 3.550.75 | 0.120.03 | 2.470.28 | 281.9 3.3 | 274 |
| total | 3701.2914.48 | 39.153.19 | 1.230.09 | 33.611.24 | 3775.314.9 | 3604 |
| (GeV) | ||||||
|---|---|---|---|---|---|---|
| Barrel | Endcaps | Barrel | Endcaps | QED | data | |
| 161.3 | 0.7700.020 | 0.5190.026 | 0.970.01 | 1.000 | 51.5 2.8 | 57 |
| 172.0 | 0.7660.020 | 0.5180.026 | 0.780.03 | 1.000 | 41.0 2.5 | 33 |
| 182.7 | 0.7730.015 | 0.5220.025 | 0.9770.005 | 0.9980.001 | 234.1 8.0 | 220 |
| 188.6 | 0.7660.007 | 0.5360.011 | 0.9840.002 | 0.99980.0002 | 666.5 6.8 | 673 |
| 191.6 | 0.7910.007 | 0.6150.014 | 0.9790.007 | 1.000 | 114.6 1.9 | 102 |
| 195.5 | 0.7770.006 | 0.6180.013 | 0.9760.004 | 1.0000 | 327.3 3.8 | 341 |
| 199.5 | 0.7720.007 | 0.6090.013 | 0.9630.005 | 0.99930.0005 | 336.6 4.1 | 325 |
| 201.6 | 0.7830.008 | 0.6220.013 | 0.9830.005 | 1.0000 | 162.5 2.6 | 150 |
| 205.7 | 0.7750.006 | 0.6080.013 | 0.9760.003 | 0.99890.0004 | 620.7 7.0 | 575 |
| 206.3 | 0.7810.012 | 0.5890.015 | 0.9640.006 | 0.99890.0008 | 206.4 3.9 | 203 |
| total | 2761.215.2 | 2679 | ||||
| R | R | ||||
|---|---|---|---|---|---|
| 0.0350-0.0855 | 1.071 0.008 | ||||
| 0.0855-0.1360 | 1.066 0.008 | 0.05-0.10 | 1.070 0.008 | ||
| 0.1360-0.1865 | 1.065 0.008 | 0.10-0.15 | 1.066 0.008 | ||
| 0.1865-0.2370 | 1.070 0.008 | 0.15-0.20 | 1.066 0.008 | ||
| 0.2370-0.2875 | 1.068 0.007 | 0.20-0.25 | 1.070 0.008 | ||
| 0.2875-0.3380 | 1.056 0.007 | 0.25-0.30 | 1.065 0.008 | ||
| 0.3380-0.3885 | 1.057 0.007 | 0.30-0.35 | 1.057 0.007 | ||
| 0.3885-0.4390 | 1.048 0.007 | 0.35-0.40 | 1.055 0.007 | ||
| 0.4390-0.4895 | 1.054 0.006 | 0.40-0.45 | 1.050 0.007 | ||
| 0.4895-0.5400 | 1.059 0.006 | 0.45-0-50 | 1.055 0.006 | ||
| 0.5400-0.5905 | 1.042 0.006 | 0.50-0.55 | 1.056 0.006 | ||
| 0.5905-0.6410 | 1.050 0.005 | 0.55-0.60 | 1.044 0.007 | ||
| 0.6410-0.6860 | 1.031 0.005 | 0.60-0.65 | 1.047 0.005 | ||
| 0.6860-0.7310 | 1.049 0.005 | 0.65-0.70 | 1.036 0.005 | ||
| 0.8190-0.8625 | 1.037 0.004 | ||||
| 0.8625-0.9060 | 1.035 0.003 | 0.85-0.90 | 1.035 0.003 |
| Systematic uncertainties (%) | ||||||||||||||
| (GeV) | Bkg | Total | ||||||||||||
| 161.3 | 0.10 | 1.94 | 1.20 | 0.60 | 0.13 | 0.56 | 2.43 | |||||||
| 172.0 | 0.10 | 1.94 | 1.24 | 1.80 | 0.13 | 0.56 | 2.98 | |||||||
| 182.7 | 0.06 | 1.94 | 0.49 | 0.23 | 0.13 | 1.03 | 2.27 | |||||||
| 188.6 | 0.08 | 0.72 | 0.48 | 0.11 | 0.13 | 0.56 | 1.05 | |||||||
| 191.6 | 0.15 | 0.84 | 0.55 | 0.30 | 0.13 | 0.56 | 1.20 | |||||||
| 195.5 | 0.14 | 0.84 | 0.35 | 0.18 | 0.13 | 0.56 | 1.10 | |||||||
| 199.5 | 0.11 | 0.82 | 0.41 | 0.24 | 0.13 | 0.56 | 1.11 | |||||||
| 201.6 | 0.11 | 0.82 | 0.51 | 0.22 | 0.13 | 0.56 | 1.15 | |||||||
| 205.7 | 0.09 | 0.83 | 0.32 | 0.14 | 0.13 | 0.56 | 1.07 | |||||||
| 206.3 | 0.20 | 0.95 | 0.71 | 0.31 | 0.13 | 0.56 | 1.37 | |||||||
| 161.3 GeV | 172.0 GeV | 182.7 GeV | 188.6 GeV | 191.6 GeV | |
|---|---|---|---|---|---|
| 0.0350-0.0855 | 3/ 0.751 | 1/ 0.751 | 5/ 0.653 | 18/ 0.759 | 3/ 0.832 |
| 0.0855-0.1360 | 0/ 0.816 | 1/ 0.816 | 6/ 0.641 | 33/ 0.707 | 3/ 0.802 |
| 0.1360-0.1865 | 2/ 0.973 | 2/ 0.730 | 13/ 0.895 | 28/ 0.761 | 3/ 0.776 |
| 0.1865-0.2370 | 2/ 0.840 | 2/ 0.420 | 11/ 0.708 | 28/ 0.744 | 2/ 0.776 |
| 0.2370-0.2875 | 3/ 0.912 | 0/ 0.608 | 10/ 0.839 | 30/ 0.734 | 4/ 0.847 |
| 0.2875-0.3380 | 2/ 0.833 | 3/ 0.570 | 6/ 0.830 | 33/ 0.696 | 4/ 0.820 |
| 0.3380-0.3885 | 3/ 0.584 | 0/ 0.497 | 5/ 0.761 | 26/ 0.658 | 4/ 0.837 |
| 0.3885-0.4390 | 0/ 0.524 | 0/ 0.458 | 4/ 0.617 | 29/ 0.705 | 2/ 0.800 |
| 0.4390-0.4895 | 5/ 0.735 | 0/ 0.680 | 11/ 0.752 | 32/ 0.772 | 6/ 0.748 |
| 0.4895-0.5400 | 3/ 0.895 | 4/ 0.716 | 11/ 0.836 | 39/ 0.814 | 5/ 0.784 |
| 0.5400-0.5905 | 2/ 0.647 | 3/ 0.543 | 14/ 0.733 | 42/ 0.802 | 6/ 0.808 |
| 0.5905-0.6410 | 5/ 0.669 | 2/ 0.606 | 19/ 0.719 | 38/ 0.776 | 10/ 0.798 |
| 0.6410-0.6860 | 2/ 0.832 | 2/ 0.667 | 21/ 0.769 | 55/ 0.739 | 9/ 0.734 |
| 0.6860-0.7310 | 5/ 0.740 | 3/ 0.514 | 23/ 0.750 | 57/ 0.738 | 1/ 0.698 |
| 0.8190-0.8625 | 5/ 0.581 | 6/ 0.592 | 24/ 0.579 | 80/ 0.596 | 18/ 0.629 |
| 0.8625-0.9060 | 15/ 0.472 | 4/ 0.456 | 37/ 0.478 | 105/ 0.495 | 22/ 0.603 |
| 195.5 GeV | 199.5 GeV | 201.6 GeV | 205.7 GeV | 206.3 GeV | |
|---|---|---|---|---|---|
| 0.0350-0.0855 | 9/ 0.762 | 11/ 0.745 | 6/ 0.754 | 20/0.695 | 6/ 0.760 |
| 0.0855-0.1360 | 10/ 0.742 | 8/ 0.711 | 7/ 0.726 | 17/0.803 | 6/ 0.777 |
| 0.1360-0.1865 | 21/ 0.740 | 9/ 0.802 | 4/ 0.736 | 23/0.703 | 6/ 0.889 |
| 0.1865-0.2370 | 10/ 0.821 | 12/ 0.831 | 2/ 0.853 | 30/0.806 | 9/ 0.838 |
| 0.2370-0.2875 | 7/ 0.768 | 16/ 0.744 | 9/ 0.823 | 17/0.778 | 8/ 0.930 |
| 0.2875-0.3380 | 6/ 0.738 | 11/ 0.744 | 7/ 0.730 | 19/0.781 | 10/ 0.854 |
| 0.3380-0.3885 | 12/ 0.762 | 18/ 0.736 | 5/ 0.813 | 29/0.698 | 10/ 0.523 |
| 0.3885-0.4390 | 15/ 0.726 | 16/ 0.638 | 7/ 0.608 | 24/0.762 | 11/ 0.619 |
| 0.4390-0.4895 | 15/ 0.821 | 19/ 0.803 | 9/ 0.804 | 17/0.797 | 8/ 0.886 |
| 0.4895-0.5400 | 29/ 0.782 | 21/ 0.745 | 6/ 0.754 | 32/0.763 | 9/ 0.762 |
| 0.5400-0.5905 | 19/ 0.810 | 25/ 0.779 | 12/ 0.797 | 36/0.798 | 9/ 0.818 |
| 0.5905-0.6410 | 28/ 0.789 | 25/ 0.729 | 11/ 0.774 | 34/0.718 | 16/ 0.762 |
| 0.6410-0.6860 | 25/ 0.709 | 10/ 0.736 | 9/ 0.736 | 52/0.746 | 12/ 0.732 |
| 0.6860-0.7310 | 28/ 0.716 | 24/ 0.743 | 14/ 0.764 | 51/0.754 | 21/ 0.712 |
| 0.8190-0.8625 | 44/ 0.642 | 37/ 0.637 | 19/ 0.653 | 76/0.644 | 33/ 0.630 |
| 0.8625-0.9060 | 63/ 0.601 | 63/ 0.598 | 23/ 0.600 | 98/0.583 | 29/ 0.560 |
| 161.3 GeV | 172.0 GeV | 182.7 GeV | 188.6 GeV | 191.6 GeV | |
|---|---|---|---|---|---|
| 0.05-0.10 | 2/0.876 | 1/0.876 | 4/0.775 | 19/0.773 | 4/0.834 |
| 0.10-0.15 | 0/0.670 | 1/0.595 | 7/0.526 | 38/0.714 | 2/0.803 |
| 0.15-0.20 | 2/1.000 | 3/0.711 | 13/0.964 | 23/0.764 | 4/0.773 |
| 0.20-0.25 | 3/0.790 | 1/0.429 | 10/0.672 | 29/0.731 | 3/0.799 |
| 0.25-0.30 | 2/0.878 | 3/0.624 | 9/0.828 | 28/0.730 | 5/0.819 |
| 0.30-0.35 | 2/0.792 | 0/0.549 | 8/0.807 | 32/0.707 | 2/0.844 |
| 0.35-0.40 | 3/0.595 | 0/0.481 | 2/0.732 | 24/0.661 | 4/0.840 |
| 0.40-0.45 | 0/0.553 | 0/0.496 | 5/0.656 | 29/0.705 | 3/0.772 |
| 0.45-0-50 | 6/0.743 | 1/0.705 | 12/0.758 | 41/0.773 | 5/0.763 |
| 0.50-0.55 | 2/0.790 | 4/0.603 | 11/0.744 | 39/0.812 | 4/0.792 |
| 0.55-0.60 | 3/0.705 | 2/0.627 | 15/0.802 | 41/0.802 | 8/0.797 |
| 0.60-0.65 | 4/0.668 | 2/0.593 | 17/0.723 | 31/0.759 | 11/0.785 |
| 0.65-0.70 | 3/0.823 | 3/0.630 | 25/0.746 | 65/0.749 | 6/0.745 |
| 0.85-0.90 | 16/0.516 | 5/0.526 | 41/0.514 | 110/0.521 | 22/0.632 |
| 195.5 GeV | 199.5 GeV | 201.6 GeV | 205.7 GeV | 206.3 GeV | |
|---|---|---|---|---|---|
| 0.05-0.10 | 8/0.769 | 11/0.738 | 7/0.766 | 23/0.703 | 3/0.804 |
| 0.10-0.15 | 12/0.770 | 6/0.733 | 6/0.723 | 20/0.816 | 9/0.729 |
| 0.15-0.20 | 24/0.717 | 11/0.794 | 4/0.733 | 16/0.700 | 4/0.913 |
| 0.20-0.25 | 5/0.844 | 13/0.848 | 6/0.875 | 31/0.794 | 12/0.888 |
| 0.25-0.30 | 8/0.749 | 15/0.746 | 5/0.826 | 17/0.803 | 6/0.902 |
| 0.30-0.35 | 7/0.751 | 13/0.747 | 7/0.734 | 20/0.750 | 14/0.833 |
| 0.35-0.40 | 15/0.763 | 15/0.677 | 5/0.769 | 28/0.709 | 4/0.493 |
| 0.40-0.45 | 11/0.716 | 18/0.676 | 7/0.625 | 24/0.776 | 13/0.654 |
| 0.45-0-50 | 18/0.834 | 20/0.802 | 9/0.802 | 17/0.784 | 7/0.877 |
| 0.50-0.55 | 29/0.792 | 20/0.738 | 7/0.749 | 32/0.766 | 9/0.806 |
| 0.55-0.60 | 20/0.792 | 25/0.781 | 11/0.799 | 35/0.804 | 14/0.788 |
| 0.60-0.65 | 25/0.775 | 21/0.718 | 11/0.759 | 33/0.728 | 11/0.746 |
| 0.65-0.70 | 27/0.723 | 16/0.758 | 10/0.764 | 66/0.755 | 16/0.746 |
| 0.85-0.90 | 76/0.645 | 67/0.651 | 32/0.667 | 122/0.657 | 32/0.628 |
| (pb/str) | (pb/str) | ||
|---|---|---|---|
| 0.0350-0.0855 | 0.50 0.05 0.02 | 0.55 | |
| 0.0855-0.1360 | 0.56 0.06 0.02 | 0.56 | |
| 0.1360-0.1865 | 0.69 0.06 0.02 | 0.57 | |
| 0.1865-0.2370 | 0.63 0.06 0.03 | 0.59 | |
| 0.2370-0.2875 | 0.60 0.06 0.02 | 0.62 | |
| 0.2875-0.3380 | 0.62 0.06 0.02 | 0.66 | |
| 0.3380-0.3885 | 0.74 0.07 0.02 | 0.71 | |
| 0.3885-0.4390 | 0.72 0.07 0.02 | 0.77 | |
| 0.4390-0.4895 | 0.70 0.06 0.02 | 0.84 | |
| 0.4895-0.5400 | 0.92 0.07 0.02 | 0.93 | |
| 0.5400-0.5905 | 1.01 0.08 0.02 | 1.05 | |
| 0.5905-0.6410 | 1.15 0.08 0.02 | 1.21 | |
| 0.6410-0.6860 | 1.39 0.10 0.03 | 1.40 | |
| 0.6860-0.7310 | 1.59 0.11 0.03 | 1.64 | |
| 0.8190-0.8625 | 2.95 0.16 0.05 | 3.18 | |
| 0.8625-0.9060 | 4.50 0.21 0.08 | 4.48 | |
| (GeV) | (pb) | (pb) | ||||
|---|---|---|---|---|---|---|
| 161.3 | 10.71 1.42 0.26 | 8.57 | 1.0 | |||
| 172.0 | 6.53 1.14 0.19 | 7.53 | 0.7 | |||
| 182.7 | 6.72 0.45 0.15 | 6.68 | 1.2 | |||
| 188.6 | 6.57 0.25 0.07 | 6.26 | 0.9 | |||
| 191.6 | 5.73 0.57 0.07 | 6.07 | 2.3 | |||
| 195.5 | 6.34 0.34 0.07 | 5.83 | 1.6 | |||
| 199.5 | 5.64 0.31 0.06 | 5.60 | 2.3 | |||
| 201.6 | 5.25 0.43 0.06 | 5.48 | 0.9 | |||
| 205.7 | 5.11 0.21 0.05 | 5.27 | 1.3 | |||
| 206.3 | 5.43 0.38 0.07 | 5.24 | 1.0 | |||
| 195.6 | 5.66 0.11 0.03 | 5.83 | 1.3 | |||
| Fit | 95% C.L. | |||
|---|---|---|---|---|
| parameter | limits | |||
| QED cutoff | TeV-4 | 379 GeV | ||
| 300 GeV | ||||
| Contact interactions | TeV-4 | 1537 GeV | ||
| TeV-6 | 790 GeV | |||
| TeV-8 | 21 GeV | |||
| exchange | (TeV/c2)-4 | 295 GeV/c2 | ||
| Graviton exchange | (TeV/c2)-4 | 771 GeV/c2 | ||
| 985 GeV/c2 |