DE-AC02-76SF00515 DE-FG02-91ER-40622 SLAC-PUB-10756 DPF 2003: Annual Meeting of the Division of Particles and Fields of the American Physical Society 5-8 April 2003, Philadelphia, Pennsylvania Study of Decays into the Final State at
Abstract
Based on a data sample of an integrated luminosity of 57.4 fb-1 at the resonance taken with the BABAR detector using the SLAC PEP-II asymmetric-energy -Factory, hadronic decays of meson with the final states and three pions are studied. The study is performed by fully reconstructing the exclusive decays of and the non-resonant modes and . The current status of the study is presented and a dominant decay is shown.
I Introduction
Hadronic decays provide important information on both the weak and
hadronic interactions of heavy flavored mesons. The quarks produced in such
nonleptonic weak decays can arrange themselves into hadrons in many ways.
The final state is linked to the initial state by QCD processes.
The theoretical description of hadronic decays of heavy mesons invoke the
factorization approximation and heavy quark effective theory (HQET) [1].
The dominant hadronic decay modes of the meson involve tree-level
diagrams where the transition leads to a charmed meson and an
external boson, which often emerges as a charged meson , or
. In the models based on the Bauer-Stech-Wirbel
approach [1,2], two parameters and , which describe the QCD
hard-gluon corrections for external and internal spectator processes
respectively, provide important clues into the role played by the strong
interaction in these two-body tree-level decays. Parameters and
are expected to be process dependent, but previous experimental data
can be described with universal values ( and
). Recent results of from CLEO and Belle (both indicate to be
) begin
to show the expected process dependence of [3,4]. A precise
measurement of decaying to provides an interesting
approach to estimate the constants and and to test the
factorization
hypothesis. Since the QCD interaction between the product quarks
continues after the weak transition takes place and after hadron formation,
an understanding of final state interactions (FSI) is very important.
The study of the non-resonant modes
and may provide
important information on this mechanism.
Hadronic decays also play a significant role in CP violation study.
A precise measurement of is important in
measuring , where and are the
angles of the Unitary Triangle related to the asymmetries in decay
[5]. Presently is also suggested as
a test of chirality [6].
Studies of and of their non-resonant decays were
previously performed by CLEO and ARGUS [7,8,9,10]. Because of limited
statistics, the uncertainties of the branching fraction measurements
are relatively large [11], and some of the detailed substructure of the
resonance is not available. BABAR has collected a large data sample of
pairs at the PEP-II -Factory [12], making possible an improved
study of these modes.
In this paper we present the status of our study. The BABAR detector and data are described in Section II, and the event selection with data analysis is presented in Section III. A summary is given in Section IV. Charge conjugation is always implied in this report.
II THE BABAR DETECTOR AND DATA SET
The data used in this analysis consists of 62.2 million pairs, corresponding to an integrated luminosity of 57.4 fb-1, collected with the BABAR detector at the resonance. The BABAR detector [13] was constructed to observe CP violation and was motivated by the measurements of mixing made almost two decades ago [14]. Charged particles are reconstructed with a five layer, double-sided silicon vertex tracker (SVT) [15] and a 40 layer drift chamber (DCH) with a helium-based gas mixture [16], placed in a 1.5 T solenoidal field produced by a superconducting magnet. The charged particle momentum resolution is approximately , where is given in GeV/. The SVT, with a typical single-hit resolution of 10 m, provides measurement of impact parameters of charged particle tracks in both the plane transverse to the beam direction and along the beam. Charged particle types are identified from the ionization energy loss (d/d) measured in the DCH and SVT, and the Cherenkov device (DIRC) [17]. Photons are identified by a CsI(Tl) electromagnetic calorimeter (EMC) with an energy resolution GeV) [18].
III EVENT SELECTION AND DATA ANALYSIS
mesons are reconstructed in modes of decaying to and three
pions, which may form the resonance and non-resonant
and . They contain
, ,
, , and their
corresponding non-resonant modes and .
To reconstruct the charmed mesons and and the light mesons in the
final states, the charged tracks are required to have a distance of closest
approach within cm in and 1.5 cm in radius of the average beam
spot position, and at least 12 hits recorded in the DCH. Kaons and pions are
selected, depending on their track’s momentum, based on the d/d
information from the SVT and DCH, as well as the Cherenkov angle and the
number of photons measured with the DIRC. For each detector component
= (SVT, DCH, DIRC), a likelihood () is
calculated given the kaon (pion) mass hypothesis. Photons are selected as
showers in the calorimeter that have a lateral shower shape consistent with
the expected pattern of energy deposits for an electromagnetic shower and
with an energy MeV.
The meson is selected from the decays ,
and , while the
meson is selected from and
modes. The track momentum is required to be greater
than 200 MeV/c. s are reconstructed from two photons with the sum
of their energies greater than 200 MeV/c and an invariant
mass 0.120 GeV/c2 0.150 GeV/c2 (about
times the resolution of the invariant mass). A mass
constraint fit is applied to candidates, which improves the energy
resolution from 2.4% to 1.8%. mesons are reconstructed from
two pion tracks with opposite charge. The invariant mass of the candidate
is required to be MeV/c2
MeV/c2 and the momentum of the greater than 200
MeV. In selection
the angle between the flight direction, which is the vector which points from
the primary vertex to the candidate’s vertex, and the
direction of the candidate’s three momentum is used as a cut.
A vertex fit is applied, and a probability of greater than
0.1% is required.
The invariant mass of the candidate of ,
, and ,
is required to be within from the true value
of the mass. As the combinatorial background of the
is larger due to the presence of the
, a mass cut is applied on this mode. The tracks of the
meson are required to originate from the same point; therefore a vertex
fit is applied with the requirement of a probability of greater
than 0.1%. Then a combined vertex and mass constraint fit is applied and a
convergent fit is required. The mass-constraint fit changes the momenta
of the meson daughters forcing the invariant mass to be the nominal one,
thus improving the energy and momentum resolutions.
Reconstructed s are combined with soft pions ()
to form () candidates. The soft pion momentum is required to
be less than 450 MeV/c. The requirements of
MeV for and the minimum momentum requirement of 200 MeV/c for the
pion are removed for soft pions. candidates are selected by the
requirement that the mass difference between and ,
, lies within ( is
the resolution of ) of the nominal mass difference. Then
candidates are refitted with the beam-spot
constraint to improve the angular resolution for the soft pion,
and a convergent combined vertex and mass constraint fit is also applied.
For , no vertex fit is applied, but a kinematic and
mass constraint fit are applied and required to be convergent.
mesons are reconstructed from pairs
with the requirement of pion momenta greater than 200 MeV/c and the invariant
mass satisfying
GeV/c2 GeV/c2.
mesons are reconstructed by combining the selected
and a pion with the pion momentum greater than 200 MeV/c and the
invariant mass to be between 1.0 GeV/c2 and 1.6
GeV/c2. A vertex fit is applied to the candidates of and
, and a probability greater than 0.1% is
required.
The and mesons are reconstructed by combining selected
or with candidates, or .
The variables and are used to define the signal.
is the energy difference between
the energy of the candidate and the beam energy in the
system, i.e., is the center of mass energy of the candidate
and is the center of mass beam energy. The signal is
expected to peak at . The beam energy substituted mass of
candidate,
, is defined as where is the center of mass
momentum of
the -th daughter of the candidate. The resolution in this variable
is limited by the beam energy spread, which is about 2.7 MeV for BABAR.
Since the final states involve many tracks and more than one candidate can be
found in the event, the combinatorial background is high. To suppress such
background, we chose for each mode the
candidates whose daughter or masses are most consistent with
their nominal given masses. Then among them the candidate with smallest
is selected. This selection will remove most of the
combinatorial background and keep the best candidates.
One major source of background comes from the continuum background. The continuum background is due to the large non-resonant fraction of the hadronic cross-section, approximately 75% at the , from direct . To select events from data and reduce the continuum background, the ratio of second to zeroth Fox-Wolfram moment, , is used [19]. In the rest frame of , approaches zero for spherical events and one for jet-like events (Fig. 1). is required in event selection since the momenta of ’s are very small and events are spherical, whereas continuum events are jet-like in the frame of .
|
|
|
![[Uncaptioned image]](/html/hep-ex/0409055/assets/x1.png)
![[Uncaptioned image]](/html/hep-ex/0409055/assets/x2.png)
The thrust angle , which is the angle between the thrust
axis of the candidate and the thrust axis of the remaining tracks in
the event, is also used to suppress the continuum background. Monte Carlo
simulation shows that the distribution of the thrust angle for
continuum background events and of events are quite different
(Fig. 2). The distribution of is flat for
events and peaks at 1.0 for continuum events.
We require for the ,
and modes with
for all other modes.
A Resonant mode
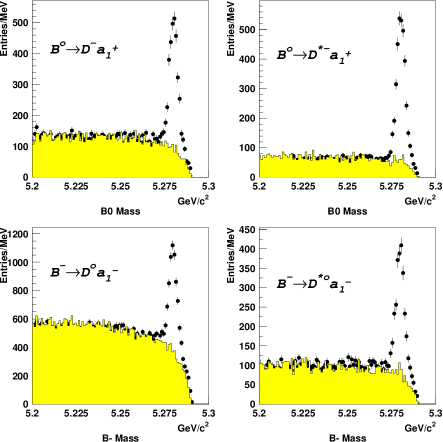
In this decay mesons are selected in the modes , , and . The meson is a very broad ( MeV) isovector () state with orbital excitation and . Fig. 3 shows the Monte Carlo simulated spectra of mass and momenta in the decay of . are reconstructed from a combination of selected and a charged pion, with the pion momentum greater than 200 MeV/c and the invariant mass between 1.0 GeV/c2 and 1.6 GeV/c2 consistent with the mass. An additional cut on the center of mass momentum of the candidate is applied with GeV/c. A vertex fit is performed and a probability greater than 0.1% is required. All selected and candidates from decays or decays are required to have a momentum in the frame greater than 1.3 GeV/c. The distributions for with GeV/c2 are shown in Fig. 4, while the distributions with are shown in Fig. 5 and Fig. 6.

The background can be separated into continuum and components. The background component is the result of mis-reconstructing other decays. The relative contributions and the overall amount of background varies decay-mode by decay-mode depending primarily on the multiplicity of the decay. We use generic Monte Carlo data with the signal modes and non-resonant modes and removed, and continuum Monte Carlo data to model the background and find that the background shape of data can be well characterized by Monte Carlo (Fig. 7). The Monte Carlo backgrounds are fitted to an Argus function [20] and the obtained shape parameters of such functions are used in the fitting of of data as shown in Fig. 5 and Fig. 6.

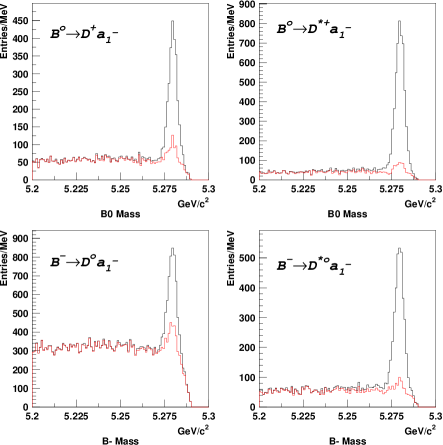
In the signal region of , some events of the non-resonant decays of and can pass the event selection criteria of and form a peaking background. This is confirmed by Monte Carlo data. Fig. 8 shows that peaking background of all the non-resonant modes underlays the Monte Carlo signal of . The estimation of contributions from non-resonant modes to modes will be given in the next subsection. It is also possible that the decay of may pollute the signal of by misreconstructing from one direct and the slow from , where the mass of lies in the region. Monte Carlo study shows that compared with the decays and , its contribution is quite small and can be neglected. Another possible source of background is from the decay and , where or decays to [21]. Monte Carlo study also shows that their contributions are quite small and can be neglected.


The event selection efficiencies for each submode have been studied using signal Monte Carlo data and are reported in Table 1. Estimates of the statistical and systematic error of branching fraction measurements are also listed in the table. The systematic error is mainly considered from the following sources (1) the branching fraction errors of intermediate decays, (2) the error of the integrated luminosity (about 1.1%), (3) the error on the acceptance efficiency due to Monte Carlo statistics, and (4) the error on the charged track reconstruction efficiency, which is 1.2% per charged track. An additional error of 1.6% is added in quadrature to account for the uncertainty in the soft pion reconstruction efficiency.
| mode | mode | (stat.) | (syst.) | |
|---|---|---|---|---|
| 9.9% | ||||
| 3.4% | 3.4% | 8.6% | ||
| 4.9% | ||||
| 8.3% | 3.0% | 9.5% | ||
| 8.0% | ||||
| 5.9% | ||||
| 2.0% | 4.5% | 11.5% | ||
| 2.7% | ||||
| 8.8% | ||||
| 4.8% | 3.5% | 9.8% | ||
| 5.3% |
B Non-resonant modes and
For the decays of and , the invariant masses of and are required to be less than 4.0 GeV/c2 and center of mass momenta of and greater than 0.5 GeV/c. The distributions for are shown in Fig. 9.

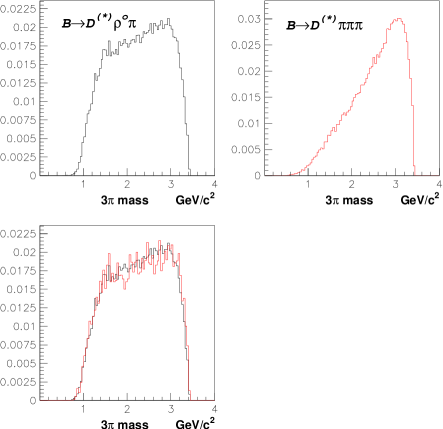
The signal region of , which is GeV/c2 and (see Fig. 9) also contains and candidates. Monte Carlo study shows that the invariant mass spectra for and are different. But when the cuts GeV/c2 GeV/c2 and center of mass momentum of greater than 0.5 GeV/c are applied to both modes, the mass spectra for and are almost the same, as shown in Fig. 10. So, we can use the spectra of to represent the spectra of . Monte Carlo also shows that the spectra of modes , , and are quite similar because they have similar topology and kinematics (see Fig. 11).

The invariant mass distributions of in the signal
region are shown in Fig. 12. The shaded areas in the figures are the
distributions from sideband region
(5.22 GeV/c 5.26 GeV/c2), and were scaled with the
ratio of the integral of the Argus function in the sideband region
to the integral in the signal region.
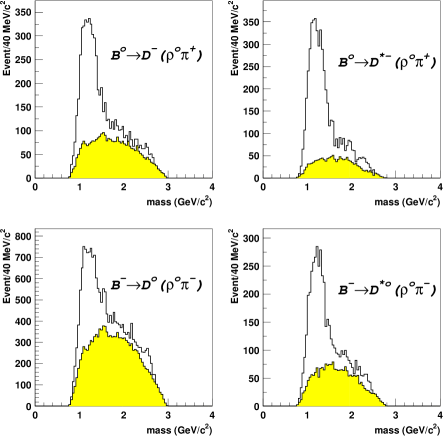
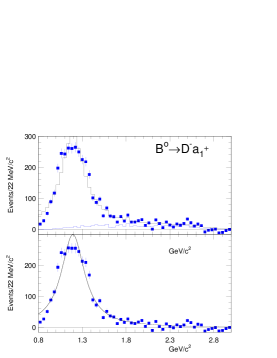
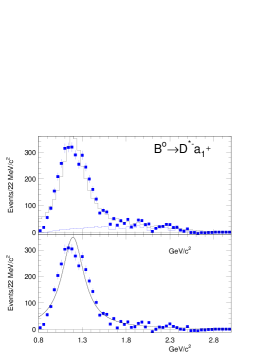
To estimate the fraction of in the mass distribution, the mass distribution, with the sideband background subtracted, are fitted to a Breit-Wigner distribution as signal plus the distribution of non-resonant mass. The fits of modes are shown in Fig. 13. The non-resonant mass distribution are from the reconstruction of the mass in signal Monte Carlo data. It is found that the signal is dominant in the mass spectra of in both and decay; therefore, the decay of is dominant in decay with final state . To separate the non-resonant mode and , a Dalitz plot analysis will be important.
IV SUMMARY
The hadronic decay of and non-resonant modes , are studied with a large data sample. The preliminary result shows that is dominant in decays with the final state . The errors on the branching fraction measurements are estimated and improved compared with previous measurements. Further study is ongoing and final results will be published soon.
V ACKNOWLEDGMENTS
We are grateful for the excellent luminosity and machine conditions provided by our PEP-II colleagues. The collaborating institutions wish to thank SLAC for its support and kind hospitality. This work is supported by DOE and NSF (USA), NSERC (Canada), IHEP (China), CEA and CNRS-IN2P3 (France), BMBF and DFG (Germany), INFN (Italy), FOM (The Netherlands), NFR (Norway), MIST (Russia), and PPARC (United Kingdom). Individuals have received support from the A. P. Sloan Foundation, Research Corporation, and Alexander von Humboldt Foundation.
REFERENCES
- [1] M. Bauer, B. Stech, and M. Wirbel, Z. Phys. C 29, 637 (1985).
- [2] M. Neubert and B. Stech, hep-ph/9705292.
- [3] CLEO Collaboration, T. Coan et al., Phys. Rev. Lett. 88, 062001 (2002).
- [4] Belle Collaboration, K. Abe et al., Phys. Rev. Lett. 88, 052002 (2002).
- [5] P. F. Harrison and H. R. Quinn (ed.), The BABAR Physics Book, Chap. 6,7 (1998).
- [6] M. Gronau, Pramana 62, 255 (2004).
- [7] CLEO Collaboration, D. Bortoletto et al., Phys. Rev. Lett 69, 2046 (1992).
- [8] ARGUS Collaboration, Z. Phys. C 48 543 (1990).
- [9] CLEO Collaboration, M. S. Alam et al., Phys. Rev. D 50, 43 (1994).
- [10] CLEO Collaboration, “Exclusive Reconstruction of Decays,” CLEO CONF 97-01, EPS 97-339.
- [11] Review of Particle Physics, K. Hagiwara et al., Phys. Rev. D 66, 010001 (2002).
- [12] P. Oddone, Annals N. Y. Acad. Sci. 578, 237 (1989); PEP-II Conceptual Design Report, SLAC-R-418 (1993).
- [13] BABAR Collaboration, B. Aubert et al., Nucl. Instrum. Meth. A 479, 1 (2002).
- [14] UA1 Collaboration, C. Albajar et al., Phys. Lett. B 186, 247 (1987); ARGUS Collaboration, H. Albrecht et al., Phys. Lett, B 192, 245 (1987).
- [15] BABAR Collaboration, P. Burchat, Nucl. Instrum. Meth. A 342, 292 (1994); BABAR Collaboration, V. Re et al., IEEE Trans. Nucl. Sci 49, 3284 (2002).
- [16] BABAR Collaboration, P. Burchat, J. Hiser, A. Boyarski, and D. Briggs, Nucl. Instrum. Meth. A 316, 217 (1992); BABAR Collaboration, G. Sciolla et al., Nucl. Instrum. Meth. A 419, 310 (1998).
- [17] BABAR Collaboration, J. Schwiening et al., Nucl. Instrum. Meth. A 502, 67 (2003).
- [18] BABAR Collaboration, R. J. Barlow et al., Nucl. Instrum. Meth. A 420, 162 (1999).
- [19] G. C. Fox and S. Wolfram, Phys. Rev. Lett. 41, 1581 (1978).
- [20] ARGUS Collaboration, H. Albrecht et al., Phys. Lett. B 185, 218 (1987).
- [21] E691 Collaboration, J. C. Anjos et al., Phys. Rev. Lett. 62, 1717 (1989).