Study of
Abstract
New data are presented on from a sample of 58M events in the upgraded BES II detector at the BEPC. There is a conspicuous signal for and a peak at higher mass which may be fitted with . From a combined analysis with data, the branching ratio is at the confidence level.
PACS: 13.25.Gv, 14.40.Gx, 13.40.Hq
M. Ablikim1, J. Z. Bai1, Y. Ban10,
J. G. Bian1, D. V. Bugg19, X. Cai1, J. F. Chang1,
H. F. Chen16, H. S. Chen1, H. X. Chen1,
J. C. Chen1, Jin Chen1, Jun Chen6,
M. L. Chen1, Y. B. Chen1, S. P. Chi2,
Y. P. Chu1, X. Z. Cui1, H. L. Dai1,
Y. S. Dai18, Z. Y. Deng1, L. Y. Dong1,
S. X. Du1, Z. Z. Du1, J. Fang1,
S. S. Fang2, C. D. Fu1, H. Y. Fu1,
C. S. Gao1, Y. N. Gao14, M. Y. Gong1,
W. X. Gong1, S. D. Gu1, Y. N. Guo1,
Y. Q. Guo1, Z. J. Guo15, F. A. Harris15,
K. L. He1, M. He11, X. He1,
Y. K. Heng1, H. M. Hu1, T. Hu1,
G. S. Huang1† , L. Huang6, X. P. Huang1,
X. B. Ji1, Q. Y. Jia10, C. H. Jiang1,
X. S. Jiang1, D. P. Jin1, S. Jin1,
Y. Jin1, Y. F. Lai1, F. Li1,
G. Li1, H. H. Li1, J. Li1,
J. C. Li1, Q. J. Li1, R. B. Li1,
R. Y. Li1, S. M. Li1, W. G. Li1,
X. L. Li7, X. Q. Li9, X. S. Li14,
Y. F. Liang13, H. B. Liao5, C. X. Liu1,
F. Liu5, Fang Liu16, H. M. Liu1,
J. B. Liu1, J. P. Liu17, R. G. Liu1,
Z. A. Liu1, Z. X. Liu1, F. Lu1,
G. R. Lu4, J. G. Lu1, C. L. Luo8,
X. L. Luo1, F. C. Ma7, J. M. Ma1,
L. L. Ma11, Q. M. Ma1, X. Y. Ma1,
Z. P. Mao1, X. H. Mo1, J. Nie1,
Z. D. Nie1, S. L. Olsen15, H. P. Peng16,
N. D. Qi1, C. D. Qian12, H. Qin8, T. N. Ruan16
J. F. Qiu1, Z. Y. Ren1, G. Rong1,
L. Y. Shan1, L. Shang1, D. L. Shen1,
X. Y. Shen1, H. Y. Sheng1, F. Shi1,
X. Shi10, H. S. Sun1, S. S. Sun16,
Y. Z. Sun1, Z. J. Sun1, X. Tang1,
N. Tao16, Y. R. Tian14, G. L. Tong1,
G. S. Varner15, D. Y. Wang1, J. Z. Wang1,
K. Wang16, L. Wang1, L. S. Wang1,
M. Wang1, P. Wang1, P. L. Wang1,
S. Z. Wang1, W. F. Wang1, Y. F. Wang1,
Zhe Wang1, Z. Wang1, Zheng Wang1,
Z. Y. Wang1, C. L. Wei1, D. H. Wei3,
N. Wu1, Y. M. Wu1, X. M. Xia1,
X. X. Xie1, B. Xin7, G. F. Xu1,
H. Xu1, Y. Xu1, S. T. Xue1,
M. L. Yan16, F. Yang9, H. X. Yang1,
J. Yang16, S. D. Yang1, Y. X. Yang3,
M. Ye1, M. H. Ye2, Y. X. Ye16,
L. H. Yi6, Z. Y. Yi1, C. S. Yu1,
G. W. Yu1, C. Z. Yuan1, J. M. Yuan1,
Y. Yuan1, Q. Yue1, S. L. Zang1,
Yu. Zeng1,Y. Zeng6, B. X. Zhang1,
B. Y. Zhang1, C. C. Zhang1, D. H. Zhang1,
H. Y. Zhang1, J. Zhang1, J. Y. Zhang1,
J. W. Zhang1, L. S. Zhang1, Q. J. Zhang1,
S. Q. Zhang1, X. M. Zhang1, X. Y. Zhang11,
Y. J. Zhang10, Y. Y. Zhang1, Yiyun Zhang13,
Z. P. Zhang16, Z. Q. Zhang4, D. X. Zhao1,
J. B. Zhao1, J. W. Zhao1, M. G. Zhao9,
P. P. Zhao1, W. R. Zhao1, X. J. Zhao1,
Y. B. Zhao1, Z. G. Zhao1∗, H. Q. Zheng10,
J. P. Zheng1, L. S. Zheng1, Z. P. Zheng1,
X. C. Zhong1, B. Q. Zhou1, G. M. Zhou1,
L. Zhou1, N. F. Zhou1, K. J. Zhu1,
Q. M. Zhu1, Y. C. Zhu1, Y. S. Zhu1,
Yingchun Zhu1, Z. A. Zhu1, B. A. Zhuang1,
B. S. Zou1.
(BES Collaboration)
1 Institute of High Energy Physics, Beijing 100039, People’s Republic of China
2 China Center for Advanced Science and Technology(CCAST), Beijing 100080,
People’s Republic of China
3 Guangxi Normal University, Guilin 541004, People’s Republic of China
4 Henan Normal University, Xinxiang 453002, People’s Republic of China
5 Huazhong Normal University, Wuhan 430079, People’s Republic of China
6 Hunan University, Changsha 410082, People’s Republic of China
7 Liaoning University, Shenyang 110036, People’s Republic of China
8 Nanjing Normal University, Nanjing 210097, People’s Republic of China
9 Nankai University, Tianjin 300071, People’s Republic of China
10 Peking University, Beijing 100871, People’s Republic of China
11 Shandong University, Jinan 250100, People’s Republic of China
12 Shanghai Jiaotong University, Shanghai 200030, People’s Republic of China
13 Sichuan University, Chengdu 610064, People’s Republic of China
14 Tsinghua University, Beijing 100084, People’s Republic of China
15 University of Hawaii, Honolulu, Hawaii 96822, USA
16 University of Science and Technology of China, Hefei 230026, People’s Republic of China
17 Wuhan University, Wuhan 430072, People’s Republic of China
18 Zhejiang University, Hangzhou 310028, People’s Republic of China
19 Queen Mary, University of London, London E1 4NS, UK
∗ Current address: University of Michigan, Ann Arbor,
Michigan, 48109, USA
† Current address: Purdue University, West Lafayette, Indiana 47907, USA.
In a recent publication, we have presented new data on [1] from a sample of 58M events taken in the Beijing Spectrometer (BES) detector at the Beijing Electron Positron Collider. Here we report data on . Earlier data on this channel with lower statistics have been published by Mark I [2], DM2 [3] and Mark III [4].
The BES II detector is a large solid-angle magnetic spectrometer that is described in detail in Ref. [5]. Charged particles are measured in a vertex chamber and Main Drift Chamber (MDC); these are surrounded by a solenoidal magnet providing a nearly uniform field of 0.4T. Photons are detected in a Barrel Shower Counter (BSC) made of gas proportional tubes interleaved with 12 radiation lengths of lead sheets. A time-of-flight (TOF) hodoscope immediately outside the MDC provides separation between pions, kaons, and protons. The time resolution of the TOF measurement is 180 ps. Further separation is obtained using in the MDC.
The point of closest approach of a charged track to the beam is required to be within 2 cm of the beam axis and within 20 cm of the centre of the interaction region along the beam axis. Both photons are required to be isolated from charged tracks by demanding an angle to the nearest charged track. Any photon with an energy deposit MeV in the shower counter is rejected. All particles are required to lie well within the acceptance of the detector, with charged tracks having laboratory polar angles satisfying and with transverse momenta MeV/c.
The is observed decaying to , so events are selected initially by demanding two photons and four charged tracks with total charge zero. If there are more than two photons, all are tried; an extra photon can arise from interactions of charged particles in the detector. Kaons can be identified up to momenta of 800 MeV/c by TOF and measurements. The two slowest particles always have energies MeV. The first step is to identify one kaon and one pion using TOF and . The other two tracks often have momenta too high to be identified by TOF and , so a four-constraint kinematic fit is made for the hypothesis. The kinematic fit requires .
The is selected by requiring GeV/c2; the mass resolution is MeV/c2. The resulting mass distribution is shown in Fig. 1. The signal is then selected requiring MeV/c2. The background is fitted by a second order polynomial in . A background of % is estimated from sidebands, defined by MeV/c2; the error allows for small variations when the location and width of the sidebins are changed.
For a given momentum, the mass of the accompanying pair is unique. The decay angles of and in the lab frame are very different except near 0 or . There, the backward or differ strongly in momentum and are easily distinguished by momentum, TOF, and . As a result, there is a clean separation between and .
Most background originates from . The other sources of background are in final states and . Most events are rejected as follows. If or , events are discarded if any combination has in the interval MeV/ and mm; here is the distance from the beam axis to the vertex. This avoids rejecting too many signal events; surviving background is too small to be visible. The beam spot has a of 0.6 mm, and the resolution of the second vertex is 1.2 mm in . After the background subtraction, there are 3438 signal events. From the Monte Carlo simulation, the average detection efficiency is 4.0%.
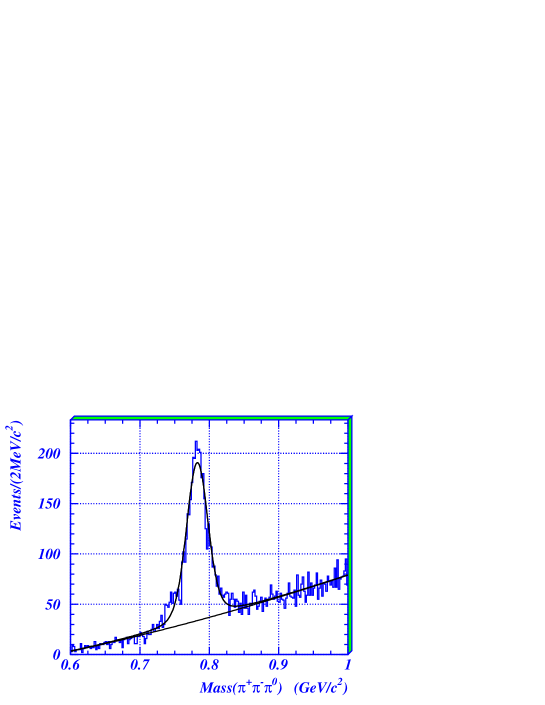
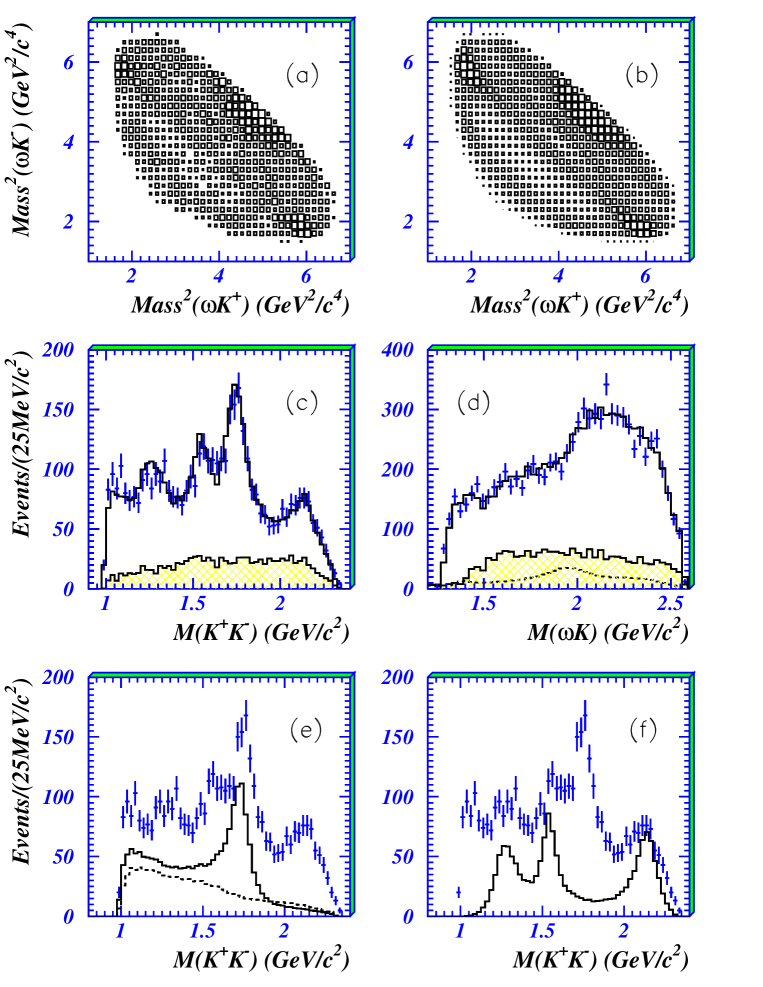
Fig. 2(a) shows the experimental Dalitz plot, and Figs. 2(c) and (d) show projections on to masses of and ; the shaded area indicates background events from the sideband estimation.
The channels fitted to the data are:
Amplitudes are fitted to relativistic tensor expressions documented in Ref. [6]. For spin 0 in , two transitions from are allowed with orbital angular momenta and 2 in the production process. For spin 2, there are five amplitudes: one with , three with and one with . In fitting these, Blatt-Weisskopf centrifugal barrier factors are included with a radius of 0.8 fm, though results are insensitive to this choice. In the amplitude analysis, information from the decay is included in the tensor expressions.
The polarisation vector of the lies along the normal to its decay plane. The correlation between this polarisation vector, the production plane, and the decay of the to is sensitive to the spin of and also to the helicity amplitudes for its production. This correlation cannot readily be displayed, since it depends on five angles; however, tests with different demonstrate the sensitivity to quantum numbers.
Fig. 2(b) shows the Dalitz plot from the log likelihood fit described below. Histograms on Figs. 2(e) and (f) show projections of and contributions to this fit.
The data of Ref. [1] determine all helicity amplitudes for production of well. In fitting present data, the relative magnitudes of these amplitudes are fixed to values from . Contributions from are likewise fixed from the signal observed in ; its branching ratio is taken from the Flatté formula fitted to and [7], where there are conspicuous signals. Phases for and amplitudes are fitted freely, since they arise from multiple scattering, which is different in and final states.
For other components, there is a general problem in isolating from possible for two reasons. Firstly, five amplitudes can simulate two amplitudes closely; amplitudes with may be identified if they give rise to decay angular distributions which are non-isotropic. Secondly, fitted amplitudes can fluctuate for angles outside the acceptance. For high mass above 2 GeV, this latter problem is somewhat reduced, because the amplitude is suppressed by the strong centrifugal barrier for production.
We use to denote a broad S-wave contribution. We find that it peaks towards the lower masses as shown by the dashed curve of Fig. 2(e). However, the dependence on mass above 1 GeV is somewhat uncertain. Many alternative fits have been tried with similar results. A component peaking towards threshold is required; without it, the fit to the mass distribution of Fig. 2(c) is bad. We have therefore tried parametrisations using the pole of Ref. [1], and a coupling constant of the form or . The optimum fit requires a slightly more rapid fall with than the pole, in order to fit four points at the lowest masses. However, we regard this as unphysical and therefore eventually choose to use the pole of Ref. [1] unchanged, with . Note that there is a substantial constructive interference in present data between and amplitudes at masses close to threshold.
A dominant feature is ; the present data are consistent with earlier studies which identify [8,9]. They are also consistent with the absence of any significant contribution. The fitted optimises at MeV, MeV. The error in the mass is mostly systematic, and arises from uncertainty in the amplitude with which interferes; the error in is mostly statistical, but includes allowance for interference with the remaining amplitude. Earlier BES II data on and gave MeV and MeV [8].
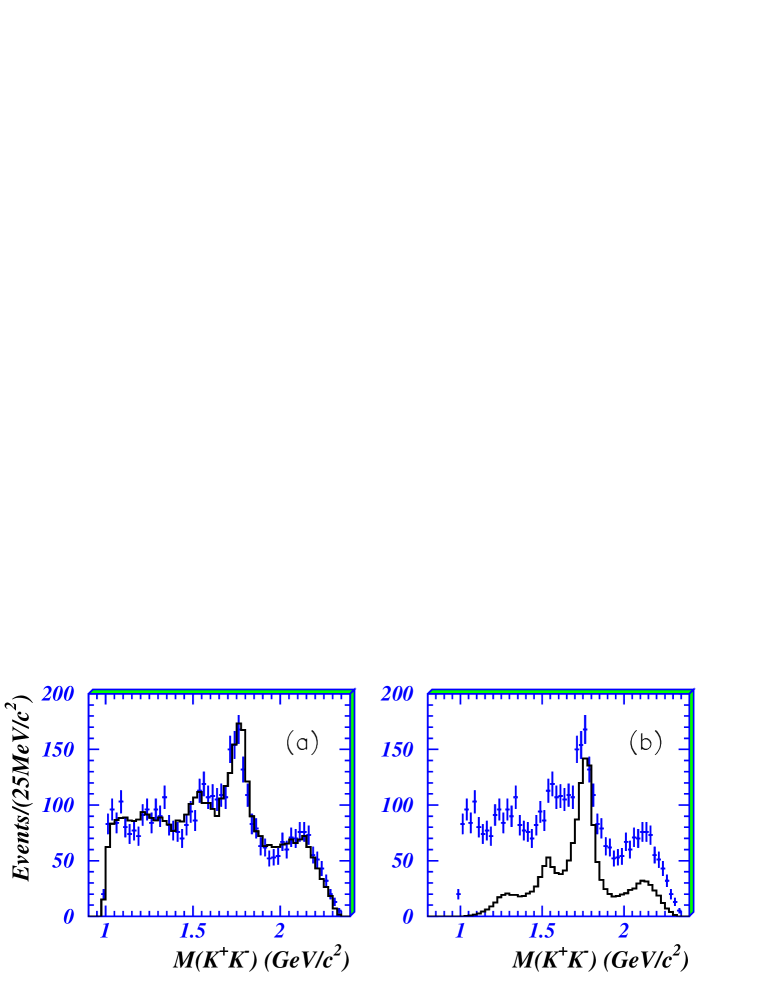
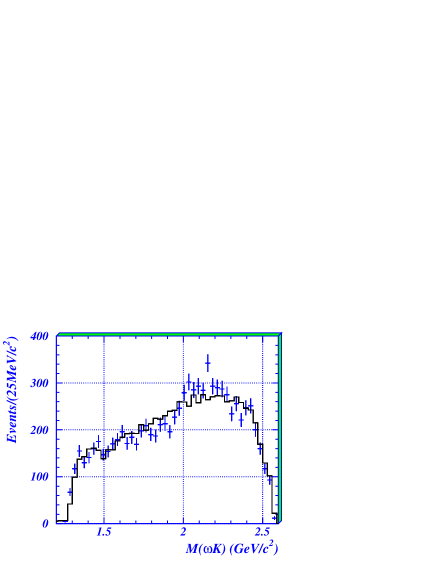
A fit to the 1738 MeV/c2 peak with spin 2 uses five amplitudes and gives log likelihood worse than spin 0 by only 15; the fit is shown in Fig. 3. However, the fit with spin 0 uses only two production amplitudes with and 2. The fit with spin 0 requires an amplitude which is completely dominant over . However, for spin 2 the amplitudes dominate over . The phase space available in the process is rather limited, and the and 4 centrifugal barriers for the production process should suppress those amplitudes strongly. If the and 4 amplitudes are removed, spin 0 gives a fit better than spin 2 by 90 in log likelihood.
This pattern of behaviour is symptomatic of what is required for spin 2 to simulate spin 0. The spin 2 amplitude with has a unique dependence on angles; it contains a distinctive term , where is the decay angle of the in the resonance rest frame, with respect to the direction of the recoil . Simulation of spin 0 requires large and 4 amplitudes to produce compensating terms in . Although this is suspicious, the possibility cannot be ruled out from present data.
We discuss next the branching ratio of between and , using information from [1], where statistics of events are available. In those data, there is no definite evidence for the presence of ; if its mass is scanned, there is no optimum around 1710 MeV/c2, and the fitted is only % of . In the data presented here, the intensity is of the data within the same acceptance as for ; the error is almost entirely systematic, and covers all alternative parametrisations of the amplitude and removing the . The branching fraction for , is . We find at the 95% confidence level
| (1) |
where all charge states for decay are taken into account.
One caveat is necessary. In our study of and [7], definite evidence is found for an , distinct from and decaying to (and possibly weakly to ). There is a remote possibility that and are both present in data but cancel by destructive interference. Such a cancellation would require that they have the same magnitudes but opposite phases. Even then, the cancellation is incomplete, because they have different masses and widths. Allowing for this possible cancellation, the upper limit of the branching ratio given in eqn. (1) could increase to 0.16 if the magnitudes happen to be equal, which is unlikely.
The peak in Fig. 2(c) at MeV may be fitted with either or , or both. Spin 2 is required by non-isotropic decay angular distributions; a fit with an with the same mass and width gives a worse log likelihood by 64. Also no is visible in the data of Ref. [1]. If the peak is fitted with , the branching fraction is close to that for . However, because of interferences between helicity amplitudes, the branching fraction could be a factor 2 larger or smaller. If the peak is fitted with , the branching fraction is similar to that of in data, but again could be a factor 2 larger or smaller. The fit shown in Fig. 2 uses . The branching ratio of between and is , consistent with the range of values quoted by the Particle Data Group [9]; again the error arises from flexibility in interferences between helicity amplitudes.
There is a further feature at MeV/c2 in the mass spectrum. Some spin component is required by non-isotropic decay angular distributions. An optimum fit to present data may be achieved with a mass of MeV and a width MeV; these values are within a few MeV/c2 of PDG values. Errors are mostly statistical but also cover changes when the small amplitudes are omitted from the fit. The data do not rule out the possibility of spin 4, but the fit is consistent with the known [9].
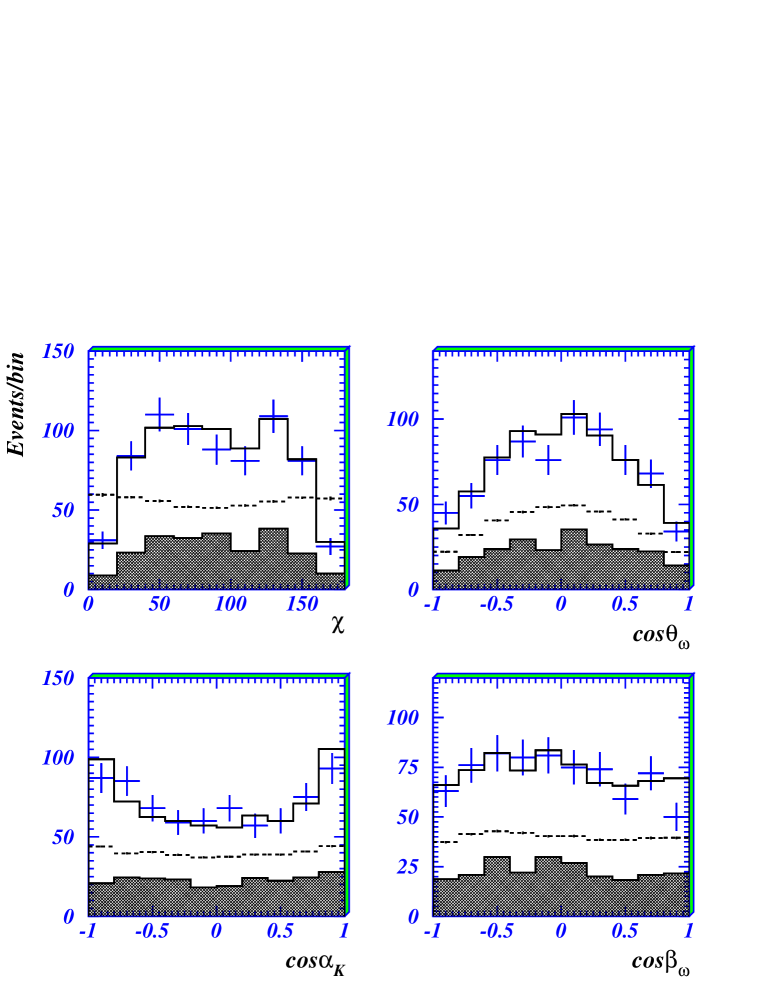
Fig. 4 shows distributions for four angles after selecting MeV. The angle is the angle between the decay plane of and the decay plane ; is the production angle of the in the rest frame. The angle is the decay angle of the in the rest frame of , taken with respect to the direction of the recoil ; is the angle between the normal to the decay plane and the beam direction. The distribution for is distinctly non-isotropic, although after integrating over all but one of the angles, much of the spin information is lost; the full amplitude analysis is much more reliable than projections on to individual angles. The dashed curves illustrate the acceptance. The shaded histograms at the bottom of each panel show background, which is taken from sidebins.
A marginal improvement of 21 in log likelihood may be obtained by adding . However, this is not sufficient to be sure of its presence, so it is omitted.
The mass distribution is fitted poorly unless a component decaying to is included with MeV, MeV. Fig. 5 shows the poor fit without this additional amplitude; no background appears capable of explaining this effect. The optimum fit is obtained with orbital angular momentum in the system, i.e. ; this improves log likelihood by 113, and contributes 9.4% of all events. The observed isotropic decay can be fitted not only by , but through conspiracy between several production amplitudes for and . The known with and with [9] do not alone give an adequate fit but may make some contribution. Our conclusion is that some contribution is needed in this mass range, but cannot be identified cleanly and could be a superposition of more than one resonance with , and . Conclusions about and components are insensitive to this ambiguity. At lower masses, inclusion of also gives a significant improvement of 81 in log likelihood.
In summary, the main features of the data are peaks which may be attributed to , , and either or . An upper limit of 0.11 is set on the ratio . This upper limit could rise to 0.16 if there is a fortuitous cancellation of and in data in both magnitude and phase.
The BES collaboration thanks the staff of BEPC for their hard efforts. This work is supported in part by the National Natural Science Foundation of China under contracts Nos. 19991480,10225524,10225525, the Chinese Academy of Sciences under contract No. KJ 95T-03, the 100 Talents Program of CAS under Contract Nos. U-11, U-24, U-25, and the Knowledge Innovation Project of CAS under Contract Nos. U-602, U-34(IHEP); by the National Natural Science Foundation of China under Contract No.10175060(USTC), No.10225522 (Tsinghua University); and the U.S. Department of Energy under Contract No.DE-FG03-94ER40833 (U Hawaii). We wish to acknowledge financial support from the Royal Society for collaboration between the BES group and Queen Mary, London.
References
- [1] J.Z. Bai et al., (BES Collaboration), The Pole in , Phys. Lett. B (to be published) and hep-ex/0406038.
- [2] G.J. Feldman et al., Phys. Rev. Lett. 33C, 285 (1977).
- [3] A. Falvard et et al., Phys. Rev. D38, 2706 (1988).
- [4] L. Köpke and N. Wermes, Phys. Rep. 174, 67 (1989).
- [5] J.Z. Bai et al., (BES Collaboration), Nucl. Instr. Meth. A458, 627 (2001).
- [6] B.S. Zou and D.V. Bugg, Euro. Phys. J A16, 537 (2003).
- [7] J.Z. Bai et al., (BES Collaboration), Study of and , to be submitted to Phys. Lett. B.
- [8] J.Z. Bai et al., (BES Collaboration), Phys. Rev. D68, 052003 (2003).
- [9] S. Eidelman et al., (Particle Data Group), Phys. Lett. B592, 1 (2004).