on leave from ]Nova Gorica Polytechnic, Nova Gorica The Belle Collaboration
Improved Measurements of Color-Suppressed Decays
, and
K. Abe
High Energy Accelerator Research Organization (KEK), Tsukuba
K. Abe
Tohoku Gakuin University, Tagajo
N. Abe
Tokyo Institute of Technology, Tokyo
I. Adachi
High Energy Accelerator Research Organization (KEK), Tsukuba
H. Aihara
Department of Physics, University of Tokyo, Tokyo
M. Akatsu
Nagoya University, Nagoya
Y. Asano
University of Tsukuba, Tsukuba
T. Aso
Toyama National College of Maritime Technology, Toyama
V. Aulchenko
Budker Institute of Nuclear Physics, Novosibirsk
T. Aushev
Institute for Theoretical and Experimental Physics, Moscow
T. Aziz
Tata Institute of Fundamental Research, Bombay
S. Bahinipati
University of Cincinnati, Cincinnati, Ohio 45221
A. M. Bakich
University of Sydney, Sydney NSW
Y. Ban
Peking University, Beijing
M. Barbero
University of Hawaii, Honolulu, Hawaii 96822
A. Bay
Swiss Federal Institute of Technology of Lausanne, EPFL, Lausanne
I. Bedny
Budker Institute of Nuclear Physics, Novosibirsk
U. Bitenc
J. Stefan Institute, Ljubljana
I. Bizjak
J. Stefan Institute, Ljubljana
S. Blyth
Department of Physics, National Taiwan University, Taipei
A. Bondar
Budker Institute of Nuclear Physics, Novosibirsk
A. Bozek
H. Niewodniczanski Institute of Nuclear Physics, Krakow
M. Bračko
University of Maribor, Maribor
J. Stefan Institute, Ljubljana
J. Brodzicka
H. Niewodniczanski Institute of Nuclear Physics, Krakow
T. E. Browder
University of Hawaii, Honolulu, Hawaii 96822
M.-C. Chang
Department of Physics, National Taiwan University, Taipei
P. Chang
Department of Physics, National Taiwan University, Taipei
Y. Chao
Department of Physics, National Taiwan University, Taipei
A. Chen
National Central University, Chung-li
K.-F. Chen
Department of Physics, National Taiwan University, Taipei
W. T. Chen
National Central University, Chung-li
B. G. Cheon
Chonnam National University, Kwangju
R. Chistov
Institute for Theoretical and Experimental Physics, Moscow
S.-K. Choi
Gyeongsang National University, Chinju
Y. Choi
Sungkyunkwan University, Suwon
Y. K. Choi
Sungkyunkwan University, Suwon
A. Chuvikov
Princeton University, Princeton, New Jersey 08545
S. Cole
University of Sydney, Sydney NSW
M. Danilov
Institute for Theoretical and Experimental Physics, Moscow
M. Dash
Virginia Polytechnic Institute and State University, Blacksburg, Virginia 24061
L. Y. Dong
Institute of High Energy Physics, Chinese Academy of Sciences, Beijing
R. Dowd
University of Melbourne, Victoria
J. Dragic
University of Melbourne, Victoria
A. Drutskoy
University of Cincinnati, Cincinnati, Ohio 45221
S. Eidelman
Budker Institute of Nuclear Physics, Novosibirsk
Y. Enari
Nagoya University, Nagoya
D. Epifanov
Budker Institute of Nuclear Physics, Novosibirsk
C. W. Everton
University of Melbourne, Victoria
F. Fang
University of Hawaii, Honolulu, Hawaii 96822
S. Fratina
J. Stefan Institute, Ljubljana
H. Fujii
High Energy Accelerator Research Organization (KEK), Tsukuba
N. Gabyshev
Budker Institute of Nuclear Physics, Novosibirsk
A. Garmash
Princeton University, Princeton, New Jersey 08545
T. Gershon
High Energy Accelerator Research Organization (KEK), Tsukuba
A. Go
National Central University, Chung-li
G. Gokhroo
Tata Institute of Fundamental Research, Bombay
B. Golob
University of Ljubljana, Ljubljana
J. Stefan Institute, Ljubljana
M. Grosse Perdekamp
RIKEN BNL Research Center, Upton, New York 11973
H. Guler
University of Hawaii, Honolulu, Hawaii 96822
J. Haba
High Energy Accelerator Research Organization (KEK), Tsukuba
F. Handa
Tohoku University, Sendai
K. Hara
High Energy Accelerator Research Organization (KEK), Tsukuba
T. Hara
Osaka University, Osaka
N. C. Hastings
High Energy Accelerator Research Organization (KEK), Tsukuba
K. Hasuko
RIKEN BNL Research Center, Upton, New York 11973
K. Hayasaka
Nagoya University, Nagoya
H. Hayashii
Nara Women’s University, Nara
M. Hazumi
High Energy Accelerator Research Organization (KEK), Tsukuba
E. M. Heenan
University of Melbourne, Victoria
I. Higuchi
Tohoku University, Sendai
T. Higuchi
High Energy Accelerator Research Organization (KEK), Tsukuba
L. Hinz
Swiss Federal Institute of Technology of Lausanne, EPFL, Lausanne
T. Hojo
Osaka University, Osaka
T. Hokuue
Nagoya University, Nagoya
Y. Hoshi
Tohoku Gakuin University, Tagajo
K. Hoshina
Tokyo University of Agriculture and Technology, Tokyo
S. Hou
National Central University, Chung-li
W.-S. Hou
Department of Physics, National Taiwan University, Taipei
Y. B. Hsiung
Department of Physics, National Taiwan University, Taipei
H.-C. Huang
Department of Physics, National Taiwan University, Taipei
T. Igaki
Nagoya University, Nagoya
Y. Igarashi
High Energy Accelerator Research Organization (KEK), Tsukuba
T. Iijima
Nagoya University, Nagoya
A. Imoto
Nara Women’s University, Nara
K. Inami
Nagoya University, Nagoya
A. Ishikawa
High Energy Accelerator Research Organization (KEK), Tsukuba
H. Ishino
Tokyo Institute of Technology, Tokyo
K. Itoh
Department of Physics, University of Tokyo, Tokyo
R. Itoh
High Energy Accelerator Research Organization (KEK), Tsukuba
M. Iwamoto
Chiba University, Chiba
M. Iwasaki
Department of Physics, University of Tokyo, Tokyo
Y. Iwasaki
High Energy Accelerator Research Organization (KEK), Tsukuba
R. Kagan
Institute for Theoretical and Experimental Physics, Moscow
H. Kakuno
Department of Physics, University of Tokyo, Tokyo
J. H. Kang
Yonsei University, Seoul
J. S. Kang
Korea University, Seoul
P. Kapusta
H. Niewodniczanski Institute of Nuclear Physics, Krakow
S. U. Kataoka
Nara Women’s University, Nara
N. Katayama
High Energy Accelerator Research Organization (KEK), Tsukuba
H. Kawai
Chiba University, Chiba
H. Kawai
Department of Physics, University of Tokyo, Tokyo
Y. Kawakami
Nagoya University, Nagoya
N. Kawamura
Aomori University, Aomori
T. Kawasaki
Niigata University, Niigata
N. Kent
University of Hawaii, Honolulu, Hawaii 96822
H. R. Khan
Tokyo Institute of Technology, Tokyo
A. Kibayashi
Tokyo Institute of Technology, Tokyo
H. Kichimi
High Energy Accelerator Research Organization (KEK), Tsukuba
H. J. Kim
Kyungpook National University, Taegu
H. O. Kim
Sungkyunkwan University, Suwon
Hyunwoo Kim
Korea University, Seoul
J. H. Kim
Sungkyunkwan University, Suwon
S. K. Kim
Seoul National University, Seoul
T. H. Kim
Yonsei University, Seoul
K. Kinoshita
University of Cincinnati, Cincinnati, Ohio 45221
P. Koppenburg
High Energy Accelerator Research Organization (KEK), Tsukuba
S. Korpar
University of Maribor, Maribor
J. Stefan Institute, Ljubljana
P. Križan
University of Ljubljana, Ljubljana
J. Stefan Institute, Ljubljana
P. Krokovny
Budker Institute of Nuclear Physics, Novosibirsk
R. Kulasiri
University of Cincinnati, Cincinnati, Ohio 45221
C. C. Kuo
National Central University, Chung-li
H. Kurashiro
Tokyo Institute of Technology, Tokyo
E. Kurihara
Chiba University, Chiba
A. Kusaka
Department of Physics, University of Tokyo, Tokyo
A. Kuzmin
Budker Institute of Nuclear Physics, Novosibirsk
Y.-J. Kwon
Yonsei University, Seoul
J. S. Lange
University of Frankfurt, Frankfurt
G. Leder
Institute of High Energy Physics, Vienna
S. E. Lee
Seoul National University, Seoul
S. H. Lee
Seoul National University, Seoul
Y.-J. Lee
Department of Physics, National Taiwan University, Taipei
T. Lesiak
H. Niewodniczanski Institute of Nuclear Physics, Krakow
J. Li
University of Science and Technology of China, Hefei
A. Limosani
University of Melbourne, Victoria
S.-W. Lin
Department of Physics, National Taiwan University, Taipei
D. Liventsev
Institute for Theoretical and Experimental Physics, Moscow
J. MacNaughton
Institute of High Energy Physics, Vienna
G. Majumder
Tata Institute of Fundamental Research, Bombay
F. Mandl
Institute of High Energy Physics, Vienna
D. Marlow
Princeton University, Princeton, New Jersey 08545
T. Matsuishi
Nagoya University, Nagoya
H. Matsumoto
Niigata University, Niigata
S. Matsumoto
Chuo University, Tokyo
T. Matsumoto
Tokyo Metropolitan University, Tokyo
A. Matyja
H. Niewodniczanski Institute of Nuclear Physics, Krakow
Y. Mikami
Tohoku University, Sendai
W. Mitaroff
Institute of High Energy Physics, Vienna
K. Miyabayashi
Nara Women’s University, Nara
Y. Miyabayashi
Nagoya University, Nagoya
H. Miyake
Osaka University, Osaka
H. Miyata
Niigata University, Niigata
R. Mizuk
Institute for Theoretical and Experimental Physics, Moscow
D. Mohapatra
Virginia Polytechnic Institute and State University, Blacksburg, Virginia 24061
G. R. Moloney
University of Melbourne, Victoria
G. F. Moorhead
University of Melbourne, Victoria
T. Mori
Tokyo Institute of Technology, Tokyo
A. Murakami
Saga University, Saga
T. Nagamine
Tohoku University, Sendai
Y. Nagasaka
Hiroshima Institute of Technology, Hiroshima
T. Nakadaira
Department of Physics, University of Tokyo, Tokyo
I. Nakamura
High Energy Accelerator Research Organization (KEK), Tsukuba
E. Nakano
Osaka City University, Osaka
M. Nakao
High Energy Accelerator Research Organization (KEK), Tsukuba
H. Nakazawa
High Energy Accelerator Research Organization (KEK), Tsukuba
Z. Natkaniec
H. Niewodniczanski Institute of Nuclear Physics, Krakow
K. Neichi
Tohoku Gakuin University, Tagajo
S. Nishida
High Energy Accelerator Research Organization (KEK), Tsukuba
O. Nitoh
Tokyo University of Agriculture and Technology, Tokyo
S. Noguchi
Nara Women’s University, Nara
T. Nozaki
High Energy Accelerator Research Organization (KEK), Tsukuba
A. Ogawa
RIKEN BNL Research Center, Upton, New York 11973
S. Ogawa
Toho University, Funabashi
T. Ohshima
Nagoya University, Nagoya
T. Okabe
Nagoya University, Nagoya
S. Okuno
Kanagawa University, Yokohama
S. L. Olsen
University of Hawaii, Honolulu, Hawaii 96822
Y. Onuki
Niigata University, Niigata
W. Ostrowicz
H. Niewodniczanski Institute of Nuclear Physics, Krakow
H. Ozaki
High Energy Accelerator Research Organization (KEK), Tsukuba
P. Pakhlov
Institute for Theoretical and Experimental Physics, Moscow
H. Palka
H. Niewodniczanski Institute of Nuclear Physics, Krakow
C. W. Park
Sungkyunkwan University, Suwon
H. Park
Kyungpook National University, Taegu
K. S. Park
Sungkyunkwan University, Suwon
N. Parslow
University of Sydney, Sydney NSW
L. S. Peak
University of Sydney, Sydney NSW
M. Pernicka
Institute of High Energy Physics, Vienna
J.-P. Perroud
Swiss Federal Institute of Technology of Lausanne, EPFL, Lausanne
M. Peters
University of Hawaii, Honolulu, Hawaii 96822
L. E. Piilonen
Virginia Polytechnic Institute and State University, Blacksburg, Virginia 24061
A. Poluektov
Budker Institute of Nuclear Physics, Novosibirsk
F. J. Ronga
High Energy Accelerator Research Organization (KEK), Tsukuba
N. Root
Budker Institute of Nuclear Physics, Novosibirsk
M. Rozanska
H. Niewodniczanski Institute of Nuclear Physics, Krakow
H. Sagawa
High Energy Accelerator Research Organization (KEK), Tsukuba
M. Saigo
Tohoku University, Sendai
S. Saitoh
High Energy Accelerator Research Organization (KEK), Tsukuba
Y. Sakai
High Energy Accelerator Research Organization (KEK), Tsukuba
H. Sakamoto
Kyoto University, Kyoto
T. R. Sarangi
High Energy Accelerator Research Organization (KEK), Tsukuba
M. Satapathy
Utkal University, Bhubaneswer
N. Sato
Nagoya University, Nagoya
O. Schneider
Swiss Federal Institute of Technology of Lausanne, EPFL, Lausanne
J. Schümann
Department of Physics, National Taiwan University, Taipei
C. Schwanda
Institute of High Energy Physics, Vienna
A. J. Schwartz
University of Cincinnati, Cincinnati, Ohio 45221
T. Seki
Tokyo Metropolitan University, Tokyo
S. Semenov
Institute for Theoretical and Experimental Physics, Moscow
K. Senyo
Nagoya University, Nagoya
Y. Settai
Chuo University, Tokyo
R. Seuster
University of Hawaii, Honolulu, Hawaii 96822
M. E. Sevior
University of Melbourne, Victoria
T. Shibata
Niigata University, Niigata
H. Shibuya
Toho University, Funabashi
B. Shwartz
Budker Institute of Nuclear Physics, Novosibirsk
V. Sidorov
Budker Institute of Nuclear Physics, Novosibirsk
V. Siegle
RIKEN BNL Research Center, Upton, New York 11973
J. B. Singh
Panjab University, Chandigarh
A. Somov
University of Cincinnati, Cincinnati, Ohio 45221
N. Soni
Panjab University, Chandigarh
R. Stamen
High Energy Accelerator Research Organization (KEK), Tsukuba
S. Stanič
[
University of Tsukuba, Tsukuba
M. Starič
J. Stefan Institute, Ljubljana
A. Sugi
Nagoya University, Nagoya
A. Sugiyama
Saga University, Saga
K. Sumisawa
Osaka University, Osaka
T. Sumiyoshi
Tokyo Metropolitan University, Tokyo
S. Suzuki
Saga University, Saga
S. Y. Suzuki
High Energy Accelerator Research Organization (KEK), Tsukuba
O. Tajima
High Energy Accelerator Research Organization (KEK), Tsukuba
F. Takasaki
High Energy Accelerator Research Organization (KEK), Tsukuba
K. Tamai
High Energy Accelerator Research Organization (KEK), Tsukuba
N. Tamura
Niigata University, Niigata
K. Tanabe
Department of Physics, University of Tokyo, Tokyo
M. Tanaka
High Energy Accelerator Research Organization (KEK), Tsukuba
G. N. Taylor
University of Melbourne, Victoria
Y. Teramoto
Osaka City University, Osaka
X. C. Tian
Peking University, Beijing
S. Tokuda
Nagoya University, Nagoya
S. N. Tovey
University of Melbourne, Victoria
K. Trabelsi
University of Hawaii, Honolulu, Hawaii 96822
T. Tsuboyama
High Energy Accelerator Research Organization (KEK), Tsukuba
T. Tsukamoto
High Energy Accelerator Research Organization (KEK), Tsukuba
K. Uchida
University of Hawaii, Honolulu, Hawaii 96822
S. Uehara
High Energy Accelerator Research Organization (KEK), Tsukuba
T. Uglov
Institute for Theoretical and Experimental Physics, Moscow
K. Ueno
Department of Physics, National Taiwan University, Taipei
Y. Unno
Chiba University, Chiba
S. Uno
High Energy Accelerator Research Organization (KEK), Tsukuba
Y. Ushiroda
High Energy Accelerator Research Organization (KEK), Tsukuba
G. Varner
University of Hawaii, Honolulu, Hawaii 96822
K. E. Varvell
University of Sydney, Sydney NSW
S. Villa
Swiss Federal Institute of Technology of Lausanne, EPFL, Lausanne
C. C. Wang
Department of Physics, National Taiwan University, Taipei
C. H. Wang
National United University, Miao Li
J. G. Wang
Virginia Polytechnic Institute and State University, Blacksburg, Virginia 24061
M.-Z. Wang
Department of Physics, National Taiwan University, Taipei
M. Watanabe
Niigata University, Niigata
Y. Watanabe
Tokyo Institute of Technology, Tokyo
L. Widhalm
Institute of High Energy Physics, Vienna
Q. L. Xie
Institute of High Energy Physics, Chinese Academy of Sciences, Beijing
B. D. Yabsley
Virginia Polytechnic Institute and State University, Blacksburg, Virginia 24061
A. Yamaguchi
Tohoku University, Sendai
H. Yamamoto
Tohoku University, Sendai
S. Yamamoto
Tokyo Metropolitan University, Tokyo
T. Yamanaka
Osaka University, Osaka
Y. Yamashita
Nihon Dental College, Niigata
M. Yamauchi
High Energy Accelerator Research Organization (KEK), Tsukuba
Heyoung Yang
Seoul National University, Seoul
P. Yeh
Department of Physics, National Taiwan University, Taipei
J. Ying
Peking University, Beijing
K. Yoshida
Nagoya University, Nagoya
Y. Yuan
Institute of High Energy Physics, Chinese Academy of Sciences, Beijing
Y. Yusa
Tohoku University, Sendai
H. Yuta
Aomori University, Aomori
S. L. Zang
Institute of High Energy Physics, Chinese Academy of Sciences, Beijing
C. C. Zhang
Institute of High Energy Physics, Chinese Academy of Sciences, Beijing
J. Zhang
High Energy Accelerator Research Organization (KEK), Tsukuba
L. M. Zhang
University of Science and Technology of China, Hefei
Z. P. Zhang
University of Science and Technology of China, Hefei
V. Zhilich
Budker Institute of Nuclear Physics, Novosibirsk
T. Ziegler
Princeton University, Princeton, New Jersey 08545
D. Žontar
University of Ljubljana, Ljubljana
J. Stefan Institute, Ljubljana
D. Zürcher
Swiss Federal Institute of Technology of Lausanne, EPFL, Lausanne
Abstract
We present preliminary improved measurements of the branching fractions of the color-suppressed
decays
where
represents the three light neutral mesons , and .
The measurements are based on a data sample of 140 collected at the
with the Belle detector at
the KEKB energy-asymmetric collider, corresponding to seven times
the luminosity of the previous Belle measurements.
††preprint: BELLE-CONF-0416ICHEP04 11-0661
I Introduction
The weak decays CC , where represents a light neutral
meson, are expected to proceed predominantly through internal spectator diagrams, as illustrated
in Fig. 1.
The color matching requirement between the quarks from the virtual and the
other quark pair results in these decays being “color-suppressed” relative to decays
such as , which proceed through external spectator diagrams.
Previous measurements of
decays into , , , and by the Belle collaboration ref:Belle ; ref:Belle2 ,
and of into by the CLEO collaboration ref:CLEO ,
and of decays into , , ,
by the BaBar collaboration ref:Babar indicate color suppressed branching
fractions in the approximate range –.
This is substantially in excess of theoretical expectations from “naive”
factorization models ref:Beneke ; ref:NeuSte ; ref:NeuPet ; ref:Chua ; ref:Rosner ; ref:Deandrea ; ref:ChRos in the range –.
Several approaches to achieving a better theoretical description ref:NeuPet ; ref:Chua ; ref:SCET ; ref:pQCD have been developed.
They extend upon the factorization approach with consideration of
final state interactions and consequent simultaneous treatment of isospin amplitudes of color-suppressed and color-allowed decays.
The possibility that similar effects could have dramatic implications
on the measurement potential of direct violation asymmetries in charmless decays, together with some degree of
discrepancy between the prior Belle ref:Belle and BaBar ref:Babar measurements provide strong
motivation for more precise measurements of the color-suppressed decays.
Figure 1: Tree level internal (left) and external (right) spectator
diagrams for decays.
In this paper we report improved branching fraction measurements
of decays into ,
, . The measurements are
based on a data sample, which contains 152 million pairs,
collected with the Belle detector at the KEKB asymmetric-energy
(3.5 on 8 GeV) collider KEKB
operating at the resonance. This corresponds to seven times the luminosity
of the previous Belle measurements ref:Belle and almost twice that of the
earlier BaBar measurements ref:Babar .
The Belle detector is a large-solid-angle magnetic
spectrometer that consists of a three-layer silicon vertex detector (SVD),
a 50-layer central drift chamber (CDC), an array of
aerogel threshold Čerenkov counters (ACC),
a barrel-like arrangement of time-of-flight
scintillation counters (TOF), and an electromagnetic calorimeter
comprised of CsI(Tl) crystals (ECL) located inside
a super-conducting solenoid coil that provides a 1.5 T
magnetic field. An iron flux-return located outside of
the coil is instrumented to detect mesons and to identify
muons (KLM). The detector
is described in detail elsewhere Belle .
II Event Selection
Color-suppressed meson decays are reconstructed
from candidate mesons that are combined with
light neutral meson candidates . The mesons are reconstructed
in three decay modes: , , and while the light neutral mesons are
reconstructed in the decay modes: , ,
and . The invariant masses at each stage of the decay chains are required to
be consistent within mass resolution or natural width windows around the
nominal masses of the assumed particle types.
Vertex and mass constrained fits are performed for decays with charged products such as
the three decays and ; mass constrained fits are performed on
the and candidates; and vertex constrained fits are performed on candidates due to the large natural width of the meson. These
kinematic fits result in improved energy and momenta of the candidate mesons.
Charged tracks are required to have impact parameters within of the interaction
point along the positron beam axis and within in the transverse plane. Each track is identified
as a kaon or pion according to a likelihood ratio derived from the responses of the TOF and ACC
systems and energy loss measurements from the CDC. The likelihood ratio is required to exceed
0.6 for kaon candidates. This requirement is efficient for kaons with a misidentification
rate for pions of .
The photon pairs that constitute candidates are required to have energies greater than
50 MeV and an invariant mass within a () mass window around the
nominal mass.
Candidate mesons that decay to are required to have photon energies greater than
. In addition the energy asymmetry
,
is required to be less than 0.9. The candidates are required to have invariant masses
within mass windows of the nominal mass, where for
the mode and for the mode.
If the photons that comprise the candidate are found to contribute to
any the candidate is excluded.
The decay products
of the and candidates
are required to have CM momentum greater than and , respectively.
The candidates are required to have invariant masses within of the nominal mass value,
where is the natural width of .
Invariant masses of the candidates are required to be within of the nominal
mass where is and for the , , and modes respectively.
The CM momentum of the in the mode is required to be greater than .
III reconstruction
The candidates are reconstructed from combinations of and using the
improved energy and momenta resulting from the vertex and mass constrained fits.
Two kinematic variables are used to distinguish signal candidates from backgrounds: the
beam-energy constrained mass
and energy difference
where is the CM energy, and
, are the CM energy and momenta, respectively, which are summed over
the and meson decay candidates.
The resolution of is approximately for all modes, dominated by the
beam energy spread, whereas the resolution varies substantially among modes
depending particularly on the number of in the final state.
Candidates within the broad region and
are selected for further consideration. Where more than one candidate is found in a single
event the one with the smaller is chosen, where and
the number of degrees of freedom are obtained from the
the kinematic fits to the and .
A common signal region of is used for all final states. The signal
region definitions in are mode dependent with for
and modes , and for and modes.
The event yields and efficiencies presented in the following sections correspond to these signal regions.
IV Continuum Suppression
At energies close to the resonance the
production cross section of is approximately three times that of production,
making continuum background suppression essential in all modes.
The jet-like nature of the continuum events allows
event shape variables to discriminate between them and the more spherical events.
The discrimination power of seven event shape variables is combined into a single Fisher discriminant fw whose variables
include the angle between the thrust axis
of the candidate and the thrust axis of the rest of the event
(), the sphericity variable, and five modified Fox-Wolfram moments fw .
Monte Carlo event samples of continuum events and signal events for each of the
final states considered are used to construct probability density functions (PDFs) for the
Fisher discriminant fw and , where is the angle between
the flight direction and the beam direction in the rest frame.
The products of the PDFs for these two variables give signal and
continuum likelihoods and for each
candidate, allowing a selection to be applied to the likelihood ratio
.
Monte Carlo studies of the signal significance , where and are signal and
background yields (using signal branching fractions from previous measurements), as a function of a cut on the
likelihood ratio indicate a rather smooth behavior. Although the optimum significance is generally in the
range 0.6-0.7, a looser cut of is applied for all modes in order to reduce systematic uncertainties.
For the mode the polarized nature of the allows additional discrimination against
backgrounds to be achieved with an additional requirement of , where the
helicity angle is defined as the
angle between the flight direction in the rest frame and the vector perpendicular to the
decay plane in the rest frame.
V Backgrounds from other decays
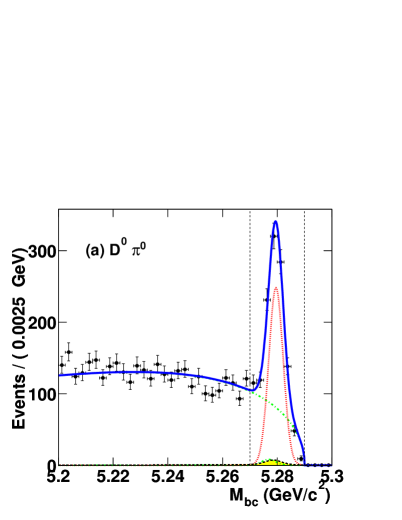
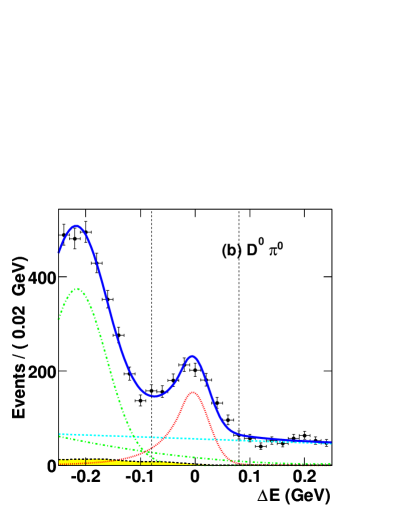
Figure 2:
Distributions of (a) and (b) for . Points with error bars
represent the data,
the solid line shows the result of the fit and the dotted line represents the signal contribution.
The crossfeed contributions are represented by the shaded areas.
The vertical dashed lines represent the signal regions.
For (a) the dashed-dotted line shows the continuum-like background contribution, with peaking background contributions represented
by the small dashed line.
For (b) the dashed line shows the continuum background contribution, the
dashed-dotted lines show the background components contribution.
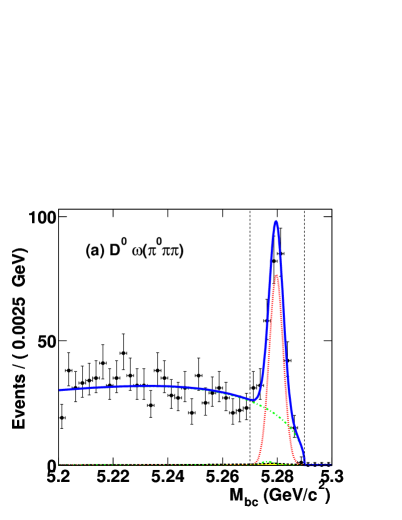
Figure 3:
Distributions of (a) and (b) for . Points with error bars
represent the data,
the solid line shows the result of the fit and the dotted line represents the signal contribution.
The crossfeed contributions are represented by the shaded areas.
The vertical dashed lines represent the signal region.
For (a) the dashed-dotted line shows the continuum-like background contribution, with peaking background contributions
represented by the small dashed line.
For (b) the dashed-dotted line shows the sum of background and continuum contributions.
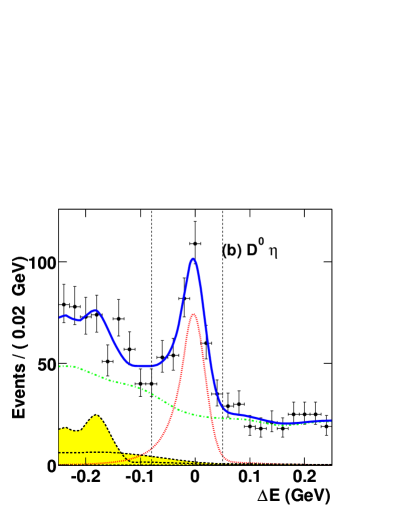
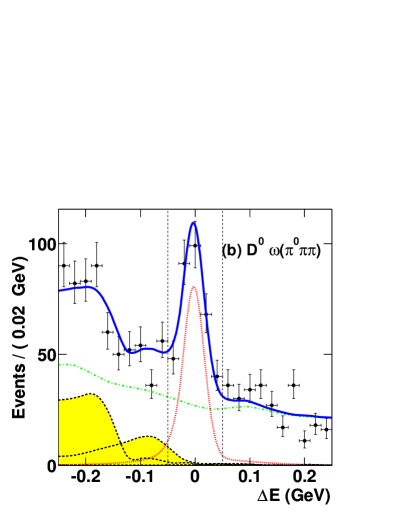
Figure 4:
Distributions of (a) and (b) for . Points with error bars
represent the data,
the solid line shows the result of the fit and the dotted line represents the signal contribution.
The vertical dashed lines represent the signal region.
For (a) the dashed-dotted line shows the continuum-like background contribution, with peaking background contributions
represented by the small dashed line.
For (b) the dashed-dotted lines show the sum of background and continuum contributions.
Significant background contributions arise both from
color favored decays
and from contributions from other color suppressed decays (crossfeed)
.
Some backgrounds have the same final state
as the signal while others mimic signal due to missing or extra particles.
Generic Monte Carlo samples of and continuum are used
to study the background contributions in the and distributions.
The event sample excludes the color suppressed modes under investigation and associated modes.
These signal modes for each of the decay chains considered and the corresponding decays are
generated and reconstructed separately. They are used to estimate the crossfeed contributions to the other modes using the branching
fractions measured here and by the BaBar collaboration ref:Babar .
A combined generic Monte Carlo sample weighted according to the effective production cross sections
and selection efficiencies of and is also used.
Figures 2, 3 and 4
show the and distributions after application of
all selection requirements and with
the signal requirement applied for the distributions (a)
and
the signal requirement applied for the distributions (b).
The signal requirements used are for mode ,
for , and for . These regions are indicated
by vertical dashed lines on the figures.
The dominant crossfeed contributions to the decays are found to arise from the corresponding
decays. These contributions peak at same as the signal but are shifted to the lower side
in . As can be seen from the figures, the crossfeed contribution is substantial in the region
but quite small in the signal region.
Within the signal region the fraction of crossfeed is less than of the
observed yield in all cases.
For the mode the color allowed modes are found to be the dominant backgrounds.
Non-reconstructed soft from , photons from and
from produce the same final state as the signal.
However the missing particles cause a shift in with a broad peak centered at approximately .
In order to reduce contributions from this background, events that contain candidates
reconstructed as within the signal region and are rejected.
This requirement reduces the color allowed contribution in the region by about
it does little to reduce contributions in the signal region, but remains useful to facilitate background modelling.
The distribution of these backgrounds is found to contribute at and slightly below the the signal region.
VI Data modelling and Signal Extraction
Independent unbinned extended maximum likelihood fits to the and distributions are performed to obtain the signal yields.
The yields from the fits are used to extract the branching fractions, while the yields from the
fits are used to cross-check the results.
In most cases the shapes of the signal and background component distributions in and are obtained
from fits to MC samples.
The signal models used are the same for all modes, with the signals modelled with a Gaussian function
and the signals with an empirical formula that accounts for the asymmetric calorimeter
energy response, known as the Crystal ball line shape cbline , added
to a Gaussian function of the same mean. The signal models are represented in
Figures 2- 4 by the dotted lines.
Fits of the distributions to signal Monte Carlo for each final state are used to obtain the
signal shape parameters; all the signal shape parameters are allowed to float in fits to data.
The crossfeed contributions in and are studied using a combination of signal Monte Carlo samples from
all other color suppressed modes, weighted according to the branching fractions obtained here or from the Babar
measurements ref:Babar . Smoothed histograms obtained from this combined sample are used as estimates of the crossfeed
contributions. In the case the signal region requirement results in very small crossfeed contributions, which
are fixed at the Monte Carlo expectation. For there are considerable contributions
in the region ; the normalization of this component is allowed to float in the fit.
Continuum like backgrounds in the fits are modelled by an empirical threshold function known as
the ARGUS function argus . The small peaking background contributions
are modelled by a Gaussian of mean and width and normalization obtained by a fit to the background Monte Carlo distribution, using an ARGUS function plus a Gaussian. A systematic uncertainty of 50% is assigned to the determination
of this small background distribution.
This treatment allows the vast majority of the background to be simply modelled with the ARGUS shape leaving a
small but less well known peaking background component that represents the deviation from the ARGUS shape.
In fits to data distributions the ARGUS background function parameters
are fixed to the values obtained from fits to combined Monte Carlo
and continuum background samples. The signal parameters are free, as are the
normalizations of signal and background.
The small peaking background and crossfeed contributions are fixed at their expected values.
The background distributions in the
and are modelled using smoothed histograms obtained from a combined continuum and
generic Monte Carlo sample.
For the mode, the shapes of the distribution arising
from and continuum background are very different, necessitating separate modelling.
The continuum shape is modelled with a first order polynomial with slope obtained from fits to the continuum
Monte Carlo sample. The shape of the background is modelled with
a Gaussian function plus a second order polynomial, with parameters determined from a fit to
the generic Monte Carlo sample. In fits to data the large peak in the region that
arises principally from the color allowed decays is found to be broader than the Monte Carlo
expectation, thus all parameters of this color allowed Gaussian are allowed to float in the fit. The normalizations of the contributions
from the remainder of the background, the continuum and the signal are also floated in the fit, with the small crossfeed
fixed as discussed above.
The results of the and fits for the combined modes are presented in
Figures 2, 3 and 4.
Table 1: Measured signal region yields and MC estimates of signal region contributions for for the combined subdecay modes and the individual subdecay modes. The numbers of signal events and continuum like events obtained from the fit are listed together with their statistical uncertainties. MC estimates of the contributions from peaking background and crossfeeds from other color suppressed modes are listed together with their systematic uncertainties.
Mode
VII Branching Fraction results
Table 2: Efficiency from Monte Carlo , correction factor , and corrected efficiency for the combined modes and the individual submodes. This efficiency is for the 1d fit sample, with the signal region requirement applied. The relative uncertainty is given in brackets.
Mode
Table 3: Measured branching fractions for the process using separate subdecay mode samples, as obtained from the fit. The branching fractions are listed with statistical and systematic uncertainties.
Mode
Results of and fits are consistent; the agreement is typically within 50% of the statistical uncertainty.
The results from the fits are found to have a slightly smaller total uncertainty in most cases and are used for the final result.
Yields are obtained both from the individual subdecay mode samples and from samples with the three subdecay samples
combined. The yields from the one dimensional fits are shown in Table 1. Both peaking backgrounds and crossfeed
contributions in the signal region can be seen to contribute substantially less than the
extent of the statistical uncertainty on the signal yield.
The yields obtained are interpreted as branching fractions using the number of analyzed events,
the product of subdecay fractions from PDG pdg corresponding to the decay of into the
observed final states and the total selection efficiency. The efficiency for each mode is first obtained from signal Monte Carlo
samples and then corrected by comparing data and MC predictions for other processes.
For the reconstruction efficiency the correction is obtained from comparisons
of to and to , for data and Monte Carlo.
The MC efficiency, correction factor and corrected efficiency are presented in Table 2.
The corrections are obtained from the product of correction factors relevant to the final state of each submode.
The branching fraction results for
the individual submodes are shown in Table 3.
The combined submode systematic uncertainties and branching fraction results are
shown in Tables 4 and 5, respectively.
VIII Systematic Uncertainties
Table 4: Systematic uncertainties of the measured branching fractions for , for the combined submode samples, as estimated for the fit results.
Category
Tracking efficiency
2.6
2.6
2.6
2.6
2.6
efficiency
2.7
4.0
4.0
4.0
5.4
Kaon efficiency
1.0
1.0
1.0
1.0
1.0
Extra efficiency
0.4
0.4
0.4
0.4
0.4
Likelihood ratio efficiency
3.0
3.0
3.0
3.0
3.0
MC statistics
2.3
2.2
2.8
2.4
3.2
Peaking background
1.7
1.4
0.9
1.2
0.9
Crossfeed
1.0
1.7
0.7
1.4
0.5
resolution
5.0
5.0
5.0
5.0
5.0
Modelling variations
2.0
5.4
0.2
10.6
3.1
Branching Fractions , , ,
5.2
5.2
5.5
5.3
5.2
Number of events
0.7
0.7
0.7
0.7
0.7
Total (%)
9.5
11.1
9.9
14.4
11.0
Systematic uncertainties of the combined modes, estimated for the results based
on the fits are summarized in Table 4.
Uncertainties on the efficiency correction factors relevant to each final state are listed in the Tables
together with other uncertainties. For the fit the uncertainty from the peaking background, which is fixed at the MC expectation in the fit,
is obtained by propagating a 50% uncertainty on the normalization of this contribution. The crossfeed uncertainty is estimated as 25% of the
contribution from this source in the signal regions. This accounts for uncertainties on the branching fractions of the crossfeed contributions
and also differences observed between the floated crossfeed contributions in fits and the MC expectation.
Uncertainties arising from the background and signal modelling used are estimated from the changes in the yields as a
result of variations on the model parameters.
The total uncertainty is obtained regarding uncertainties from different sources as uncorrelated.
Table 5: Measured branching fractions for the process using combined subdecay mode samples, as obtained from the fit. The branching fractions are listed with statistical and systematic uncertainties. The result is obtained from a combined sample of and .
Mode
Branching fraction
IX Conclusion
Improved measurements of the branching fractions of the color-suppressed decays ,
and are presented.
The results are consistent with the previous Belle measurements.
The total uncertainty of the new results is two to three times smaller than the previous results,
mostly due to the seven times larger data sample.
However comparing the results with those of BaBar ref:Babar and CLEO ref:CLEO indicates an approximately
2 difference, with all three branching fractions measured here lower than the previous measurements.
All the branching fraction results are similar, in the range 1.8-2.4 .
The large values disfavour theoretical predictions based on naive factorization descriptions
and indicate the need for models including final state interaction effects to satisfactorily
describe the observations.
Acknowledgments
We thank the KEKB group for the excellent operation of the
accelerator, the KEK Cryogenics group for the efficient
operation of the solenoid, and the KEK computer group and
the National Institute of Informatics for valuable computing
and Super-SINET network support. We acknowledge support from
the Ministry of Education, Culture, Sports, Science, and
Technology of Japan and the Japan Society for the Promotion
of Science; the Australian Research Council and the
Australian Department of Education, Science and Training;
the National Science Foundation of China under contract
No. 10175071; the Department of Science and Technology of
India; the BK21 program of the Ministry of Education of
Korea and the CHEP SRC program of the Korea Science and
Engineering Foundation; the Polish State Committee for
Scientific Research under contract No. 2P03B 01324; the
Ministry of Science and Technology of the Russian
Federation; the Ministry of Education, Science and Sport of
the Republic of Slovenia; the National Science Council and
the Ministry of Education of Taiwan; and the U.S. Department of Energy.
References
(1)
Throughout this paper,
the inclusion of the charge conjugate mode decay is implied
unless otherwise stated.
(2)
K. Abe et al.(Belle Collaboration), Phys. Rev. Lett. 88, 052002 (2002).
(3)
A. Satpathy et al.(Belle Collaboration), Phys. Lett. B 553,
159 (2003).
(4)
T.E. Coan et al.(CLEO Collaboration), Phys. Rev. Lett. 88,
062001 (2002).
(5)
B. Aubert et al.(BABAR Collaboration), Phys. Rev. D 69,
032004 (2004).
(6) M. Beneke, G. Buchalla, M. Neubert, and C.T. Sachrajda,
Nucl. Phys. B 591, 313 (2000).
(7) M. Neubert and B. Stech,
in Heavy Flavours II, eds. A.J. Buras and M. Lindner (World
Scientific, Singapore, 1998), p. 294 [hep-ph/9705292].
(8) M. Neubert and A.A. Petrov,
Phys. Lett. B 519, 50 (2001).
(9) C-K. Chua, W-S. Hou, and K-C. Yang,
Phys. Rev. D 65, 096007 (2002).
(10) J.L. Rosner,
Phys. Rev. D 60, 074029 (1999).
(11) A. Deandrea and A.D. Polosa,
Eur. Phys. Jour. C 22, 677 (2002).
(12) C-W. Chiang and J.L. Rosner,
Phys. Rev. D 67, 074013 (2003).
(13) S. Mantry, D. Pirjol, and I.W. Stewart, hep-ph/0306254 (2003);
C.W. Bauer, D. Pirjol, and I.W. Stewart, Phys. Rev. Lett. 87,
201806 (2001); C.W. Bauer, B. Grinstein, D. Pirjol, and I.W.
Stewart, Phys. Rev. D 67, 014010 (2003).
(14) Y-Y. Keum et al., hep-ph/0305335 (2003), submitted to Phys. Rev. D.
(15)
S. Kurokawa and E. Kikutani, Nucl. Instr. and. Meth. A499, 1 (2003),
and other papers included in this volume.
(16)
A. Abashian et al. (Belle Collaboration),
Nucl. Instr. and Meth. A 479, 117 (2002).
(17)
The Fox-Wolfram moments were introduced in
G. C. Fox and S. Wolfram, Phys. Rev. Lett. 41, 1581 (1978).
The Fisher discriminant used by Belle, based on modified Fox-Wolfram
moments (SFW), is described in
K. Abe et al. (Belle Collaboration), Phys. Rev. Lett. 87,
101801 (2001) and
K. Abe et al. (Belle Collaboration), Phys. Lett. B 511, 151
(2001).
(18)
J. E. Gaiser et al., Phys. Rev. D 34, 711 (1986).
(19) H. Albrecht et al. (ARGUS Collaboration), Phys. Lett. B 229, 304 (1989).
(20)
S. Eidelman et al., Phys. Lett. B 592, 1 (2004).