JET PHYSICS AT 2 TEV
Abstract
In this contribution, a review of some of the most important QCD jet preliminary results from both CDF and D0 experiments in Run II is presented, together with future prospects as the integrated luminosity increases.
1 Introduction
The Run II at Tevatron will define a new level of precision for QCD studies in hadron collisions. Both collider experiments, CDF and D0, expect to collect up to of data in this new run period. The increase in instantaneous luminosity, center-of-mass energy (from 1.8 TeV to 1.96 TeV) and the improved acceptance of the detectors will allow stringent tests of the Standard Model (SM) predictions in extended regions of jet transverse momentum, , and jet rapidity, . In this contribution, a review of some of the most important QCD results from Run II is presented, together with future prospects as the integrated luminosity increases.
2 Inclusive Jet Production at the Tevatron
The measurement of the inclusive jet production cross section for central jets constitutes one of the pillars of the jet physics program at the Tevatron. It provides a stringent test of perturbative QCD predictions over almost nine orders of magnitude and probes distances up to . Thanks to the increase in the center-of-mass energy in Run II the jet production rate has been multiplied (by a factor of five for jets with GeV) and the first measurements have already extended the coverage by 150 GeV compared to Run I. In addition, both CDF and D0 experiments explore new jet algorithms, following the theoretical work that indicates that the cone-based jet algorithm employed in Run I is not infrared safe and compromises a future meaningful comparison with pQCD calculations at NNLO.
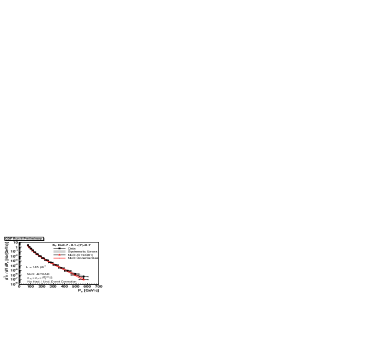
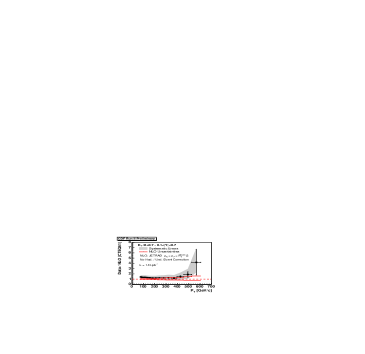
Figure 1 shows the measured inclusive jet cross section by CDF using the longitudinally invariant algorithm [1] and based on the first 145 of Run II data. Measurements have been performed using values for the D parameter in the expression,
| (1) |
equal to 0.5, 0.7 and 1.0. The measurements are compared to pQCD NLO calculations [2] using CTEQ6 [3] parton density functions in the proton and antiproton and the renormalization and factorization scales set to . The measured cross section is reasonably well described by the predictions for within the present uncertainties. The systematic errors on the data are dominated by the uncertainty on the jet energy scale determination while the theoretical predictions suffer from our limited knowledge of the gluon distribution at high . At lower , the data is systematically above the predictions and the effect increases as D increases (see Figure 2). This indicates the presence of soft-gluon contributions and fragmentation effects that have not been taken into account yet.
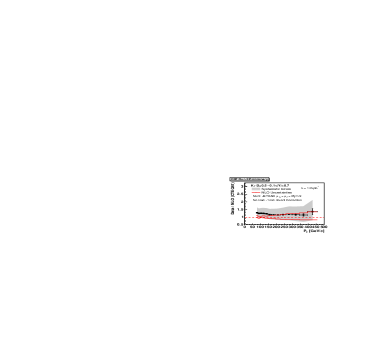
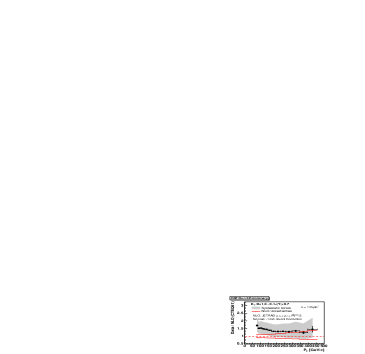
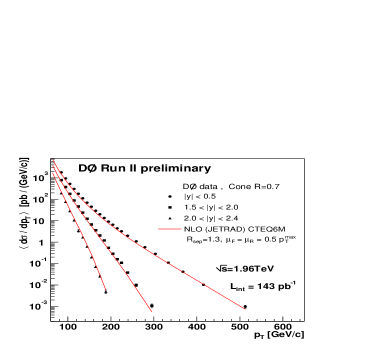
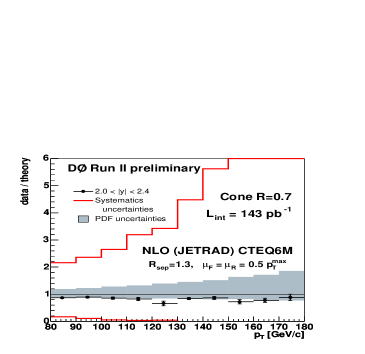
Figure 3 shows the measured inclusive jet cross section by D0 based on the first 143 of Run II data. The new midpoint[4] jet algorithm has been used with a cone size R=0.7. This algorithm constitutes an improved version of the cone-based algorithm used in Run I and it is shown to be infrared safe in fixed-order parton-level calculations.
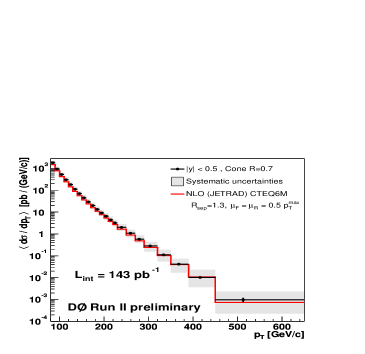
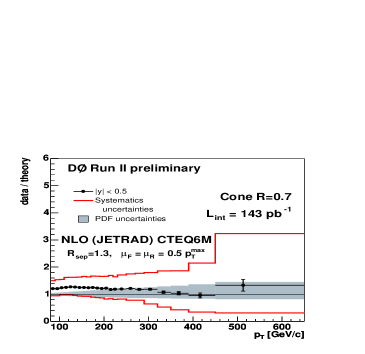
The data is in good agreement with the pQCD NLO predictions using
CTEQ6 parton density functions and . However, the measurement
is dominated by a relatively large uncertainty on the absolute jet energy scale.
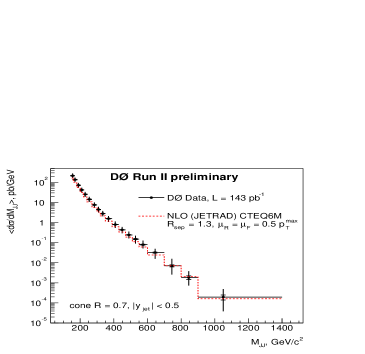
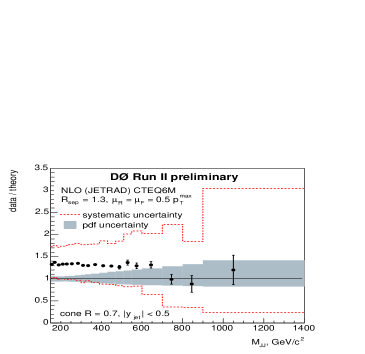
Figure 4 shows the measured cross section by D0
as a function of the dijet invariant mass in dijet production of central jets. This measurement
is particularly sensitive to the presence of narrow resonances
decaying into jets of hadrons up to masses of 1.3 TeV. The data is well described by pQCD NLO predictions.
Nowadays, the Tevatron high- jet data is used, together with prompt-photon data from fixed target experiments, to constrain the gluon distribution at high . Jet measurements at large rapidities are important because they constrain the gluon density in a region in where no effect from new physics is expected. The D0 experiment has already extended the jet cross section measurements to the forward region for jets with (see Figure 5). At the moment, the results are affected by large systematic errors. In the near future the experiments will highly reduce their uncertainties and precise cross section measurements will allow to further constrain the gluon distribution, and enhance their sensitivity to new physics at very high .
3 Study of the Underlying Event
As mentioned in the previous section, the hadronic final states at 2 TeV are characterized by the presence of soft underlying emissions, usually denoted as underlying event, in addition to highly energetic jets coming from the hard interaction. The underlying event contains contributions from initial- and final-state soft gluon radiation, secondary semi-hard partonic interactions and interactions between the proton and anti-proton remnants that cannot be described by perturbation theory. These processes must be approximately modeled using Monte Carlo (MC) programs tuned to describe the data.
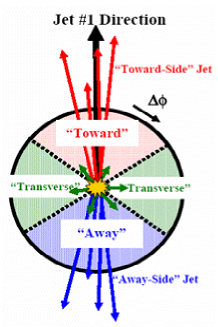
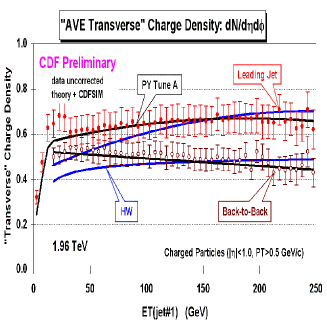
The jet energies measured in the detector contain an underlying event contribution that has to be taken into account in order to compare the measurements to pQCD predictions. Hence, a proper understanding of this underlying contribution is crucial to reach the desired precision in the measured cross sections. In the analysis presented here, the underlying event in dijet production has been studied by looking at regions well separated from the leading jets, where the underlying event contribution is expected to dominate the observed hadronic activity. Jets have been reconstructed using tracks with GeV and and a cone algorithm with R=0.7. The space around the leading jet is divided in three regions: toward, away and transverse (see Figure 6-left), and the transverse region is assumed to reflect the underlying event contribution. Figure 6-right shows the average track density in the transverse region as a function of of the leading jet. Measurements are presented for the dijet inclusive sample and for events where the two leading jets are forced to be back-to-back in , in order to further reduce extra hard-gluon radiation. The observed plateau indicates that the underlying event activity is, to a large extend, independent from the hard interaction. The measurements have been compared to the predictions from PYTHIA [6] and HERWIG [7] MC programs. The PYTHIA samples have been created using a special tuned set of parameters, denoted as PYTHIA-Tune A, which includes an enhanced contribution from initial-state soft gluon radiation and secondary parton interactions. It was determined as a result of similar studies of the underlying event performed using CDF Run I data [8]. PYTHIA-Tune A describes the hadronic activity in the transverse region while HERWIG underestimates the radiation at low . Similar measurements in Z+jet(s) events at high integrated luminosity will allow to explore the univesality of the underlying event contribution, in events with a very different color configuration in the final state.
4 Jet Shapes
The internal structure of jets is dominated by multi-gluon emissions from the primary final-state parton. It is sensitive to the relative quark- and gluon-jet fraction and receives contributions from soft-gluon initial-state radiation and beam remnant-remnant interactions. The study of jet shapes at the Tevatron provides a stringent test of QCD predictions and tests the validity of the models for parton cascades and soft-gluon emissions in hadron-hadron collisions. The CDF experiment has presented results on jet shapes for central jets with transverse momentum in the region GeV GeV, where jets are searched for using the midpoint111A merging fraction has been used instead of the default . algorithm and a cone size . The integrated jet shape, , is defined as the average fraction of the jet transverse momentum that lies inside a cone of radius concentric to the jet cone:
| (2) |
where denotes the number of jets. The measured jet shapes have been compared to the predictions from PYTHIA-Tune A and HERWIG MC programs.
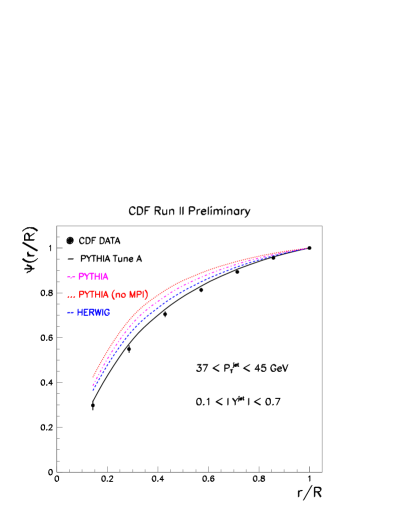
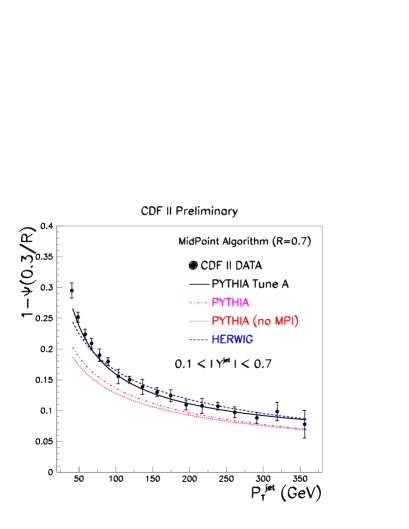
In addition, two different PYTHIA samples have been used with default parameters and with and without the contribution from multiple parton interactions (MPI) between proton and antiproton remnants, the latter denoted as PYTHIA-(no MPI), to illustrate the importance of a proper modeling of soft-gluon radiation in describing the measured jet shapes. Figure 7(left) presents the measured integrated jet shapes, , for jets with GeV, compared to HERWIG, PYTHIA-Tune A, PYTHIA and PYTHIA-(no MPI) predictions. Figure 7(right) shows, for a fixed radius , the average fraction of the jet transverse momentum outside , , as a function of . The measurements show that the fraction of jet transverse momentum at a given fixed increases ( decreases) with , indicating that the jets become narrower as increases. PYTHIA with default parameters produces jets systematically narrower than the data in the whole region in . The contribution from secondary parton interactions between remnants to the predicted jet shapes (shown by the difference between PYTHIA and PYTHIA-(no MPI) predictions) is relatively small and decreases as increases. PYTHIA-Tune A predictions describe all of the data well. HERWIG predictions describe the measured jet shapes well for GeV but produces jets that are too narrow at lower .
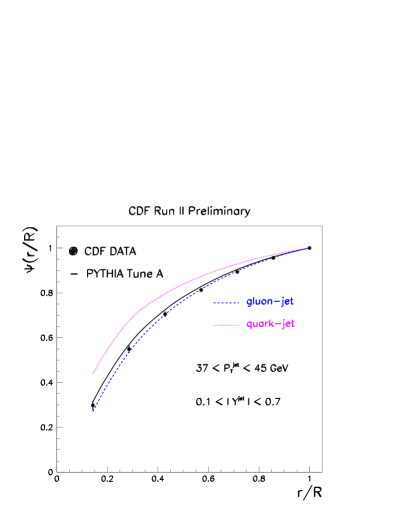
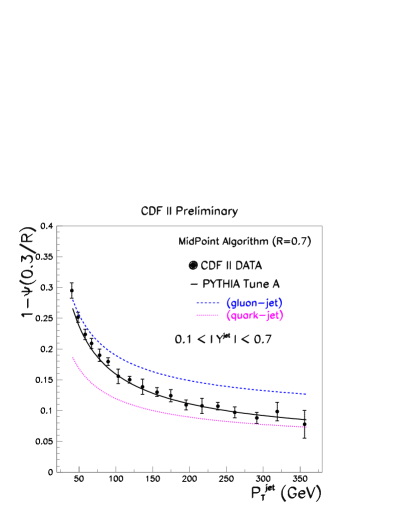
Figure 8(left) shows the measured integrated jet shapes, , for jets with
GeV, compared to PYTHIA-Tune A and the predictions for
quark- and gluon-jets222Each hadron-level jet from PYTHIA is classified as a quark- or gluon-jet
by matching its
directions with that of one of the outgoing partons from
the hard interaction. separately. Figure 8(right) shows the measured , , as a function of
. The MC predictions indicate that the measured jet shapes are dominated by
contributions from gluon-initiated jets at low while contributions from
quark-initiated jets become important at high . This can be explained in terms of
the different partonic contents in the proton and antiproton in the low- and high- regions, since the
mixture of gluon- and quark-jet in the final state partially reflects
the nature of the incoming partons that participate in the hard interaction.
For a given type of parton-jet in the MC (quark- or gluon-jet), the observed trend with
shows the running of the strong coupling, .
Jet shape measurements
thus introduce strong constrains on phenomenological models describing soft-gluon
radiation and the underlying event in hadron-hadron interactions. Similar studies with b-tagged jets
will be necessary to test our knowledge of the b-quark jet fragmentation processes in
hadron interactions, which is essential for future precise Top and Higgs
measurements at the Tevatron and the LHC.
5 Decorrelations
The D0 experiment has employed the dijet sample to study azimuthal decorrelations, , between the two leading jets. The normalized cross section:
| (3) |
is sensitive to the spectrum of the gluon radiation in the event. The measurements have been performed in different regions of the leading jet starting at GeV, and where the second jet is required to have at least GeV.
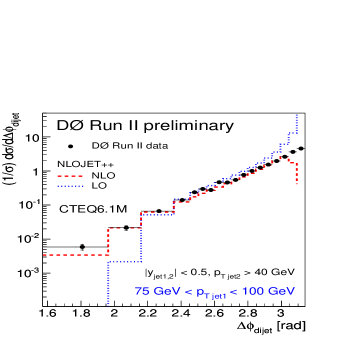
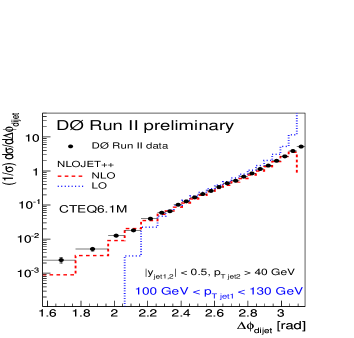
Figure 9 shows the measured cross section compared to LO and NLO predictions from NLOJET++ program [9]. The LO predictions, with at most three partons in the final state, is limited to , for which the three partons define a Mercedes-star topology.
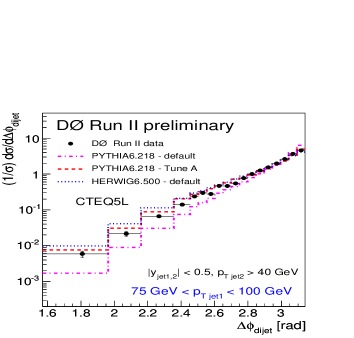
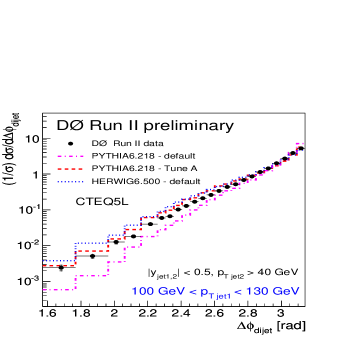
It presents a prominent peak at corresponding to the soft limit for which the third parton is collinear to the direction of the two leading partons. The NLO predictions, with four partons in the final state, describes the measured distribution except at very high and very low values of where additional soft contributions, corresponding to a resummed calculation, are necessary. A reasonable approximation to such calculations is provided by parton shower MC programs. Figure 10 presents the measured cross section compared to PYTHIA-Tune A, PYTHIA and HERWIG predictions in different regions of . PYTHIA with default parameters underestimates the gluon radiation at large angles. PYTHIA-Tune A predictions, which include an enhanced contribution from initial-state soft gluon radiation and secondary parton interactions, describe the azimuthal distribution. HERWIG also describes the data although it tends to produce less radiation than PYTHIA-Tune A close to the direction of the leading jets.
6 W+jet(s) Production
A detailed study of hard processes involving the associated production of a W boson and a given number of jets in the final state is a main goal of the CDF physics program in Run II. These processes constitute the biggest background to Top and Higgs production in hadron colliders. Therefore, precise measurements of W+ cross sections will be essential to test the LO and NLO QCD calculations used in order to estimate QCD-related backgrounds to Top and Higgs signals.
During the last years a number of new Boson+ LO programs have
become available [10] which include larger jet multiplicities in
the final state, in addition to NLO calculations for the W+dijet case. These
different programs are being interfaced to
parton-shower models using different matching procedures to avoid double counting
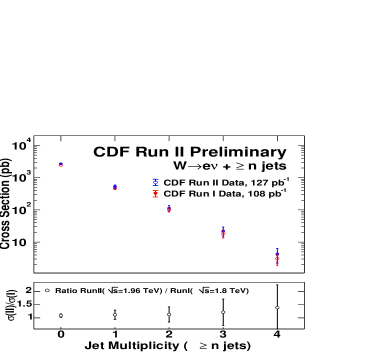
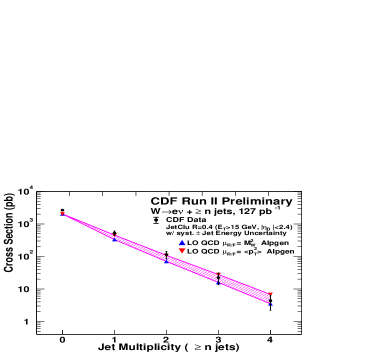
in the gluon radiation. Figure 11 shows the measured inclusive cross section for production
by CDF based on 127 of Run II data. Jets with GeV and
have been considered, where jets are searched for using the Run I cone algorithm with .
The measurements are compared to similar
results from Run I [11] and pQCD LO predictions for as implemented in
ALPGEN interfaced to the parton cascades and fragmentation from HERWIG. The measured cross section in Run II is
about larger than that in Run I thanks to the new centre-of-mass energy. The relative rates as
a function of jet multiplicity are similar to those observed in Run I which indicates that
the cross section is reduced by per each jet required. The pQCD LO predictions
describe the data well but suffer from large uncertainties due to the strong dependence on the
hard scale used in the calculation.
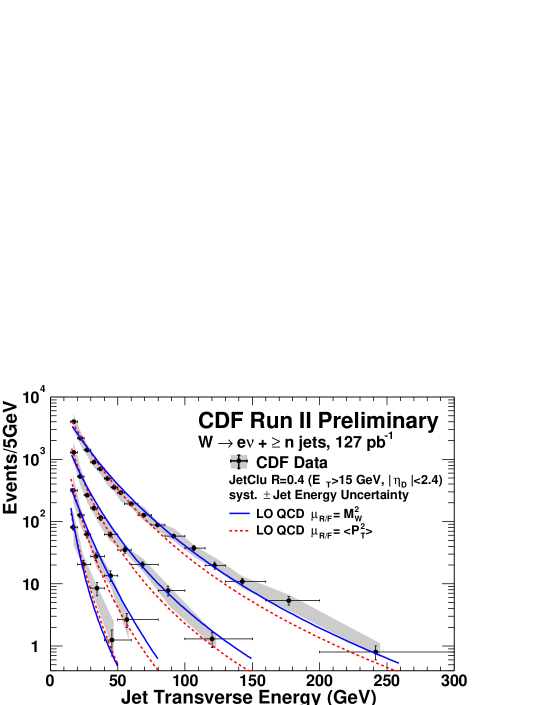
Figure 12 present the measured spectrum for the jet in
production. The spectrum for the least energetic jet is sensitive to
the details of the interface between the pQCD LO calculation and the parton shower evolution.
The measured spectrum is in agreement with the predictions from ALPGEN+HERWIG
within the present uncertainties. In the data the systematic errors are dominated by the jet energy scale
determination while the LO theoretical predictions present a strong dependence on the selected
renormalization and factorization scales.
As the recorded luminosity of the experiments increases,
precise measurements for production will be possible. Those measurements will be
compared to pQCD NLO calculations with much reduced theoretical uncertainties.
7 + Heavy Flavor Jet Production
The CDF experiment has presented measurements of cross sections for the production of high- photons in association with heavy quark jets, based on the first 66 of Run II data. Those processes can signal the presence of new physics like, for example, stop production when they are produced together with large missing transverse energy in the detector. In addition, these cross sections directly probe the heavy quark contents in the proton.
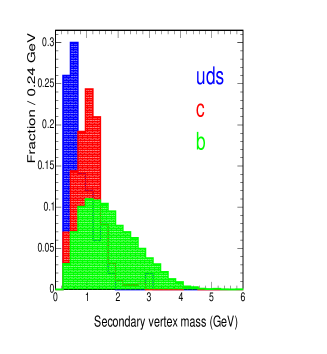
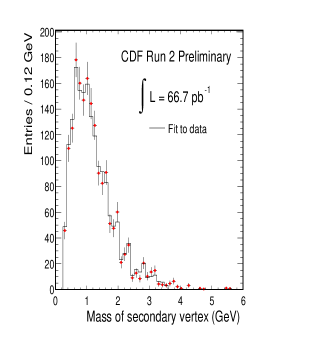
Displaced secondary vertices, coming from the decay of long-lived charm and bottom hadrons and reconstructed in the CDF silicon tracker, are used in order to identified jets coming from heavy quarks.
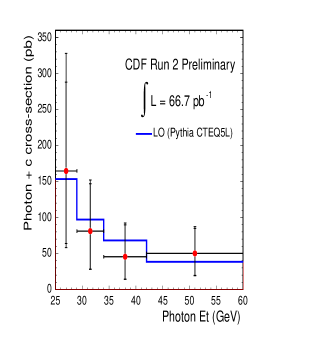
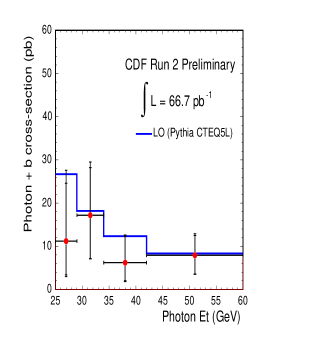
The mass of the observed secondary vertex is employed to separate the different contributions from charm, bottom and light quarks (the latter producing fake tags) to the sample of heavy-quark jet candidates. Monte Carlo templates are fitted to the measured secondary vertex mass distribution in the data (see Figure 13) to extract the different contributions and use them to compute the cross sections. Figure 14 shows the measured cross sections for and production compared to LO QCD predictions as implemented in PYTHIA. The measurements are in agreement with the predicted cross section within the still limited statistics in the data.
8 Acknowledgments
I thank PIC’04 organizers for their invitation, help and kidness during the conference in Boston and for the exciting program of talks and discussions they made possible.
References
- [1] Stephen D. Ellis, Davision E. Soper, Phys.Rev. D48 (1993) 3160-3166.
- [2] W.T. Giele, E.W.N. Glover, D. A. Kosower, Nucl. Phys. B403 (1993) 633-670.
- [3] J. Pumplin et al., JHEP 0207 (2002) 012.
-
[4]
G. C. Blazey, et al., hep-ex/0005012.
S.D. Ellis, J. Huston and M. Toennesmann, hep-ph/0111434. - [5] S. D. Ellis, Z. Kunszt, D. E. Soper, Phys.Rev.Lett. 69 (1992) 3615-3618.
- [6] H.-U. Bengtsson and T. Sjöstrand, Comp. Phys. Comm. 46 (1987) 43.
- [7] G. Marchesini et al., Comp. Phys. Comm. 67 (1992) 465.
- [8] D. Acosta et al., CDF Collaboration, Phys. Rev. D65 (2002) 092002.
- [9] Zoltán Nagy, Zoltán Trócsányi, Phys.Rev.Lett. 79 (1997) 3604-3607.
-
[10]
M. Mangano et al.: ‘ALPGEN’, preprint hep-ph/0206293.
E. Boss et al.: ‘CompHEP’, preprint hep-ph/9503280.
S. Tsuno et al.: ‘GR@APPA’, preprint hep-ph/0204222.
F. Maltoni and T. Stelzer: ‘MADGRAPH’, preprint hep-ph/0208156.
K. Ellis and J. Campbell: ‘MCFM’, preprint hep-ph/0202176. - [11] T. Affolder et al., The CDF Collaboration, Phys. Rev. D63 (2001) 072003.