EXPERIMENTAL RESULTS AND THEORETICAL DEVELOPMENTS OF MUON g-2
Abstract
The anomalous magnetic moments of both positive and negative muon have been meausred to a precision of 0.7 parts per million (ppm) at the Brookhaven Alternating Gradient Synchrotron. The results are over an order of magnitude more precise than the previous measurement of the muon. The results and , where the first uncertainty is statistical and the second is systematic, are consistent with each other. The average for the muon anomaly is . The standard model value of is calculated to a precision of ppm, which is dominated by uncertainty of hadronic contributions. There is a significant disagreement between the hadronic contribution calculated from the hadronic cross section of collision and that from hadronic decay. The difference between experimental and theoretical values of is for data or for decay data.
Department of Physics, Boston University, Boston, Massachusetts 02215
Brookhaven National Laboratory, Upton, New York 11973
Budker Institute of Nuclear Physics, Novosibirsk, Russia
Newman Laboratory, Cornell University, Ithaca, New York 14853
Kernfysisch Versneller Instituut, Rijksuniversiteit
Groningen, NL 9747 AA Groningen, The Netherlands
Physikalisches Institut der Universität Heidelberg, 69120
Heidelberg, Germany
Department of Physics, University of Illinois at Urbana-Champaign,
Illinois 61801
KEK, High Energy Accelerator Research Organization, Tsukuba,
Ibaraki 305-0801, Japan
Department of Physics, University of Minnesota,Minneapolis,
Minnesota 55455
Tokyo Institute of Technology, Tokyo, Japan
Department of Physics, Yale University, New Haven, Connecticut 06520
1 Introduction
The gyromagnetic factor of a particle is defined as
| (1) |
where , , , and are the magnetic moment, the spin, the mass, and the charge of that particle. For a pointlike lepton Dirac theory gives . Virtual radiative corretions cause the value for leptons to differ from 2. The anomalous -value is defined as .
The anomalous -value of the electron and muon, and , played an important role in the development of particle physics and continue to serve as fundamental quantities for testing the validity of the Standard Model and putting stringent constraints on speculative theories beyond the Standard Model. The value of is measured to the precision of 4 parts per billion (ppb). This value is currently the most precise measurement of fine structure constant .
For the muon, because the muon mass is larger than the electron mass , the contribution to from heavier particles such as hadrons or weak vector bosons through virtual processes is greater than that to typically by a factor of . This sensitivity enhancement of applies generally also for postulated new particles such as supersymmetric particles. Hence, the measurement of provides us more information than that of though is less well known than .
The muon anomalous magnetic moment was measured three times in CERN [1, 2, 3], and the precision of the last CERN measurement is ppm. The muon experiment at Brookhaven National Laboratory (E821) measures the of both the positive and the negative muon to ppm. Two values agree with each other and the precision of the combined value of is ppm[4, 5, 6, 7, 8].
2 Principle and setup of the experiment
For a muon moving in a uniform magnetic field , which is perpendicular to the muon spin direction and to the plane of the orbit, and with an electric field , both the spin and the momentum precess. The angular frequency difference, , between the spin precession frequency and the cyclotron frequency is given by
| (2) |
for and , where and are the mass and charge of the muon, is the speed of light, is the ratio of speed of the muon and the speed of light, and . In muon experiment, the dependence of on the electric field is eliminated by storing muons with the “magic” such that
| (3) |
This corresponds to a muon momentum GeV/c. Hence, the measurement of and determines ,
| (4) |
In our experiment, the magnetic field is measured by an NMR system which is calibrated with respect to the free proton NMR angular frequency as
| (5) |
where is the magnetic moment of the free proton. By combination with 4, 5 and using muon spin and the definition of ,
| (6) |
so that
| (7) |
The frequency is measured by counting high energy decay positrons. In the muon rest frame, parity violation in the decay causes to be emitted preferentially along the muon spin direction. Positrons emitted along the muon momentum direction get the largest Lorentz boost and have highest energy in the laboratory frame. Hence, the angle between the muon momentum and muon spin determines the number of high energy decay positrons. While the muon spin precesses with angular frequency and the muon momentum precesses with angular in the magnetic field, the number of decay positrons with energy greater than some threshold energy oscillates with the angular frequency and is ideally described by
| (8) |
in which is the dilated muon life time, is the asymmetry, is the phase of the oscillation. Both and depend on the energy threshold of the decay positrons. However, the frequency does not depend on .
The general arrangement of the muon experiment is shown in Fig. 1.

The proton beam from the Alternating Gradient Synchrotron(AGS) strikes a nickel target to produce pions. The pions are captured into a secondary beamline where a fraction of about decays to muons. We select the high energy muons which come from the forward decay. They are polarized due to the parity violation in the decay . The muons are injected through a superconducting inflector[11] into the muon storage ring with 1.45 T uniform magnetic field[12] which is measured by a NMR system[13] relative to the free proton NMR frequency. A pulsed magnetic kicker[14] at about from the injection point gives muons a 10 mrad deflection which places the muons onto stored orbits. The electrostatic quadrupole[15] fields provide vertical focusing. The decay positrons are detected by 24 lead/scintillating fiber electromagnetic calorimenters[16] read out by waveform digitizers. Both the waveform digitizer and NMR clocks were phase locked to the Loran C frequency signal.
3 Data Analysis
The data analysis in the experiment is divided into two independent parts, and analyses. The absolute values of and from analyses were modified by arbitrary offsets. No one knew both absolute values of and . The values of and then were evalueated only after both analyses had been finalized.
3.1 analysis
The measurements of the magnetic field at sub-ppm lever is done with NMR probes and is expressed relative to the free proton NMR frequency .
The NMR frequencies are measured with respect to a standard probe, which is a spherical water sample. The calibration of the standard probe with respect to the free proton is obtained from other experiments[17].
A trolley with 17 NMR probes was used to measure the field around the storage ring. The 17 trolley probes are calibrated with respect to the standard probe through a secondary probe called plunging probe, which can be mounted on a stand and moved in radial and vertical direction in vacuum chamber at one azimuthal location. The calibrations were done by comparing the NMR readings of the plunging probe and the trolley probes taken at the same location. The errors come from the position uncertainties of the trollye probes and of the plunging probe, and from the B field inhomogeneity, Large magnetic sextupole moments and field gradient in azimuth direction were introduced to measure the relative position of active volume of trolley probes and the plunging probe. The effect on the trolley probe calibration from temperature, power supply and magnetic field were also carefully studied.
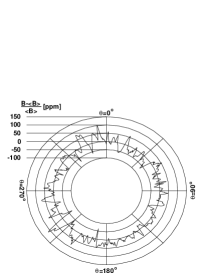
We measured the magnetic field with trolley about twice per week. One of the measurements of the magnetic field with the trolley center probe is shown vs. azimuth in Figure 2. For most of the ring, the magnetic field varies about ppm. The field measurements are averaged over azimuth for all 17 probes individually. Since the field component in radial and azimuthal direction are much smaller than that in vertical direction, the field can be expanded in 2-dimension
| (9) |
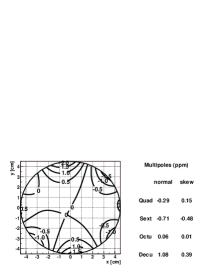
where is the radial direction in our ring, and are polar coordinates. The center of the storage region is at and the direction pointing outward is . The value of is set to be 4.5 cm. A half ppm contour plot and the multipoles of the azimuthal average of the field measured in one trolley run are shown in Figure 2.
The field between trolley runs was measured by a fixed probe system of 378 NMR probes. More than 120 probes are used in the analysis because of their good qualities. The average measurements from those fixed probes during the trolley run is calibrated with respect to the trolley measurements.
The muon distribution is taken into account by using the field value at the center of the muon distribution. The radial muon distribution is measured by fast rotation with uncertainty of 1 mm. The vertical muon distribution is symetric around the central plane determined by electric quadruples, and the uncertainty is 2 mm.
The contributions to the total systematic error from different sources are given in Table 1 for 2001 run. And the result for weighted by the muon distribution in 2001 is found to be
| (10) |
| Source of errors | Size [ppm] |
|---|---|
| Absolute calibration of standard probe | |
| Calibration of trolley probes | |
| Trolley measurements of | |
| Interpolation with fixed probes | |
| Uncertainty from muon distribution | |
| Others † | |
| Total Systematic Error on |
† Higher multipoles, trolley temperature and voltage response, and eddy currents from the kickers, and time-varying stray fields..
3.2 analysis
In 2001 run, We collected about 4 billions of electrons after the injection and with reconstructed energy larger than 1.8GeV. The detection time of electrons are randomized by cyclotron period to eliminate the bunch structure at early time. And the time spectrum after randomization is shown in Fig. 3.
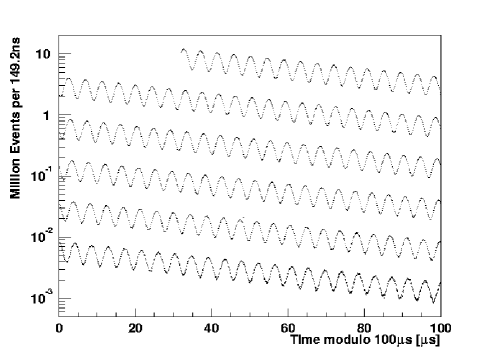
The leading characteristics of the time spectrum are those of muon decay and the muon g-2 oscillation, , as shown in Eq. 11
| (11) |
Additional effects includes pulse overlap, detector gain stability, muon loss and coherent betatron oscillation (CBO). Among those, CBO in horizontal plane has the largest effect on the determination of . CBO is caused by injecting muons through narrow aperture of the inflector into larger aperture of the strorage ring. Since the calorimeter acceptance varies with the decay position of muons, the time and energy spectra of decay electrons are modulated with the CBO frequency. The beating frequency between CBO and is very close to . Hence, the CBO has large effect on determination of . Since the phase of CBO oscillation varies from 0 to around the ring, its effect in the sum of spectra from all detectors is significantly smaller than that in any individual detector. The CBO effect is also accounted in the fitting functions. In 2001, we ran our experiment at two values of CBO frequency, one with CBO frequency larger than and the other with CBO frequecy smaller than . Fitting the sum spectrum with function taking into account the CBO gave small systematic error for both cases.
Two approaches were used to obtain the value of . In one approach, we fit the time spectrum directly with some multi-parameter function. The function includes Eq. 11 and the effects from gain change, CBO, muon losses. The fitting function is slightly different for different analyzer. The other approach is called ratio method. The data are randomly assigned to four statistically independent subsets to . The subsets are rejoined in and , where is an estimate of the period, and then combined to form the time spectrum . The rate modulation of is degrees out of phase compared to that of , and to sufficient precision can be described by
| (12) |
where is the period and is the dilated lifetime of muons. The ratio is largely insensitive to change of observed counts on time scales larger than . However, CBO effect still has to be taken into account in ratio method.
We completed four independent analyses. They all agree with one another within the expected variation. The combined result
| (13) |
where the first uncertainty is statistical uncertainty and the second is the combined systematic uncertainty. And the systematic errors are listed in Table 2.
| Source of errors | Size [ppm] |
|---|---|
| Coherent betatron oscillation | |
| Pileup | |
| Gain change | |
| Lost muons | |
| Others † | |
| Total Systematic Error on |
† AGS background, timing shifts, E field and vertical oscillations, beam debunching/randomization, binning and fitting procedure.
3.3 results
The value of was determined after the analyses of and had been finalized,
| (14) |
in which the correlations between the systematic uncertainties have been taken into account.
In Eq. 7, is measured by [10] to high precision for only. Hence and cannot be done directly. Instead, we compared values from ad . The difference is
| (15) |
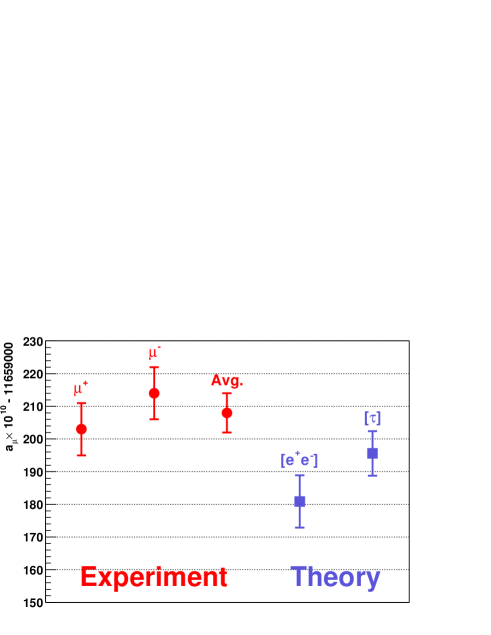
and is consistent with 0. Assuming CPT, we combine the results from and and obtain
| (16) |
Fig. 4 shows the measurements and the theoretical prediction of .
4 Theory
In the Standard Model, the contributions to are divided into three types, QED, hadronic and weak.
| (17) |
The QED contribution has the largest contribution but least uncertainty. The calculation up to order of gives
| (18) |
A recent recalculation of the terms of order of increases the QED contribution to
| (19) |
The weak contribution has been calculated to the second order and is evaluated as
| (20) |
The hadronic contribution cannot be calculated from pertubative QCD alone because it involves low energy scales near the muon mass. However, the leading order of hadronic contribution [21, 22, 23] can be determined directly from the annihilation of to hadrons through a dispersion integal
| (21) |
in which is the energy in the center of mass frame, is a kinematic factor and
| (22) |
The value can be indirectly determined using data from hadronic decays, the conserved vector current hypothesis, plus the appropriate isospin correction. In principle, the large statistics of decay data could improve the precision of (had). However, discrepancies between the and data exist as shown in Fig. 5.

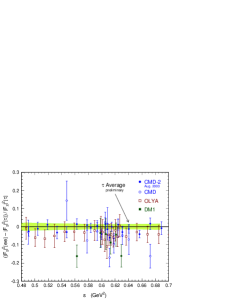
The data were dominated by the data from CMD2 experiment. The recent result from radiative return data[25] with comparable uncertainty agree with the CMD2 experiment. The next leading order hadronic contribution[26, 27, 23] and the hadronic light-by-light scattering[28, 29, 30, 31, 32] are calculated by serveral groups and the combined the results are
| (23) |
The large discrepancies between and data prevent us from combining two to obtain a single standard model prediction. The differences between experimental measurement and the standard model prediction are
| (24) |
| (25) |
The question concern the discrepancies betweent and data are under further theoretical scrutiny and we expected more radiative return measurements and efforts from latice calculation.
References
- [1] G. Charpak et al., Nuovo Cim. 37 1241 (1965).
- [2] J. Bailey et al., Nuovo Cim. A9 369 (1972).
- [3] J. Bailey et al., Nucl. Phys. B150, 1 (1979).
- [4] Muon Collaboration, R.M. Carey et al., Phys. Rev. Lett. 82, 1632 (1999).
- [5] Muon Collaboration, H.N. Brown et al., Phys. Rev. D62, 091101 (2000).
- [6] Muon Collaboration, H.N. Brown et al., Phys. Rev. Lett. 86, 2227 (2001).
- [7] Muon Collaboration, G.W. Bennett et al., Phys. Rev. Lett. 89, 101804 (2002).
- [8] Muon Collaboration, G.W. Bennett et al., Phys. Rev. Lett. 92, 161802 (2004).
- [9] D.E. Groom et al., Eur. Phys. J. C15, 1 (2000).
- [10] W. Liu et al., Phys. Rev. Lett 82, 711 (1999).
- [11] A. Yamamoto et al., Nucl. Instrum Meth. A491, 23 (2002).
- [12] G. Danby et al., Nucl. Instrum. Meth. A457, 151 (2001).
- [13] R. Prigl et al., Nucl. Instrum. Meth. A374 118 (1996).
- [14] E. Efstathiadis et al., Nucl. Instum Meth. A496, 8 (2003).
- [15] Y. Semertzidis et al., Nucl. Instrum. Meth. A 503 458, (2003)
- [16] S. Sedykh et al., Nucl. Instrum. Meth. A455 (2000)
- [17] X. Fei, V. Hughes, and R. Prigl, Nucl. Instrum, Meth. A394, 349 (1997).
- [18] T. Kinoshita and W.J. Marciano in Quantum Electrodynamics ed. T. Kinoshita (World Scientific, Singapore, 1990), p. 419.
- [19] T. Kinoshita and M. Nio, hep-ph/0402206, (2004).
- [20] A. Czarnecki, W.J. Marciano, and A. Vainshtein, Phys. Rev. D67 073006 (2003).
- [21] M. Davier, S. Eidelman, A. Höcker, Z. Zhang, Eur. Phys. J. C31, 503 (2003).
- [22] S. Ghozzi and F. Jegerlehner, hep-ph/0310181, (2004).
- [23] K. Hagiwara, A. Martin, D Nomura, and T. Teubner, Phys. Rev. D69, 093003, (2004).
- [24] R.R. Akhmetshin, et al., (CMD-2), Phys. Lett. B527, 161 (2002).
- [25] KLOE collaboration, hep-ex/0407048, (2004).
- [26] B. Krause, Phys. Lett. B390, 392 (1997).
- [27] R. Alemany, M. Davier, A. Höcker, Eur. Phys. J. C2, 123, (1998).
- [28] M. Hayakawa and T. Kinoshita, hep-ph/0112102 (2001).
- [29] J. Bijnens, E. Pallante, and J. Prades, Nucl. Phys. B 626, 410 (2002).
- [30] M. Knecht and A. Nyffeler, Phys. Rev. D65 073034 (200)
- [31] M. Knecht, A. Nyffeler, M. Perrottet, and E. de Rafael, Phys. Rev. Lett. 88 071802 (2002).
- [32] I. Blokland, A. Czarnecki, and K. Melnikov, Phys. Rev. Lett. 88, 071803 (2002).