FERMILAB-CONF-04-196-E
Low-Energy Neutrino Beams with an
Upgraded Fermilab Proton Driver
S.J. Brice, S. Geer
Fermilab
K. Paul
University of Illinois
R. Tayloe
Indiana University
1 Introduction
The Fermilab Long Range Planning Committee [1] has considered which facilities and associated physics programs might provide an exciting future for the laboratory beyond the Tevatron Collider era. Two accelerator-facility-based physics programs have emerged as leading candidates for Fermilab’s future: (i) a Linear Collider and (ii) an expanded neutrino oscillation physics program driven by a new high intensity 8 GeV proton source delivering a 2 MW beam on target [2]. A small fraction of the beam from the new proton source would be injected into the Fermilab MI to provide a higher energy (up to 120 GeV) proton beam, also with 2 MW beam power on target. This scheme would enable the intensity of the NuMI neutrino beam to be increased by a factor of about 5 for on-axis and/or off-axis long-baseline experiments, whilst at the same time providing an almost 2 MW proton beam at 8 GeV for lower energy neutrino experiments. In this note we describe the properties of various low energy neutrino beams that could be created with a 2 MW proton beam at 8 GeV.
2 A High Intensity MiniBooNE-Like Beam
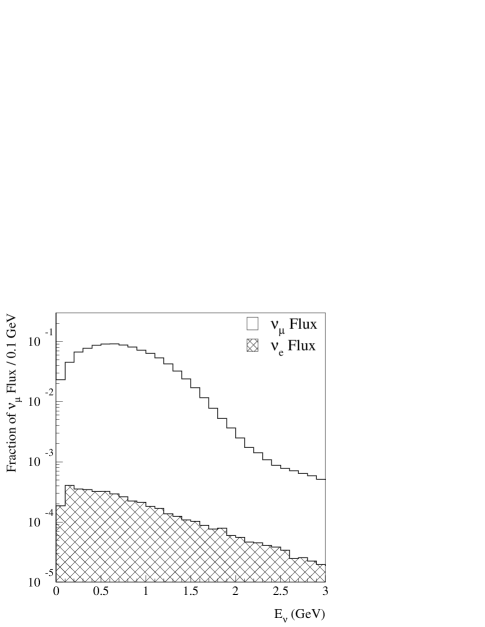
The existing MiniBooNE beamline and detector [5] provide a useful point of comparison for neutrino beams at a future proton driver. MiniBooNE takes 8 GeV protons from the FNAL Booster, steers them into a Beryllium target, and uses a magnetic horn to focus the resulting mesons. The mesons are given 50m to decay before hitting a concrete absorber. The resulting neutrino beam crosses 500m of dirt before reaching the MiniBooNE detector, a 6.1m radius spherical tank of mineral oil viewed by 1520 PMTs, looking at the erenkov and scintillation light created when neutrinos interact and produce charged particles in the tank. Fig. 1 shows the simulated and energy spectra at the MiniBooNE detector.
| Million events | |
|---|---|
| event type | per year |
| (CC QE) | |
| (NC QE) | |
| (CC ) | |
| (CC ) | |
| (NC ) | |
| (NC ) | |
| Other |
MiniBooNE’s design proton intensity calls for protons per spill, repeating at 5 Hz. For a -s operational year this corresponds to P/yr. An 8 GeV, 2 MW proton driver would deliver P/yr. Therefore, the event rates with a 2 MW proton driver can be obtained by scaling up the MiniBooNE event rates by a factor of . The rates for the dominant neutrino interaction channels are shown in Table 1.
3 Decay-at-Rest Neutrino Beams
The principal advantage of a neutrino beam from muon and pion decay at rest over beams produced in other ways is the extremely well known neutrino energy spectrum. The main disadvantage is that the flux is isotropic and drops as 1/R2 compared to the high degree of collimation of other beam types.
3.1 The Beam
A multi-GeV proton beam will interact in a target to produce pions and kaons. If the target is sufficiently large the charged pions will lose energy and come to rest. As they slow down some of the pions will decay to produce daughter muons, which will also lose energy and come to rest. The fate of the charged pions and muons will depend upon whether they are positively or negatively charged. The stopped positively charged pions and muons will decay at rest, producing a “prompt” flux from decay followed by a “delayed” and flux from the much slower decays. This time structure will be evident if the incoming primary proton beam bunch is short compared to the muon lifetime. In contrast, before they can decay most of the stopped negatively charged pions and muons will be absorbed by the atomic nuclei (the relevant capture rates are much larger than the decay rates). The suppression of negatively charged pion decays is enhanced in high- target materials for which the capture time is very short.
Pion and muon decays at rest (DAR) produce an isotropic flux of low energy , , and with energies between a few MeV and half the meson rest-mass energy. Neutrino spectra from DAR are shown in Fig. 2. Since the flux is isotropic, the challenge is to obtain sufficiently high intensities to be of interest to cutting-edge experiments. The key to meeting this challenge is to start with a very high intensity proton source. For this reason there has been some interest [3] in the possibility of exploiting the soon-to-be-completed Oak Ridge SNS facility as a low energy neutrino source. The SNS will provide a 1.4 MW primary proton beam at 1.3 GeV with a pulse length of 695 ns. The pulse length is short compared to the 2 s muon lifetime, and hence suitable time cuts can separate the neutrino flux produced from the decaying pions from the flux produced by decaying muons. During the duration of the proton pulse (from ns to ns) 96% of the positive pions decay. From ns to s the remaining 4% of the positive pions decay and 74% of the muons decay.
To a first approximation, at fixed beam power, low energy pion production rates are independent of proton beam energy. Hence a first guess at the neutrino fluxes from a DAR source at a 2 MW Fermilab proton driver can be based on DAR studies for the SNS, scaling upwards by a factor of about 1.4. To obtain a better estimate we have used the MARS code and simulated particle production, interaction, energy loss, and decay for an 8 GeV primary proton beam incident on a carbon target with dimensions sufficiently large to contain all of the produced pions. For comparison we have also simulated a 5 GeV proton beam incident on the target. To calculate neutrino event rates we have used the calculated SNS DAR rates and scaled these numbers to correspond to our calculated fluxes, which assume a 2 MW beam at 8 GeV (or 1.25 MW at 5 GeV), and a MiniBooNE-like detector placed 90 degrees off proton-beam axis at a distance of 60 m from the target. The resulting event rates are shown in Table 2 for an operational year ( s). Note that the 2 MW, 8 GeV proton source produces DAR neutrino fluxes that are a factor of 2.5 higher than a potential SNS DAR source, somewhat better than suggested by our naive estimate.
| FNAL (8 GeV) | FNAL (5 GeV) | SNS | |
| /yr | |||
| DAR () | |||
| (/yr) | |||
| e Events/yr | 2215 | 1347 | 886 |
| C (CC) Events/yr | 19825 | 12054 | 7930 |
| C (NC) Events/yr | 24133 | 14673 | 9653 |
3.2 The Physics
There are a number of fundamental physics measurements one can consider with a decay at rest beam. If MiniBooNE should confirm the indication of neutrino oscillations reported by the LSND experiment then a new generation of experiments investigating the oscilllation in fine detail and, in particular, its energy shape will be needed. Besides having an extremely well characterised neutrino spectrum the backgrounds in an LNSD- or MiniBooNE-style detector would be extremely low from a proton driver DAR beam (the beam related backgrounds are extremely low and a small machine duty factor would ensure very low cosmic-ray related backgrounds). This arrangement might be the ideal followup to MiniBooNE if that experiment should see an oscillation signal. Using the rates from Table 2 a MiniBooNE sized detector operating at an 8 GeV proton driver would see many hundreds of oscillations events per year (varying with the exact oscillation parameters) with about 5 beam unrelated background events and a couple of beam related backgrounds (including muon misIDs). These numbers are scaled from [3]. The low backgrounds and well-known spectrum at a DAR source more than make up for the drop in neutrino cross-section at the resulting comparatively low neutrino energies.
It has been suggested [7] that a neutrino beam from muon DAR can be used to search for a non-zero , the only unmeasured angle in the three neutrino mixing matrix. The effect of on appearance is maximised when the oscillation baseline is at the atmospheric . For muon DAR energies this puts the detector about 10km from the source and a very massive detector (on the scale of the proposed HyperK) would be required. Whilst this may be possible it is unlikely to happen on a timescale competitive with reactor or superbeam experiments.
Table 2 shows a healthy rate of neutrino electron scattering in a MiniBooNE scale detector at an upgraded FNAL proton driver. These events can be used to make a very low Q2 measurement of , the Weak mixing angle, by measuring the cross-section ratio
| (1) |
Neutrino electron scattering events can be identified by looking for very forward going electrons in the detector, and events from the numerator of the ratio come in time with the beam whereas events in the denominator come later (in general). Assuming all neutrinos have the same flux shape, and neglecting terms of order , this ratio calculated in the SM is
| (2) |
Based on the work of [6] a measurement of in this way at an upgraded FNAL proton driver would yield a 1-2% measurement of . This measurement would be at low Q2 compared to other weak mixing angle measurements. In fact the only other measurement in this Q2 range comes from the totally different regime of atomic parity violation. In view of the recent indications of non-SM behaviour in the extraction of from neutrino electron scattering at higher Q2 [8] this measurement from a decay at rest beam from an upgraded FNAL proton driver is very attractive.
Neutrino electron scattering can also be used to search for a neutrino magnetic moment as it adds an electromagnetic component to the otherwise weak neutrino electron scattering cross-section. This component gets stronger with decreasing electron recoil energy and so low energy neutrino sources such as reactors or stopped muon decay are the best places to go looking for it. The well known energy spectrum of decay at rest neutrinos is a particular advantage when looking for a distortion in the recoil electron energy spectrum caused by a neutrino magnetic moment.
4 Neutrino Beam from a Solenoid Decay Channel
4.1 The Beam
Neutrino beams are usually produced using a magnetic horn to sign select and focus the secondary charged pions into an approximately parallel beam that then propagates within a long large aperture decay pipe. An alternative approach is to use the optics that has been proposed for the upstream stage of a neutrino factory, in which a pion production target is within a high-field solenoid with a field strength , sufficiently high to radially contain essentially all of the produced charged pions. This means that, if is the maximum transverse momentum of the produced pions, then must be chosen such that
| (3) |
where is the radius of the beampipe around the target. Note that for an 8 GeV primary proton beam incident on a carbon target the secondary pion transverse momentum peaks at about 150 MeV/c. For the design we have explored cm and T. This system will capture particles with MeV/c, resulting in a captured beam with significantly broader energy spectrum than one captured with a horn.
It would be unnecessarily expensive to extend the 20 T solenoid for the full length of the decay channel downstream of the target. Therefore, downstream of the target the charged pions, and their daughter muons, are confined radially within a lower field ( T) larger radius ( cm) solenoid decay channel. To ensure efficient transfer of the beam from the high-field to the low-field solenoids, the distance over which the field is decreased must be approximately 10 m or more. Within this section the focusing field strength is adiabatically decreased whilst the beampipe radius is increased, keeping the magnetic flux within the beampipe, , constant. The continual transverse focusing of the beam throughout the entire length of the decay channel allows for the marked increase in muon yields over those from horn designs. A typical layout is shown in Figure 3.
The charged pions within the solenoid channel decay via and , with a lifetime of ns. The daughter muons decay with a lifetime of s via and . Due to the significant difference between the pion and muon lifetimes, the muon content of the beam will steadily increase over the first 75 m downstream from the target. At greater distances the muon content of the beam decreases as the muons decay. The muon and charged pion content of the beam is shown in Table 3 as a function of distance downstream from the target, , for an 8 GeV, 2 MW primary proton beam incident on a carbon target with a 25 m adiabatic section following the 20 T capture solenoid (Figure 3). The corresponding evolution of the charged pion and muon spectra is shown in Figure 4. Note that the simulated layout does not sign select the pion and/or muon beam. Hence, downstream of the decay channel, the neutrino beam contains neutrinos from and decays. However, the design can be modified by placing suitable large angle bends at any desired positions along the decay channel. Thus sign selection bends, and bends to enhance of the muon DAR component, are possible options.
| m | m | m | m | m | |
|---|---|---|---|---|---|
| 0.16 | 0.20 | 0.21 | 0.21 | 0.22 | |
| 0.16 | 0.20 | 0.21 | 0.21 | 0.21 | |
| 0.095 | 0.051 | 0.030 | 0.020 | 0.014 | |
| 0.087 | 0.044 | 0.025 | 0.016 | 0.011 |
| m | m | m | m | ||
|---|---|---|---|---|---|
| produced | 0.047 | 0.023 | 0.014 | 0.0095 | |
| reaching detector | 0.0034 | 0.0026 | 0.0023 | 0.0022 | |
| produced | 0.046 | 0.021 | 0.012 | 0.0086 | |
| reaching detector | 0.0028 | 0.0021 | 0.0019 | 0.0017 | |
| produced | 0.0031 | 0.0034 | 0.0033 | 0.0034 | |
| reaching detector | 0.000050 | 0.00010 | 0.00014 | 0.00016 | |
| produced | 0.0032 | 0.0035 | 0.0034 | 0.0034 | |
| reaching detector | 0.000046 | 0.000091 | 0.00013 | 0.00015 |
The flavor content of the neutrino beam depends upon the length of the decay channel (Table 4 and Figure 5). Early in the channel pion decays dominate. In the last 25 m segment of the decay channel the pions constitute a few percent of the charged particle beam, and the number of muon and pion decays are similar. Figures 7 and 8 show the neutrino fluxes from neutrinos born in the last 50 m of the decay channel at a distance of 100 m from the end of the decay channel. The fluxes are averaged over a 10 m radius from the axis of the beam. Figure 7 shows the neutrino fluxes produced solely from pion decays, and Figure 8 shows the corresponding neutrino fluxes from muon decays. It is worth noting that, while the number of pion and muon decays in the last 50 m of decay channel are comparable, the neutrinos coming from pion decays are considerably more collimated because of their comparatively higher energy in the last 50 m of the decay channel (Figures 5 and 6).
To calculate event rates we consider a MiniBooNE-like detector placed on axis at a distance of 100 m from the end of the decay channel. The rates for different interactions and neutrino types, assuming an 8 GeV, 2 MW proton driver in operation for a -s year, are shown in Table 5. The cross-sections on CH2 are computed using the NUANCE code [9].
| Million events per year | ||||||
|---|---|---|---|---|---|---|
| event type | () | () | () | () | () | () |
| (CC QE) | 24.9 | 6.5 | 0.83 | 0.37 | 0.95 | 0.28 |
| (NC QE) | 10.8 | 3.1 | 0.39 | 0.18 | 0.40 | 0.13 |
| (CC ) | 5.2 | 0.5 | 0.12 | 0.03 | 0.16 | 0.02 |
| (CC ) | 0.9 | 0.2 | 0.02 | 0.01 | 0.03 | 0.00 |
| (NC ) | 1.5 | 0.4 | 0.04 | 0.02 | 0.04 | 0.01 |
| (NC ) | 0.9 | 0.2 | 0.02 | 0.01 | 0.02 | 0.01 |
| Other | 1.8 | 1.3 | 0.05 | 0.07 | 0.06 | 0.04 |
4.2 The Physics
As can be seen in Figure 7, the () flux from () decays-in-flight resulting from this neutrino beam are large. The resulting neutrino event rates in a MiniBooNE-like detector 100m from the end of the decay channel will be unprecedented and could be used to precisely measure the neutrino oscillation parameters for both and in the range as is currently being investigated by the MiniBooNE experiment[3].
If MiniBooNE confirms the LSND result, this will indicate neutrino oscillations in the , eV2 range, and a systematic study of this effect, for both and , will be required. A solenoid-based neutrino beam with a large angle bend to sign select the pions would be an excellent source for these studies. The bend will allow for a relatively pure or beam, depending on the polarity of the bending magnet. The polarity reversal could take place on the timescale of hours or minutes, thus reducing systematic uncertainties between and running arising from detector response.
For these experiments, two large (kton) detectors, would be required at distances on the order of 100m and 250m (the exact locations would be determined by the neutrino data at the time of experiment construction). In addition, a relatively small detector ( tons) would be situated at a near location (m). This detector would be highly segmented to precisely monitor the flux cross section and would have charge identification to measure the “wrong-sign” component of the neutrino beam.
With this configuration of neutrino beam and detectors, simultaneous precision measurements of , , , and in the .1-1 eV2 region would be achievable. With the correct arrangement of detectors, an oscillation measurement using neutrinos from that decay-at-rest in the beam stop could also be conducted in parallel. These neutrinos have a different time structure due to the long-lifetime of the and are of much lower energy as described above. These factors will allow for a clean separation of the neutrino sources.
In addition to servicing the oscillation measurements, the near detector would be a rich source of non-oscillation neutrino physics. A 20 ton detector at 25m would collect events at 10% of the rate shown in Table 5. This would allow measurements of neutral- and charged-current processes with unprecedented precision. These details of these processes (cross-sections, energy- and -dependence) are needed for oscillation measurements and provide valuable information on nucleon structure.
5 Conclusions
We have considered three options for generating a low energy neutrino beam using an upgraded 2 MW Fermilab Proton Source; (i) a MiniBooNE-like beam using a conventional neutrino horn, (ii) a decay at rest neutrino source, and (iii) a neutrino beam downstream of a solenoid decay channel. In all three cases the fluxes are sufficiently large to provide an interesting physics program. The upgraded MiniBooNE-like beam would be a factor of 64 more intense than the existing beam. The decay at rest beam would offer an intensity that is a factor of 2.5 higher than the corresponding intensity at an equivalent source at the SNS. The solenoid decay channel beam has some characteristics which would make it particularly interesting if MiniBooNE were to confirm the LSND result, provided sign-selection can be implemented efficiently in a (bent) solenoid.
References
-
[1]
Fermilab Long Range Planning Committee,
(May 2004):
http://www.fnal.gov/pub/today/directors_corner/lrpreportfinal.pdf. -
[2]
R. Alber et al,
FERMILAB-TM-2169 (December 2004):
http://www-bd.fnal.gov/pdriver/8GEV/index.html. - [3] G. J. VanDalen, arXiv:nucl-ex/0309014.
-
[4]
N.V. Mokhov, ”The Mars Code System User’s Guide”, Fermilab-FN-628 (1995).
O.E. Krivosheev, N.V. Mokhov, ”MARS Code Status”, Proc. Monte Carlo 2000
Conf., p. 943, Lisbon, October 23-26, 2000; Fermilab-Conf-00/181 (2000);
N.V. Mokhov, ”Status of MARS Code”, Fermilab-Conf-03/053 (2003):
http://www-ap.fnal.gov/MARS/. -
[5]
MiniBooNE Collaboration,
(November 2003):
http://www-boone.fnal.gov/publicpages/runplan.ps.gz. - [6] R. Imlay, G. V. VanDalen, J.Phys.G: Nucl. Part. Phys. 29 (2003) 2647-2664.
- [7] S. V. Bulanov et al, arXiv:hep-ph/0404190.
- [8] NuTeV Collaboration, Phys.Rev.Lett. 88 (2002) 091802; Erratum-ibid. 90 (2003) 239902.
-
[9]
D.Casper, Nucl. Phys. Proc. Suppl. 112, 161 (202):
http://nuint.ps.uci.edu/nuance/.