M. Ablikim1, J. Z. Bai1,
Y. Ban10, J. G. Bian1, X. Cai1, J. F. Chang1,
H. F. Chen16, H. S. Chen1, H. X. Chen1,
J. C. Chen1, Jin Chen1, Jun Chen6, M. L. Chen1,
Y. B. Chen1, S. P. Chi2, Y. P. Chu1, X. Z. Cui1,
H. L. Dai1, Y. S. Dai18, Z. Y. Deng1, L. Y. Dong1,
S. X. Du1, Z. Z. Du1, J. Fang1, S. S. Fang2,
C. D. Fu1, H. Y. Fu1, C. S. Gao1, Y. N. Gao14,
M. Y. Gong1, W. X. Gong1, S. D. Gu1, Y. N. Guo1,
Y. Q. Guo1, Z. J. Guo15, F. A. Harris15,
K. L. He1, M. He11, X. He1, Y. K. Heng1,
H. M. Hu1, T. Hu1, G. S. Huang1† ,
L. Huang6, X. P. Huang1, X. B. Ji1, Q. Y. Jia10,
C. H. Jiang1, X. S. Jiang1, D. P. Jin1, S. Jin1,
Y. Jin1, Y. F. Lai1, F. Li1, G. Li1,
H. B. Li1‡, H. H. Li1, J. Li1, J. C. Li1,
Q. J. Li1, R. B. Li1, R. Y. Li1, S. M. Li1,
W. G. Li1, X. L. Li7, X. Q. Li9, X. S. Li14,
Y. F. Liang13, H. B. Liao5, C. X. Liu1, F. Liu5,
Fang Liu16, H. M. Liu1, J. B. Liu1, J. P. Liu17,
R. G. Liu1, Z. A. Liu1, Z. X. Liu1, F. Lu1,
G. R. Lu4, J. G. Lu1, C. L. Luo8, X. L. Luo1,
F. C. Ma7, J. M. Ma1, L. L. Ma11, Q. M. Ma1,
X. Y. Ma1, Z. P. Mao1, X. H. Mo1, J. Nie1,
Z. D. Nie1, S. L. Olsen15, H. P. Peng16,
N. D. Qi1, C. D. Qian12, H. Qin8, J. F. Qiu1,
Z. Y. Ren1, G. Rong1, L. Y. Shan1, L. Shang1,
D. L. Shen1, X. Y. Shen1, H. Y. Sheng1, F. Shi1,
X. Shi10, H. S. Sun1, S. S. Sun16, Y. Z. Sun1,
Z. J. Sun1, X. Tang1, N. Tao16, Y. R. Tian14,
G. L. Tong1, G. S. Varner15, D. Y. Wang1,
J. Z. Wang1, K. Wang16, L. Wang1, L. S. Wang1,
M. Wang1, P. Wang1, P. L. Wang1, S. Z. Wang1,
W. F. Wang1, Y. F. Wang1, Zhe Wang1, Z. Wang1,
Zheng Wang1, Z. Y. Wang1, C. L. Wei1, D. H. Wei3,
N. Wu1, Y. M. Wu1, X. M. Xia1, X. X. Xie1,
B. Xin7, G. F. Xu1, H. Xu1, Y. Xu1,
S. T. Xue1, M. L. Yan16, F. Yang9, H. X. Yang1,
J. Yang16, S. D. Yang1, Y. X. Yang3, M. Ye1,
M. H. Ye2, Y. X. Ye16, L. H. Yi6, Z. Y. Yi1,
C. S. Yu1, G. W. Yu1, C. Z. Yuan1, J. M. Yuan1,
Y. Yuan1, Q. Yue1, S. L. Zang1,
Yu Zeng1,Y. Zeng6, B. X. Zhang1, B. Y. Zhang1,
C. C. Zhang1, D. H. Zhang1, H. Y. Zhang1,
J. Zhang1, J. Y. Zhang1, J. W. Zhang1,
L. S. Zhang1, Q. J. Zhang1, S. Q. Zhang1,
X. M. Zhang1, X. Y. Zhang11, Y. J. Zhang10,
Y. Y. Zhang1, Yiyun Zhang13, Z. P. Zhang16,
Z. Q. Zhang4, D. X. Zhao1, J. B. Zhao1,
J. W. Zhao1, M. G. Zhao9, P. P. Zhao1,
W. R. Zhao1, X. J. Zhao1, Y. B. Zhao1,
Z. G. Zhao1∗, H. Q. Zheng10, J. P. Zheng1,
L. S. Zheng1, Z. P. Zheng1, X. C. Zhong1,
B. Q. Zhou1, G. M. Zhou1, L. Zhou1, N. F. Zhou1,
K. J. Zhu1, Q. M. Zhu1, Y. C. Zhu1, Y. S. Zhu1,
Yingchun Zhu1, Z. A. Zhu1, B. A. Zhuang1,
B. S. Zou1.
(BES Collaboration)
1
Institute of High Energy Physics, Beijing 100039, People’s Republic of
China
2 China Center for Advanced Science and Technology(CCAST),
Beijing 100080, People’s Republic of China
3 Guangxi Normal
University, Guilin 541004, People’s Republic of China
4 Henan
Normal University, Xinxiang 453002, People’s Republic of China
5
Huazhong Normal University, Wuhan 430079, People’s Republic of China
6 Hunan University, Changsha 410082, People’s Republic of China
7 Liaoning University, Shenyang 110036, People’s Republic of
China
8 Nanjing Normal University, Nanjing 210097, People’s
Republic of China
9 Nankai University, Tianjin 300071, People’s
Republic of China
10 Peking University, Beijing 100871,
People’s Republic of China
11 Shandong University, Jinan
250100, People’s Republic of China
12 Shanghai Jiaotong
University, Shanghai 200030, People’s Republic of China
13
Sichuan University, Chengdu 610064, People’s Republic of China
14 Tsinghua University, Beijing 100084, People’s Republic of
China
15 University of Hawaii, Honolulu, Hawaii 96822, USA
16 University of Science and Technology of China, Hefei 230026,
People’s Republic of China
17 Wuhan University, Wuhan 430072,
People’s Republic of China
18 Zhejiang University, Hangzhou
310028, People’s Republic of China
∗ Current address:
University of Michigan, Ann Arbor, MI 48109, USA
†
Current address: Purdue University, West Lafayette, Indiana 47907, USA
‡ Current address: University of Wisconsin at Madison,
Madison WI 53706, USA.
Abstract
is observed for the first time in a data sample
of 14 million decays collected by the BESII detector at the
BEPC. The branching fraction is measured to be
, where
the first error is statistical and the second one is systematic. A
high mass excited state with mass around 2.15 GeV/ is
also observed with . The
branching fraction of is measured with
improved precision, . The results may shed light on the
understanding of the longstanding “ puzzle” between
and hadronic decays.
pacs:
13.25.Gv, 12.38.Qk, 14.40.Gx
††preprint: Draft-PRL
From perturbative QCD (pQCD), it is expected that both and
decaying into light hadrons are dominated by the
annihilation of into three gluons or one virtual
photon, with a width proportional to the square of the wave
function at the origin appelquist . This yields the pQCD
“12% rule”, that is
A large violation of this rule was first
observed in decays to and by Mark
II mk2 , the so called puzzle. Since then BES
has measured many two-body decay modes of the ; some decays
obey the rule while others violate it besres . There have
been many theoretical efforts trying to solve the
puzzle puzzletheory . However, none has been accepted as
the solution to the problem.
In the study of the puzzle, is one of the
key decay modes and is of great interest to both theorists and
experimentalists. A recent calculation of the
branching fraction, done in the framework of SU(3) symmetry, takes
into consideration interference between resonance decays
and the continuum amplitude wymphase ; a branching fraction
of around is predicted with a
large error due to the limited precision for decays into
other vector pseudoscalar (VP) modes. The measurement of the
mode is a direct test of many models proposed to
solve the puzzle puzzletheory ; wymphase .
The data used for this analysis are taken with the Beijing
Spectrometer (BESII) detector at the Beijing Electron Positron
Collider (BEPC) storage ring operating at the energy. The
number of events is million moxh ,
determined from the number of inclusive hadrons, and the luminosity is
pb-1 as measured by large angle Bhabha events.
BESII is a conventional solenoidal magnet detector that is
described in detail in Refs. bes ; bes2 . A 12-layer vertex
chamber (VC) surrounding the beam pipe provides trigger
information. A forty-layer main drift chamber (MDC), located
radially outside the VC, provides trajectory and energy loss
() information for charged tracks over of the total
solid angle. The momentum resolution is ( in ), and the
resolution for hadron tracks is . An array of 48
scintillation counters surrounding the MDC measures the
time-of-flight (TOF) of charged tracks with a resolution of ps for hadrons. Radially outside the TOF system is a 12
radiation length, lead-gas barrel shower counter (BSC). This
measures the energies of electrons and photons over of
the total solid angle with an energy resolution of
( in GeV). Outside of the
solenoidal coil, which provides a 0.4 Tesla magnetic field over
the tracking volume, is an iron flux return that is instrumented
with three double layers of counters that identify muons of
momentum greater than 0.5 GeV/.
A phase space Monte Carlo sample of 2 million events
is generated for the efficiency determination in the partial wave
analysis (PWA). Monte Carlo samples of Bhabha, dimuon, and inclusive
hadronic events generated with Lundcharm lundcharm are used for
background studies. The simulation of the detector uses a
Geant3 geant based program, which simulates the detector
response, including the interactions of secondary particles with the
detector material. Reasonable agreement between data and Monte Carlo
simulation has been observed in various channels tested, including
, , , and
.
The final state of interest includes two charged pions and one
neutral pion which is reconstructed from two photons. The
candidate events must satisfy the following selection criteria:
1.
A neutral cluster is considered to be a photon candidate when
the deposited energy in the BSC is greater than 80 MeV, the angle
between the nearest charged track and the cluster is greater than
, the first hit of the cluster is in the beginning six
radiation lengths of the BSC, and the angle between the cluster development
direction in the BSC and the photon emission direction is less than
. The angle between two nearest photons is required to
be larger than . The number of photon candidates after
selection is required to be two.
2.
There are two charged tracks in the MDC with net charge zero.
A track should have a good helix fit and satisfy
, where is the polar angle of the track
in the MDC.
3.
For each charged track, the TOF and measurements are
used to calculate values and the corresponding confidence
levels for the hypotheses that the particle is a pion, kaon, or
proton (, , ). At least one charged track
is required to satisfy and .
Radiative Bhabha background is removed by requiring the tracks have
small or small energy deposited in the BSC. Dimuon
background is removed using the hit information in the muon counter.
4.
A four-constraint kinematic fit is performed under the
hypothesis , and the confidence level of
the fit is required to be greater than 1%. A Four-constraint
kinematic fit is also performed under the hypothesis of
, and
is required
to remove events.
5.
To remove background produced by cascade
decays to with , the invariant
mass of is required to be less than
.
After applying the above selection criteria, the invariant mass
distribution of the two photons is shown in Figure 1a. A
clear signal can be seen. A fit to the mass spectrum (shown
in Figure 1a) using a signal shape determined from
Monte Carlo simulation and a polynomial background yields s.
Figure 1: Two photon invariant mass distribution after
final selection for (a) data and (b) continuum data. The
histograms are data, and the curves show the best fits.
The contribution from the continuum wymphase ; wymz is measured
using pb-1 of data taken at GeV
(continuum data). Figure 1b shows the
invariant mass distribution and the fit. The number of from
the fit () is subtracted incoherently from the
data after normalizing by the two luminosities. This yields observed events.
Dalitz plots of the system for the and continuum
data are shown in Figure 2 after requiring the invariant
mass of the two photons lies within MeV/ of the nominal
mass. (The mass resolution is around 17.5 MeV/ from Monte
Carlo simulation.) For the sample, 250 events are obtained with
about 13% non- background, while for the continuum sample, 11
events are obtained with about 42% non- background. In
decays, besides clear bands at the edges of the Dalitz plot, there
is a cluster of events in the center. This is
very different than the Dalitz plot for
decays besjpsi3pi , indicating different decay dynamics between
and . There is no clear intermediate state in the
continuum data.
Figure 2: Dalitz
plots of for (a) data and (b) continuum data after
the final selection.
The selected events are fitted in the helicity amplitude formalism
with an unbinned maximum likelihood method using
MINUIT mini . For the process
the intensity distribution for the final state is written as
where is an incoherent background term, that is assumed to
be either a constant or to have the same angular distribution as
. The difference between these two fits is taken as the
systematic error on the background description. denotes the
Lorentz-invariant phase space, and the amplitude
where or is the helicity of the , the first pion in
each set of parentheses is the “designated” pion, and
Here , , or is the net charge of the dipion system,
and are the polar and azimuthal angles of the
in the rest frame, and
are the polar and azimuthal angles of the designated pion in the
rest frame, and describes the dependence of the
amplitude on the dipion mass :
where, is the Breit-Wigner form of the or
its excited states. Here, the Gounaris-Sakurai
parameterization gs is used; and are the
relative phase and the relative strength, respectively, between
the excited state and the .
Since the number of events is limited, the masses and the widths of all states
in the fit are fixed to their PDG values pdg , and the number of
background events is fixed to the number determined from the
invariant mass fit. A fit with , ,
and results in insignificant and
contributions. The fit after removing these two components yields a
likelihood decrease of 10.7 with four less free parameters. The fit
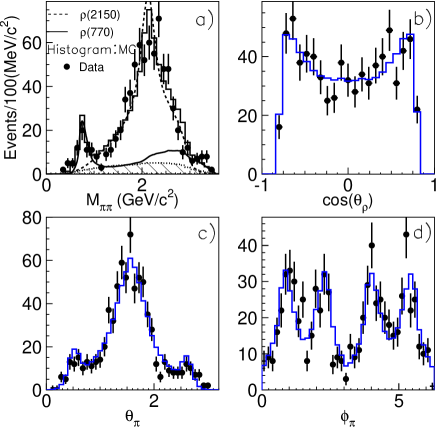
results are shown in Figure 3; the fit describes the data
reasonably well.
Figure 3: Comparison between data (dots with error bars) and
the final fit (solid histograms) for
(a) two pion invariant mass, with a solid line for the , a
dashed line for the , and a hatched histogram for
background; (b) the polar angle in the rest frame; and
(c) and (d) for the polar and azimuthal angles of the designated in
helicity frame.
The fit parameters and results are given in
Table 1, where for results without errors, the parameter is
fixed. The fit yields in all
events. By comparing the likelihood difference with and
without the in the fit, the significance of
is determined to be . The significance
of is larger than .
Table 1: fitting parameters
and results. For the numbers with no errors, the values are fixed
in the fit.
Quantity
Fit result
::
1::
The fit quality is checked using Pearson’s test by
dividing the Dalitz plots into small areas with at least 20 events
and comparing the number of events between data and normalized
Monte Carlo simulation. A ndf is obtained,
which corresponds to a confidence level of 4%. A fit with the
width free; or a fit with , ,
, and ; or even with an extra excited state
does not improve the fit quality significantly. These cases show
that the change in the number of events is less
than 9.1%, which is included as part of the systematic error. The
number of events increases by 57% when other excited
states are added in the fit due to the interference; this
is also included in the systematic error.
Using the parameters of the fit in the Monte Carlo
generator, the efficiency of is estimated to be
, and the corresponding
efficiencies for and
are and , respectively.
Systematic errors in the branching fraction
measurement come from the kinematic fit, the MDC
tracking, charged particle identification, photon identification,
background estimation, continuum subtraction, etc. All
sources considered are listed in Table 2. Most of the
errors are measured using clean exclusive
and decay samples besjpsi3pi ; besvt , while some others
were described above. For the and
, the uncertainties of fitting
with different high mass states, etc. are also
included. The total systematic error for is
10.5%, and those for and are
16.0% and %, respectively.
Table 2: Summary of systematic errors on .
Source
Relative error (%)
Trigger
0.5
MDC tracking
4.0
Kinematic fit
6.0
Photon efficiency
4.0
Number of photons
2.0
Background estimation
3.6
Particle ID
negligible
Total number of
4.0
Continuum subtraction
3.0
Total
10.5
Using the numbers obtained above, the branching fractions of
, and are
where the first errors are statistical and the
second systematic.
Our agrees with the Mark II mk2
result within , and is below
the Mark II mk2 upper limit and in agreement with one
model prediction wymphase . It should be noted that the
continuum amplitude which is considered incoherently in this
analysis could increase the branching fraction due to
interference with the resonance wymphase .
This should be considered in a higher statistics experiment.
Comparing with the corresponding decay branching
fractions, it is found that both and are
highly suppressed compared with the “12% rule”, while for
, there is no measurement in decays. It could
be enhanced in decays since the phase space in
decays is limited due to the large mass of the excited
state. It should be noted that using the and branching fractions, the branching fraction
and the cross section at
GeV can be predicted in the - and -wave mixing
model wympspp , which is proposed as a solution of the
puzzle in decays.
In summary, is observed in decays for the
first time, and the branching fraction is measured to be
. A high
mass excited state at mass around 2.15 GeV/ is also
observed with . The results may
shed light on the understanding of the longstanding “
puzzle” between and hadronic decays.
The BES collaboration thanks the staff of BEPC for their hard
efforts and the members of IHEP computing center for their helpful
assistance. This work is supported in part by the National Natural
Science Foundation of China under contracts Nos. 19991480,
10225524, 10225525, the Chinese Academy of Sciences under contract
No. KJ 95T-03, the 100 Talents Program of CAS under Contract Nos.
U-11, U-24, U-25, and the Knowledge Innovation Project of CAS
under Contract Nos. U-602, U-34 (IHEP); by the National Natural
Science Foundation of China under Contract No. 10175060 (USTC),
and No. 10225522 (Tsinghua University); and by the US Department of
Energy under Contract No. DE-FG03-94ER40833 (U Hawaii).
References
(1)T. Appelquist and H. D. Politzer,
Phys. Rev. Lett. 34, 43 (1975); A. De Rújula and
S. L. Glashow, Phys. Rev. Lett. 34, 46 (1975).
(2)M. E. B. Franklin et al. (Mark II Collab.), Phys. Rev. Lett.
51, 963 (1983).
(3) Many results may be found in Ref. pdg ;
more recent results may be found in J. Z. Bai et al., (BES
Collab.), Phys. Rev. D 69, 072001 (2004); J. Z. Bai et
al., (BES Collab.), Phys. Rev. Lett. 92, 052001 (2004); and
M. Ablikim et al., (BES Collab.), hep-ex/0407037.
(4)
W. S. Hou and A. Soni, Phys. Rev. Lett. 50, 569 (1983);
S. J. Brodsky and M. Karliner, Phys. Rev. Lett. 78, 4682
(1997); M. Chaichian and N. A. Törnqvist, Nucl. Phys. B 323, 75 (1989); S. S. Pinsky, Phys. Lett. B 236, 479
(1990); G. Karl and W. Roberts, Phys. Lett. B 144, 243
(1984); X. Q. Li, D. V. Bugg and B. S. Zou, Phys. Rev. D 55,
1421 (1997); J. M. Gérard and J. Weyers, Phys. Lett. B 462, 324 (1999); T. Feldmann and P. Kroll, Phys. Rev. D 62,
074006 (2000).
(5)P. Wang, C. Z. Yuan and X. H. Mo,
Phys. Rev. D 69, 057502 (2003).
(6)X. H. Mo et al.
High Ener. Phys. and Nucl. Phys.
27, 455 (2004), hep-ex/0407055.
(7) J. Z. Bai. et al. (BES Collab.), Nucl. Instr. Meth.
A 344, 319 (1994).
(8) J. Z. Bai. et al. (BES Collab.), Nucl. Instr.
Meth. A 458, 627 (2001).
(9) J. C. Chen et al., Phys. Rev. D
62, 034003 (2000).
(10) “GEANT: detector description and simulation tool”,
V3.21, CERN program library long writeup W5013.
Oct. 1994.
(11)P. Wang, C. Z. Yuan, X. H. Mo and D. H. Zhang,
Phys. Lett. B 593, 89 (2004).
(12)J. Z. Bai et al., (BES Collab.),
Phys. Rev. D 70, 012005 (2004).
(13) CERN Program Library Long Writeup D506
(14) S. Eidelman et al. (Particle Data Group),
Phys. Lett. B 592, 1 (2004).
(15) G. J. Gounaris and J. J. Sakurai, Phys. ReV. Lett 21, 244 (1968).
(16)J. Z. Bai et al., (BES Collab.),
Phys. Rev. D 69, 072001 (2004).
(17)P. Wang, X. H. Mo and C. Z. Yuan,
Phys. Lett. B 574, 41 (2003).