DESY 04–140 ISSN 0918–9833
A general search for new phenomena in scattering
at HERA
H1 Collaboration
A model-independent search for deviations from the Standard Model prediction is performed in and collisions at HERA using H1 data corresponding to an integrated luminosity of . For the first time all event topologies involving isolated electrons, photons, muons, neutrinos and jets with high transverse momenta are investigated in a single analysis. Events are assigned to exclusive classes according to their final state. A statistical algorithm is developed to search for deviations from the Standard Model in the distributions of the scalar sum of transverse momenta or invariant mass of final state particles and to quantify their significance. A good agreement with the Standard Model prediction is observed in most of the event classes. The most significant deviation is found for a topology containing an isolated muon, missing transverse momentum and a jet, consistent with a previously reported observation.
To be submitted to Phys. Lett. B
A. Aktas10, V. Andreev26, T. Anthonis4, A. Asmone33, A. Babaev25, S. Backovic37, J. Bähr37, P. Baranov26, E. Barrelet30, W. Bartel10, S. Baumgartner38, J. Becker39, M. Beckingham21, O. Behnke13, O. Behrendt7, A. Belousov26, Ch. Berger1, N. Berger38, T. Berndt14, J.C. Bizot28, J. Böhme10, M.-O. Boenig7, V. Boudry29, J. Bracinik27, V. Brisson28, H.-B. Bröker2, D.P. Brown10, D. Bruncko16, F.W. Büsser11, A. Bunyatyan12,36, G. Buschhorn27, L. Bystritskaya25, A.J. Campbell10, S. Caron1, F. Cassol-Brunner22, K. Cerny32, V. Chekelian27, J.G. Contreras23, Y.R. Coppens3, J.A. Coughlan5, B.E. Cox21, G. Cozzika9, J. Cvach31, J.B. Dainton18, W.D. Dau15, K. Daum35,41, B. Delcourt28, R. Demirchyan36, A. De Roeck10,44, K. Desch11, E.A. De Wolf4, C. Diaconu22, J. Dingfelder13, V. Dodonov12, A. Dubak27, C. Duprel2, G. Eckerlin10, V. Efremenko25, S. Egli34, R. Eichler34, F. Eisele13, M. Ellerbrock13, E. Elsen10, M. Erdmann10,42, W. Erdmann38, P.J.W. Faulkner3, L. Favart4, A. Fedotov25, R. Felst10, J. Ferencei10, M. Fleischer10, P. Fleischmann10, Y.H. Fleming10, G. Flucke10, G. Flügge2, A. Fomenko26, I. Foresti39, J. Formánek32, G. Franke10, G. Frising1, E. Gabathuler18, K. Gabathuler34, E. Garutti10, J. Garvey3, J. Gayler10, R. Gerhards10,†, C. Gerlich13, S. Ghazaryan36, S. Ginzburgskaya25, L. Goerlich6, N. Gogitidze26, S. Gorbounov37, C. Grab38, H. Grässler2, T. Greenshaw18, M. Gregori19, G. Grindhammer27, C. Gwilliam21, D. Haidt10, L. Hajduk6, J. Haller13, M. Hansson20, G. Heinzelmann11, R.C.W. Henderson17, H. Henschel37, O. Henshaw3, G. Herrera24, I. Herynek31, R.-D. Heuer11, M. Hildebrandt34, K.H. Hiller37, P. Höting2, D. Hoffmann22, R. Horisberger34, A. Hovhannisyan36, M. Ibbotson21, M. Ismail21, M. Jacquet28, L. Janauschek27, X. Janssen10, V. Jemanov11, L. Jönsson20, D.P. Johnson4, H. Jung20,10, D. Kant19, M. Kapichine8, M. Karlsson20, J. Katzy10, N. Keller39, J. Kennedy18, I.R. Kenyon3, C. Kiesling27, M. Klein37, C. Kleinwort10, T. Klimkovich10, T. Kluge1, G. Knies10, A. Knutsson20, B. Koblitz27, V. Korbel10, P. Kostka37, R. Koutouev12, A. Kropivnitskaya25, J. Kroseberg39, K. Krüger14, J. Kückens10, T. Kuhr10, M.P.J. Landon19, W. Lange37, T. Laštovička37,32, P. Laycock18, A. Lebedev26, B. Leißner1, R. Lemrani10, V. Lendermann14, S. Levonian10, L. Lindfeld39, K. Lipka37, B. List38, E. Lobodzinska37,6, N. Loktionova26, R. Lopez-Fernandez10, V. Lubimov25, H. Lueders11, D. Lüke7,10, T. Lux11, L. Lytkin12, A. Makankine8, N. Malden21, E. Malinovski26, S. Mangano38, P. Marage4, J. Marks13, R. Marshall21, M. Martisikova10, H.-U. Martyn1, S.J. Maxfield18, D. Meer38, A. Mehta18, K. Meier14, A.B. Meyer11, H. Meyer35, J. Meyer10, S. Mikocki6, I. Milcewicz-Mika6, D. Milstead18, A. Mohamed18, F. Moreau29, A. Morozov8, I. Morozov8, J.V. Morris5, M.U. Mozer13, K. Müller39, P. Murín16,43, V. Nagovizin25, K. Nankov10, B. Naroska11, J. Naumann7, Th. Naumann37, P.R. Newman3, C. Niebuhr10, A. Nikiforov27, D. Nikitin8, G. Nowak6, M. Nozicka32, R. Oganezov36, B. Olivier10, J.E. Olsson10, G.Ossoskov8, D. Ozerov25, A. Paramonov25, C. Pascaud28, G.D. Patel18, M. Peez29, E. Perez9, A. Perieanu10, A. Petrukhin25, D. Pitzl10, R. Plačakytė27, R. Pöschl10, B. Portheault28, B. Povh12, N. Raicevic37, P. Reimer31, B. Reisert27, A. Rimmer18, C. Risler27, E. Rizvi3, P. Robmann39, B. Roland4, R. Roosen4, A. Rostovtsev25, Z. Rurikova27, S. Rusakov26, K. Rybicki6,†, D.P.C. Sankey5, E. Sauvan22, S. Schätzel13, J. Scheins10, F.-P. Schilling10, P. Schleper10, S. Schmidt27, S. Schmitt39, M. Schneider22, L. Schoeffel9, A. Schöning38, V. Schröder10, H.-C. Schultz-Coulon14, C. Schwanenberger10, K. Sedlák31, F. Sefkow10, I. Sheviakov26, L.N. Shtarkov26, Y. Sirois29, T. Sloan17, P. Smirnov26, Y. Soloviev26, D. South10, V. Spaskov8, A. Specka29, H. Spitzer11, R. Stamen10, B. Stella33, J. Stiewe14, I. Strauch10, U. Straumann39, V. Tchoulakov8, G. Thompson19, P.D. Thompson3, F. Tomasz14, D. Traynor19, P. Truöl39, G. Tsipolitis10,40, I. Tsurin37, J. Turnau6, E. Tzamariudaki27, A. Uraev25, M. Urban39, A. Usik26, D. Utkin25, S. Valkár32, A. Valkárová32, C. Vallée22, P. Van Mechelen4, N. Van Remortel4, A. Vargas Trevino7, Y. Vazdik26, C. Veelken18, A. Vest1, S. Vinokurova10, V. Volchinski36, K. Wacker7, J. Wagner10, G. Weber11, R. Weber38, D. Wegener7, C. Werner13, N. Werner39, M. Wessels1, B. Wessling11, G.-G. Winter10, Ch. Wissing7, E.-E. Woehrling3, R. Wolf13, E. Wünsch10, S. Xella39, W. Yan10, V. Yeganov36, J. Žáček32, J. Zálešák31, Z. Zhang28, A. Zhelezov25, A. Zhokin25, H. Zohrabyan36, and F. Zomer28
1 I. Physikalisches Institut der RWTH, Aachen, Germanya
2 III. Physikalisches Institut der RWTH, Aachen, Germanya
3 School of Physics and Astronomy, University of Birmingham,
Birmingham, UKb
4 Inter-University Institute for High Energies ULB-VUB, Brussels;
Universiteit Antwerpen, Antwerpen; Belgiumc
5 Rutherford Appleton Laboratory, Chilton, Didcot, UKb
6 Institute for Nuclear Physics, Cracow, Polandd
7 Institut für Physik, Universität Dortmund, Dortmund, Germanya
8 Joint Institute for Nuclear Research, Dubna, Russia
9 CEA, DSM/DAPNIA, CE-Saclay, Gif-sur-Yvette, France
10 DESY, Hamburg, Germany
11 Institut für Experimentalphysik, Universität Hamburg,
Hamburg, Germanya
12 Max-Planck-Institut für Kernphysik, Heidelberg, Germany
13 Physikalisches Institut, Universität Heidelberg,
Heidelberg, Germanya
14 Kirchhoff-Institut für Physik, Universität Heidelberg,
Heidelberg, Germanya
15 Institut für experimentelle und Angewandte Physik, Universität
Kiel, Kiel, Germany
16 Institute of Experimental Physics, Slovak Academy of
Sciences, Košice, Slovak Republice,f
17 Department of Physics, University of Lancaster,
Lancaster, UKb
18 Department of Physics, University of Liverpool,
Liverpool, UKb
19 Queen Mary and Westfield College, London, UKb
20 Physics Department, University of Lund,
Lund, Swedeng
21 Physics Department, University of Manchester,
Manchester, UKb
22 CPPM, CNRS/IN2P3 - Univ Mediterranee,
Marseille - France
23 Departamento de Fisica Aplicada,
CINVESTAV, Mérida, Yucatán, Méxicok
24 Departamento de Fisica, CINVESTAV, Méxicok
25 Institute for Theoretical and Experimental Physics,
Moscow, Russial
26 Lebedev Physical Institute, Moscow, Russiae
27 Max-Planck-Institut für Physik, München, Germany
28 LAL, Université de Paris-Sud, IN2P3-CNRS,
Orsay, France
29 LLR, Ecole Polytechnique, IN2P3-CNRS, Palaiseau, France
30 LPNHE, Universités Paris VI and VII, IN2P3-CNRS,
Paris, France
31 Institute of Physics, Academy of
Sciences of the Czech Republic, Praha, Czech Republice,i
32 Faculty of Mathematics and Physics, Charles University,
Praha, Czech Republice,i
33 Dipartimento di Fisica Università di Roma Tre
and INFN Roma 3, Roma, Italy
34 Paul Scherrer Institut, Villigen, Switzerland
35 Fachbereich Physik, Bergische Universität Gesamthochschule
Wuppertal, Wuppertal, Germany
36 Yerevan Physics Institute, Yerevan, Armenia
37 DESY, Zeuthen, Germany
38 Institut für Teilchenphysik, ETH, Zürich, Switzerlandj
39 Physik-Institut der Universität Zürich, Zürich, Switzerlandj
40 Also at Physics Department, National Technical University,
Zografou Campus, GR-15773 Athens, Greece
41 Also at Rechenzentrum, Bergische Universität Gesamthochschule
Wuppertal, Germany
42 Also at Institut für Experimentelle Kernphysik,
Universität Karlsruhe, Karlsruhe, Germany
43 Also at University of P.J. Šafárik,
Košice, Slovak Republic
44 Also at CERN, Geneva, Switzerland
† Deceased
a Supported by the Bundesministerium für Bildung und Forschung, FRG,
under contract numbers 05 H1 1GUA /1, 05 H1 1PAA /1, 05 H1 1PAB /9,
05 H1 1PEA /6, 05 H1 1VHA /7 and 05 H1 1VHB /5
b Supported by the UK Particle Physics and Astronomy Research
Council, and formerly by the UK Science and Engineering Research
Council
c Supported by FNRS-FWO-Vlaanderen, IISN-IIKW and IWT
and by Interuniversity Attraction Poles Programme,
Belgian Science Policy
d Partially Supported by the Polish State Committee for Scientific
Research, SPUB/DESY/P003/DZ 118/2003/2005
e Supported by the Deutsche Forschungsgemeinschaft
f Supported by VEGA SR grant no. 2/1169/2001
g Supported by the Swedish Natural Science Research Council
i Supported by the Ministry of Education of the Czech Republic
under the projects INGO-LA116/2000 and LN00A006, by
GAUK grant no 173/2000
j Supported by the Swiss National Science Foundation
k Supported by CONACYT,
México, grant 400073-F
l Partially Supported by Russian Foundation
for Basic Research, grant no. 00-15-96584
1 Introduction
At HERA electrons111 In this paper “electrons” refers to both electrons and positrons, if not otherwise stated. and protons collide at a centre-of-mass energy of up to GeV. These high-energy electron-proton interactions provide a testing ground for the Standard Model (SM) complementary to and scattering. It is widely believed that the SM is incomplete and that new physics signals may appear below energies of TeV. Many extensions to the SM have been constructed during the last decades predicting various phenomena which may be visible at high energies or large transverse momenta (). HERA data have been used to test some of these models of new processes by analysing their anticipated experimental signatures and limits on their parameters have been derived [1].
The approach described in this paper consists of a comprehensive and generic search for deviations from the SM prediction at large transverse momenta. All high final state configurations involving electrons (), muons (), jets (), photons () or neutrinos () are systematically investigated. The analysis covers phase space regions where the SM prediction is sufficiently precise to detect anomalies and does not rely on assumptions concerning the characteristics of any SM extension. Such a model-independent approach might discover unexpected manifestations of new physics. Therefore it addresses the important question of whether evidence for new physics might still be hidden in the data recorded at collider experiments. A similar strategy for a model-independent search was previously presented in [2].
All final states containing at least two objects (, , , , ) with GeV in the polar angle222 The origin of the H1 coordinate system is the nominal interaction point, with the direction of the proton beam defining the positive -axis (forward region). The transverse momenta are measured in the plane. The pseudorapidity is related to the polar angle by . range are investigated. The complete HERA I data sample ( – ) is used, corresponding to an integrated luminosity of pb-1. All selected events are classified into exclusive event classes according to the number and types of objects detected in the final state (e.g. -, --, ----). These exclusive event classes ensure a clear separation of final states and allow an unambiguous statistical interpretation of deviations. All experimentally accessible combinations of objects have been studied and data events are found in of them.
In a first analysis step the global event yields of the event classes are compared with the SM expectation. The distributions of the invariant mass and of the scalar sum of transverse momenta of high final state objects are presented. New physics may be visible as an excess or a deficit in one of these distributions. Therefore, in a second step these distributions are systematically investigated using a dedicated algorithm which locates the region with the largest deviation of the data from the SM prediction. The probability of occurrence of such a deviation is derived, both for each event class individually and globally for all classes combined.
This paper is organised as follows. Section describes the Standard Model processes at HERA and their Monte Carlo simulation. The H1 detector, the event selection and measurement procedure are described in section . The event yields and distributions for each event class are presented in section . The search strategy and results are explained in section . Section summarises the paper.
2 Standard Model processes and Monte Carlo generation
Several Monte Carlo event generators are combined to simulate events for all SM processes which have large cross sections or are expected to be dominant for specific event classes, avoiding double-counting. All processes are generated with an integrated luminosity significantly higher than that of the data sample and events are passed through a full detector simulation [3]. At high transverse momenta the dominant SM processes are the photoproduction of two jets and neutral current (NC) deep-inelastic scattering (DIS). In the following the abbreviation represents all reaction products other than the high objects considered.
Photoproduction of jets and photons
To simulate the direct and resolved photoproduction of jets , prompt photon production and the resolved photoproduction of photon pairs , the PYTHIA event generator [4] is used. Light and heavy flavoured jets are generated. The simulation contains the Born level hard scattering matrix elements and radiative QED corrections.
Neutral current deep-inelastic scattering
The Born, QCD Compton and Boson Gluon Fusion matrix elements are used in the RAPGAP [5] event generator to model NC DIS events. The QED radiative effects arising from real photon emission from both the incoming and the outgoing electrons are simulated using the HERACLES [6] generator. Hence the NC DIS prediction contains the processes , and also models final states with an additional radiated photon.
Charged current deep-inelastic scattering
Charged current (CC) DIS events are simulated using the DJANGO [7] program, which includes first order QED radiative corrections based on HERACLES. This prediction contributes to the final states , and to final states with an additional radiated photon.
QED Compton scattering
Elastic and quasi-elastic Compton processes are simulated with the WABGEN [9] generator. The inelastic contribution is already included in the NC DIS RAPGAP sample.
Electroweak production of lepton pairs
Multi-lepton events (, , ) are generated with the GRAPE [10] program, which includes all electroweak matrix elements at tree level. Multi-lepton production via , , collisions, internal photon conversion and the decay of virtual or real bosons is considered. Initial and final state QED radiation is included. The complete hadronic final state is obtained via interfaces to PYTHIA and SOPHIA [11] for the inelastic and quasi-elastic regimes, respectively.
W production
Processes with the production of three or more jets, e.g. or , are accounted for using leading logarithmic parton showers as a representation of higher order QCD radiation, with the exception of CC DIS, where the colour-dipole model [8] is used. Hadronisation is modelled using Lund string fragmentation [4]. The prediction of processes with two or more high transverse momentum jets, e.g. , , is scaled by a factor of to normalise the leading order Monte Carlos to next-to-leading order QCD calculations [15].
3 Experimental technique
3.1 The H1 detector
The H1 detector [16] components relevant to the present analysis are briefly described here. Jets, photons and electrons are measured with the Liquid Argon (LAr) calorimeter [17], which covers the polar angle range with full azimuthal acceptance. Electromagnetic shower energies are measured with a precision of and hadronic energies with , as measured in test beams. The central and forward tracking detectors are used to measure charged particle trajectories, to reconstruct the interaction vertex and to supplement the measurement of the hadronic energy. The innermost proportional chamber CIP () is used to veto charged particles for the identification of photons. The LAr and inner tracking detectors are enclosed in a super-conducting magnetic coil with a strength of T. The return yoke of the coil is the outermost part of the detector and is equipped with streamer tubes forming the central muon detector (). It is also used to supplement the measurement of hadrons. In the forward region of the detector () a set of drift chamber layers (the forward muon system) detects muons and, together with an iron toroidal magnet, allows a momentum measurement. The luminosity measurement is based on the Bethe-Heitler process , where the photon is detected in a calorimeter located downstream of the interaction point.
The main trigger for events with high transverse momentum is provided by the LAr calorimeter. The trigger efficiency is close to for events having an electromagnetic deposit in the LAr (electron or photon) with transverse momentum greater than GeV [19]. Events triggered only by jets have a trigger efficiency above for GeV and nearly for GeV [20]. For events with missing transverse momentum above 20 GeV, determined from an imbalance in the transverse momentum measured in the calorimeter, the trigger efficiency is . The muon trigger is based on single muon signatures from the central muon detector, which are combined with signals from the central tracking detector. The trigger efficiency for di-muon events is about [21].
3.2 Event selection
At HERA electrons or positrons with an energy of GeV collide with protons at an energy of GeV resulting in a centre-of-mass energy of = GeV. Before the proton energy was GeV resulting in a centre-of-mass energy of = GeV. The event sample studied consists of the full – HERA I data set. It corresponds to an integrated luminosity of in scattering at GeV and in scattering and in scattering at GeV.
The data selection requires at least one isolated electromagnetic cluster, jet or muon to be found in the detector acceptance. Energy deposits in the calorimeters and tracks in the inner tracking system are used to form combined cluster-track objects, from which the hadronic energy is reconstructed. To reduce background it is demanded that the event vertex be reconstructed within cm in of the nominal position333 This is not required for the event classes containing only photons or photons and a neutrino. and that GeV, where is the particle energy and is the component of the particle momentum. Here, the index runs over all hadronic energy deposits, electromagnetic clusters and muons found in the event. Due to energy-momentum conservation events are expected to have a value of GeV, twice the electron beam energy, if only longitudinal momentum along the proton beam direction is unmeasured. Events with topologies typical of cosmic ray and beam-induced background are rejected [22]. Moreover, the timing of the event is required to coincide with that of the bunch crossing.
The identification criteria for each type of particle are based on those applied in previous analyses of specific final states [15, 19, 21, 23]. Additional requirements are chosen to ensure an unambiguous identification of particles, whilst retaining high efficiencies. The following paragraphs describe the identification criteria for the different objects and give the identification efficiencies for the kinematic region considered in the analysis.
Electron identification
The electron identification is based on the measurement of a compact and isolated electromagnetic shower in the LAr calorimeter. The hadronic energy within a distance in the pseudorapidity-azimuth () plane around the electron is required to be below of the electron energy. This calorimetric electron identification is complemented by tracking conditions. A high quality track is required to geometrically match the electromagnetic cluster within a distance of closest approach to the cluster centre-of-gravity of cm. No other good track is allowed within around the electron direction. In the central region () the distance between the first measured point in the central drift chambers and the beam axis is required to be below cm in order to reject photons that convert late in the central tracker material. In addition, the transverse momentum measured from the associated track is required to match the calorimetric measurement with GeV-1. In the region not fully covered by the central drift chambers () a wider isolation cone of is required to reduce the contribution of fake electrons from hadrons. In this forward region the identification is completed by the requirement of associated hits in the CIP, which reduces the contamination from neutral particles showering in the material of the forward region. The resulting electron finding efficiency is % in the central region and in the forward region.
Photon identification
The photon identification relies on the measurement of an electromagnetic shower and on the same calorimetric isolation criteria against hadrons as for the electron identification. In addition, photons are required to be separated from jets with GeV by a distance of to the jet axis. Vetoes are applied on any charged track pointing to the electromagnetic cluster. No track should be present with a distance of closest approach to the cluster below cm or within . An additional veto on any hits in the CIP is applied. The resulting photon identification efficiency as derived using elastic QED Compton events is .
Muon identification
The muon identification is based on a track in the forward muon system or in the inner tracking systems associated with a track segment or an energy deposit in the central muon detector [23]. The muon momentum is measured from the track curvature in the toroidal or solenoidal magnetic fields. A muon candidate should have no more than GeV deposited in the LAr calorimeter in a cylinder of radius in () space, centred on the muon track direction. In di-muon events, the requirement of an opening angle between the two muons smaller than discards cosmic ray background. Beam halo muons are rejected by requiring that the muons originate from the event vertex. Finally, misidentified hadrons are almost completely suppressed by requiring that the muon candidate is separated from the closest jet with GeV by . The efficiency to identify muons is greater than [23].
Jet identification
Jets are defined using the inclusive algorithm [24, 25]. The algorithm is applied in the laboratory frame with a separation parameter of and using a weighted recombination scheme [24] in which the jets are treated as massless. The jet algorithm is run on all combined cluster-track objects not previously identified as electron or photon candidates. The scattered electron may fake a jet. This effect is important for multi-jet events, especially at high transverse momenta. To reject these fake jets, the first radial moment of the jet transverse energy [26, 27] is required to be greater than and the quantity must be greater than [15, 27]. The invariant mass is obtained using the four-vector of all objects belonging to the jet. If the fraction of the jet energy contained in the electromagnetic part of the LAr calorimeter is greater than , the above criteria are tightened to and , respectively. The jet selection efficiency is .
Neutrino identification
A neutrino candidate is defined in events with missing transverse momentum above GeV. The missing momentum is derived from all identified particles and energy deposits in the event. Fake missing transverse momentum may also arise from the mismeasurement of an identified object. This effect is reduced by requiring that the neutrino444 The four-vector of the neutrino is calculated under the assumption GeV. be isolated from all identified objects with a transverse momentum above GeV. Requiring GeV discards neutrino candidates from NC processes where the missing transverse momentum is caused by energy leakage in the forward region. If exactly one electron or muon object is found, a neutrino object is only assigned to an event if , where is the separation in azimuthal angle between the lepton and the direction of the system built of all hadronic energies.
Event classification
The common phase space for electrons, photons, muons and jets is defined by and GeV. The neutrino phase space is defined by missing transverse momentum above GeV and GeV. These values are chosen to retain a high selection and trigger efficiency. All particles with GeV, including the neutrino defined by its reconstructed four-vector, are required to be isolated compared with each other by a minimum distance of one unit in the plane. The events are classified, depending on the number and types of objects, into exclusive event classes. Events with an isolated calorimetric object in the considered phase space which is not identified as a photon, electron or jet are discarded from the analysis in order to minimise wrong classifications.
Based on these identification criteria, purities can be derived for each event class with a sizeable SM expectation. Purity is defined as the ratio of SM events reconstructed in the event class in which they are generated to the total number of reconstructed events in this class. Most purities are found to be above and they are close to for the -, -, - and - event classes.
3.3 Systematic uncertainties
This section describes the sources of experimental and theoretical systematic uncertainties considered. Experimental systematic uncertainties arising from the measurement of the objects are listed in table 1 (for more details see [20, 27, 28]).
-
•
The electromagnetic energy scale uncertainty varies between and depending on the particle’s impact point on the LAr calorimeter surface [19]. The polar angular measurement uncertainty of electromagnetic clusters varies depending on between and mrad [19]. The identification of electron and photon candidates depends on the tracking efficiency, which is known with a precision ranging from for polar angles above to in the forward region.
-
•
The hadronic energy scale of the LAr calorimeter is known to . The uncertainty on the jet polar angle determination is mrad for and mrad for .
-
•
The uncertainty on the transverse momentum measurement for muons amounts to . The uncertainty on the polar angle is mrad. The muon identification efficiency is known with a precision of 5%.
-
•
The trigger uncertainties for each class are determined by the object with the highest trigger efficiency. The uncertainty on the trigger efficiency is estimated to be if the event is triggered by a jet or missing transverse momentum and if it is triggered by a muon. For electrons and photons the uncertainty on the trigger efficiency is negligible.
-
•
The uncertainty in the integrated luminosity results in an overall normalisation error of .
-
•
The uncertainty in the reconstruction of and the missing for the neutrino classification are obtained by propagation of the systematic errors for other objects.
Depending on the generator level production process, different theoretical uncertainties are used as listed in table 2. The errors attributed to the predictions for , , , , , and production include uncertainties in the parton distribution functions and those due to missing higher order corrections [15, 23, 27, 28]. The error attributed to and results mainly from the limited knowledge of the proton structure [21, 29]. The error on the QED Compton cross section is estimated to be % for elastic and 10% for inelastic production. An additional theoretical error of is applied for each jet produced by parton shower processes (e.g. 20% for the -- event class). An uncertainty of is added to the prediction for NC DIS events with missing transverse momentum above GeV and a high electron. This uncertainty is estimated by a comparison of the missing transverse momentum distribution between NC DIS events with a low electron ( GeV) and the SM prediction.
All systematic errors are added in quadrature and are assigned to the SM predictions. For example, the resulting total uncertainties for - events are and at low and high invariant mass , respectively. In the - event class the errors are typically and reach for and values around GeV.
4 Event yields
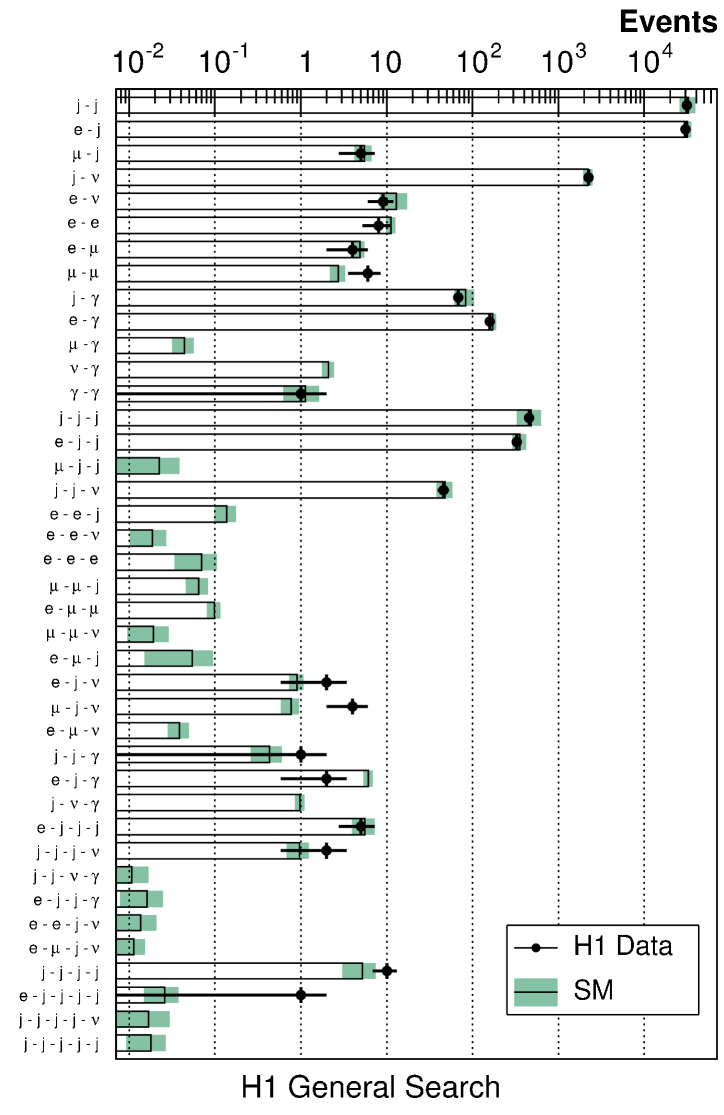
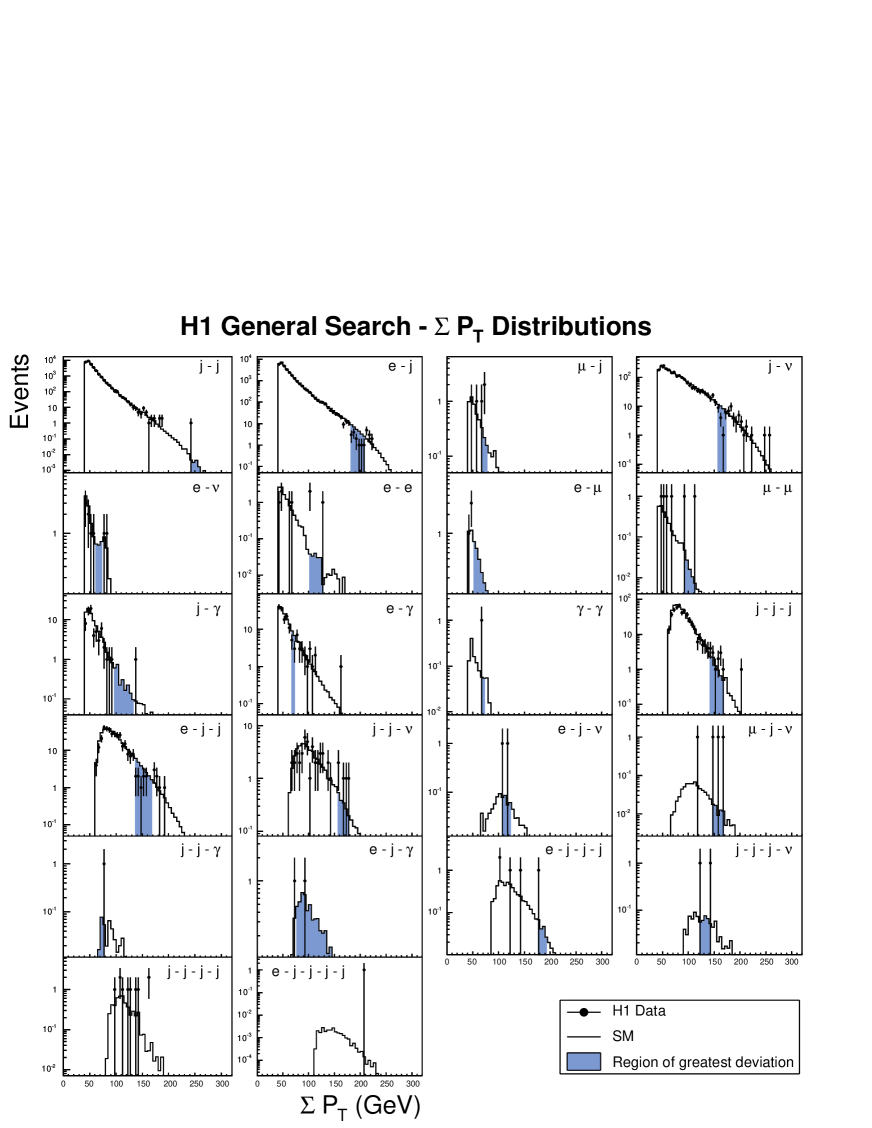
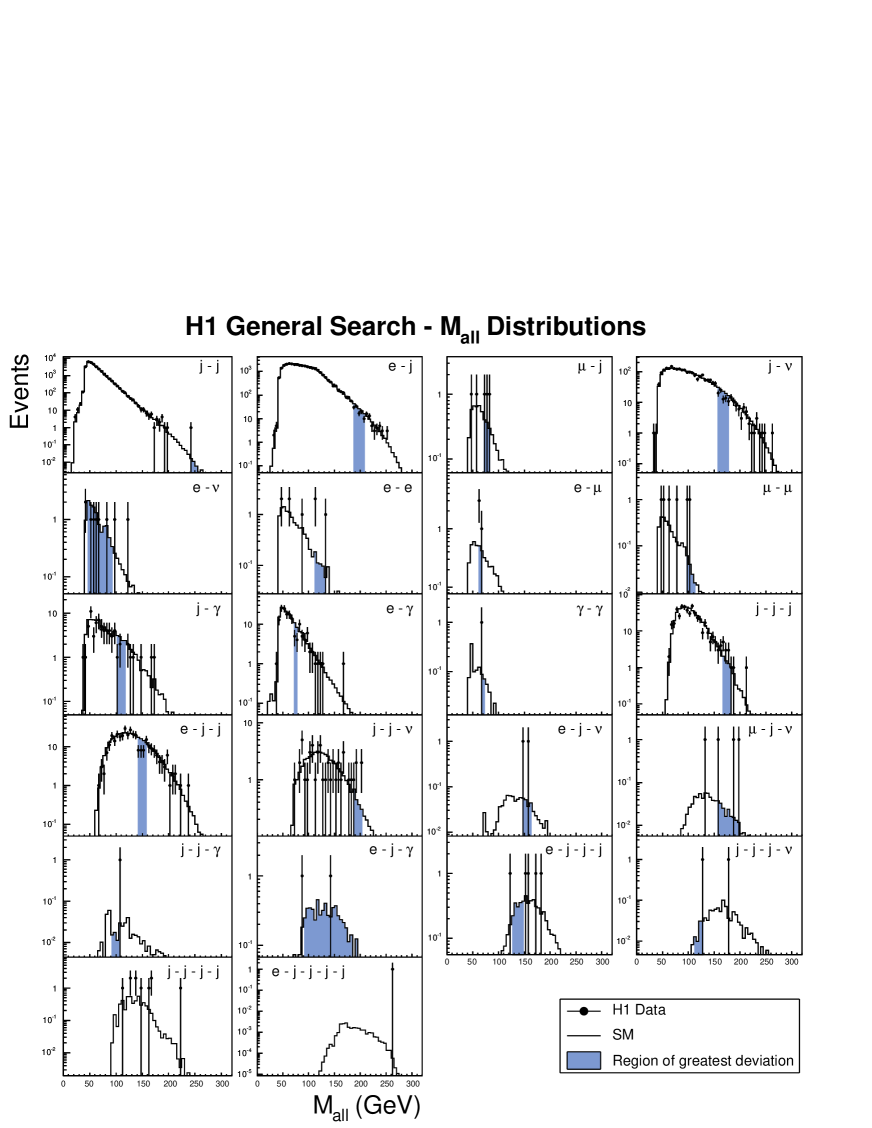
All possible event classes with at least two objects are investigated555The - event class is discarded from the present analysis. It is dominated by low transverse energy photoproduction events in which a poorly reconstructed muon gives rise to missing transverse momentum, which fakes the neutrino signature.. The event yields subdivided into event classes are presented for the data and SM expectation in figure 1. All event classes with a SM expectation greater than events are shown. No other event class contains data events. The distributions of the scalar sum of transverse momenta and of the invariant mass of all objects are presented in figures 2 and 3 for classes with at least one event.
The dominant high processes at HERA, i.e. photoproduction of jets, NC and CC DIS, dominate in the -, - and - event classes, respectively. Events are observed with and values as large as GeV. A good description of the data spectra by the prediction is observed. The prediction for the event classes -- and -- is dominated by photoproduction and NC DIS processes with the radiation of a photon, respectively. There is good agreement between the data and the prediction. No event is observed in the radiative CC classes - and --, consistent with the expectation of and , respectively. The --, --, ---, -- and --- event classes correspond to processes with additional jet production due to higher order QCD radiation. The yields of these event classes are also well described by the SM prediction.
The - event class is dominated by QED Compton scattering processes and and values up to GeV are measured. A good agreement with the SM is observed. The prompt photon - event class extends up to GeV and is well described by the prediction. The purity in this class is moderate () due to the high background from misidentified electrons in NC DIS. Backgrounds where hadrons are misidentified as photons are small. One event is observed in the - event class for an expectation of 1.1 0.5, which is dominated by the process, where the electron is misidentified. Contributions of higher order QED processes, which could lead to two high transverse momentum photons, are negligible.
Lepton pair production from processes dominates in event classes with several leptons. The - event class contains events for an expectation of . In this channel, a discrepancy with the SM expectation was previously reported for high masses by the H1 collaboration [29]. All multi-electron events mentioned in [29] and located in the phase space of this analysis are found. In the region GeV, events are observed and are expected. The higher SM prediction compared with the prediction of in [29] is due to the extended polar angle range in the forward region. This leads to an additional background events from fake electrons and events from the processes. The -- class contains no events. None of the tri-electron events of [29] are selected here due to the requirement of high transverse momentum. The predictions for the - and - event classes are dominated by muon pair production from two-photon reactions. The - event class is populated if the scattered electron and only one of the muons are selected. In the - class, events are observed compared with an expectation of . A slight excess is observed in the - event class where events are found and are expected. Muon pair production processes also contribute in the - event class, where a good agreement is found. In the -, - and - event classes the and values of the data lie between and GeV.
The prediction for the event classes -- and -- consists mainly of high production with a subsequent leptonic decay. A discrepancy between the data and the SM expectation is observed in the -- event class, where events are observed for an expectation of . The values reach GeV and the values GeV. In this event class less than background events are expected from the photoproduction of jets via QCD processes. Such a deviation was previously reported in [23] and will be further discussed in Section 5. In the -- event class data events are observed for an expectation of . Some of the -- events mentioned in [23] have an electron with a transverse momentum below GeV and are therefore not selected as -- events in the present analysis. The event topology - is also expected to contain events arising from production together with background from NC DIS. In the - event class, data events are observed compared with an expectation of .
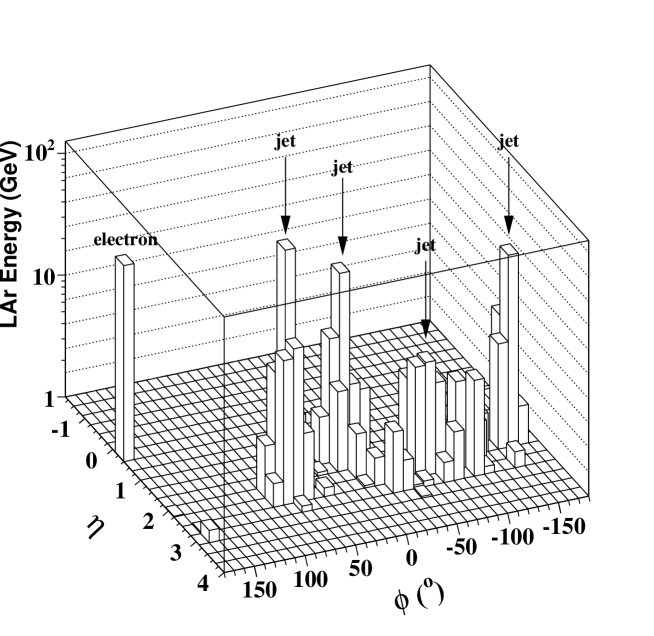
A slight excess of the data compared with the prediction is observed in the --- event class, with data events observed and expected. One event is observed in the ---- event class, to be compared with an expectation of . This event has a of GeV and an invariant mass of GeV. The NC DIS expectation for GeV is as derived using RAPGAP. The energy flow of the event in the view is presented in figure 4. The NC DIS and photoproduction SM predictions have been tested using a sample of --- events with GeV and ---- events with GeV and GeV. An adequate description of the and distributions of the data is obtained within the quoted SM uncertainties. Since the NC DIS prediction for GeV is only of order 0.001 fb, rare SM processes not considered in this analysis such as pair production may be dominant in this kinematic domain.
No events are found in any other event class, in agreement with the SM expectation (see figure 1).
5 Search for deviations from the Standard Model
5.1 Search algorithm and strategy
In order to quantify the level of agreement between the data and the SM expectation and to identify regions of possible deviations, a new search algorithm is developed. Detailed studies have shown that and have a large sensitivity to new physics (see appendix and [28]). The algorithm described in the following locates the region of largest deviation of the data from the SM in these distributions. The calculation of the significance of this deviation is inspired by [2].
Definition of regions
A region in the and distributions is defined as a set of connected histogram bins666 In order to minimise binning effects, a bin size smaller than or comparable with the resolution of the studied quantity is used. A 5 GeV bin size is used for all distributions. Further reduction of the bin size has a negligible effect on the results. with a size of at least twice the resolution. All possible regions of any width and at any position in the histograms are considered. The number of data events (), the SM expectation () and its total systematic uncertainty () are calculated for each region.
Determination of the most interesting region
A statistical estimator is defined to judge which region is of most interest. This estimator is derived from the convolution of the Poisson probability density function (pdf) to account for statistical errors with a Gaussian pdf, , with mean and width , to include the effect of non negligible systematic uncertainties. The estimator is defined via
The factor ensures normalisation to unity. If is replaced by a Dirac delta function the estimator becomes the usual Poisson probability. The value of gives an estimate of the probability of a fluctuation of the SM expectation upwards (downwards) to at least (at most) the observed number of data events in the region considered. The region of greatest deviation is the region having the smallest -value, . Such a method is able to find narrow resonances and single outstanding events as well as signals spread over large regions of phase space in distributions of any shape [28].
Significance per event class
The probability that a fluctuation with a -value at least as small as occurs anywhere in the distribution is estimated using the following method. Many independent hypothetical data histograms are made by filling each bin with an event number diced according to the pdfs of the SM expectation (again a convolution of Poisson and Gaussian pdfs). For each of these hypothetical data histograms the algorithm is run to find the region of greatest deviation and the corresponding is calculated. The probability is then defined as the fraction of hypothetical data histograms with a equal to or smaller than the value obtained from the data. is a measure of the statistical significance of the deviation observed in the data. If the event classes are exclusive, the values can be used to compare the results of different event classes. Depending on the final state, a -value of (“”) corresponds to a value of between and .
Global significance
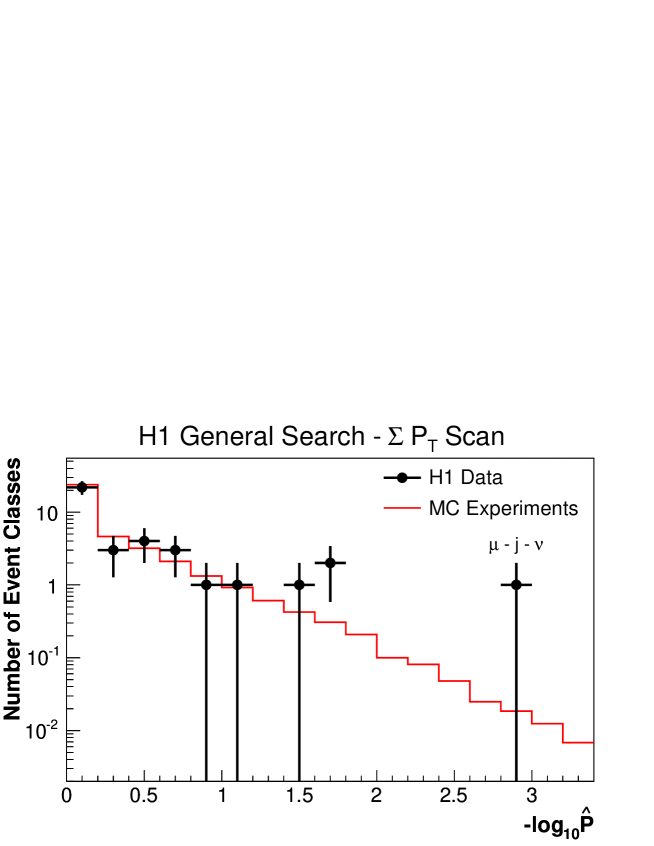
The overall degree of agreement with the SM can be further quantified by taking into account the large number of event classes studied in this analysis. The probability of observing an event class with a given value or smaller can be calculated with Monte Carlo (MC) experiments. A MC experiment is defined as a set of hypothetical data histograms (either in or in ) following the SM expectation with an integrated luminosity of 117 pb-1, on which the complete search algorithm and statistical analysis are applied as for data. This procedure is repeated many times. The expectation for the values observed in the data is then given by the distribution of values obtained from all MC experiments. The probability to find a value smaller than the minimum observed in the data can thus be calculated and quantifies the global significance of the observed deviation.
5.2 Search results
The final values obtained for event classes having at least one observed event are summarised in table 3. The regions selected by the algorithm are presented in figures 2 and 3.
The most significant deviation of the analysis is found in the -- event class. This class has values of () and (). The mass region ( GeV) contains data events for an expectation of . In the chosen region ( GeV) three data events are found while only are expected. This event topology was studied in [23] where this deviation at high was already reported.
A value of is found in the - event class in a region at high transverse momenta, GeV where 3 events are observed for an expectation of . The deviation is less prominent in the region selected in the invariant mass distribution due to a higher background from NC DIS events. This corresponds to the excess of data events also identified in [29].
A deficit is observed in the - event class in the distribution in the region GeV. For a SM expectation of only data events are observed. The derived value is .
Due to the uncertainties in the SM prediction in the --- and ---- event classes at the highest and , where data events are observed (see section 4), no reliable values can be calculated for these classes. Consequently, these event classes are not taken into account to determine the overall degree of agreement between the data and the SM.
The values for event classes with no data event observed and a small SM expectation are . This remains the case if an additional contribution is added from a possible further rare process not included here. Such classes can thus be considered in the calculation of the global significance.
The values observed in the data in all event classes are compared in figure 5 with the distribution of obtained from the large set of MC experiments, normalised to one experiment. The comparison is presented for the scans of the and distributions. Most values lie above , corresponding to event classes where no significant discrepancy between the data and the SM expectation is observed. The global probabilities to find at least one class with a value smaller than the observation in the -- channel are % and % for the and distributions, respectively (see appendix for details).
To test the dependence of the analysis on the a priori defined cuts, the whole analysis is repeated with two other object cuts. The cut was raised to GeV for all objects and lowered to GeV. In the latter case it was still required that at least one object has a larger than GeV in order to maintain a high trigger efficiency. The analysis was also repeated separately on the and data samples. In these four test scenarios a similar overall agreement with the SM is observed. The -- event class remains the one with the smallest value in the scenario with a lowered cut in the data sample and no new discrepancy is observed. When raising the cut to GeV, it is mainly the two particle event classes containing jets that are still populated and the largest deviation is observed in the - class with = .
6 Conclusions
The data collected with the H1 experiment during the years – (HERA I) have been investigated in a search for deviations from the SM prediction at high transverse momentum. For the first time all event topologies involving isolated electrons, photons, muons, neutrinos and jets are investigated in a single analysis. A good agreement between the data and the SM expectation is found in most event classes. A better knowledge of rare processes may be required to search for deviations from the SM in final states with four jets at the highest invariant mass or transverse momentum. The distributions in the invariant mass and scalar sum of transverse momenta of the particles in each event class have been systematically searched for deviations using a statistical algorithm. The most significant deviation is found in the -- event class, a topology where deviations have also been previously reported. About () of hypothetical Monte Carlo experiments would produce a deviation in at least one event class which is more significant than that observed in the corresponding sum of transverse momenta (invariant mass) distribution of the topology with a jet, a muon and a neutrino.
Acknowledgements
We are grateful to the HERA machine group whose outstanding efforts have made this experiment possible. We thank the engineers and technicians for their work in constructing and now maintaining the H1 detector, our funding agencies for financial support, the DESY technical staff for continual assistance and the DESY directorate for support and for the hospitality which they extend to the non DESY members of the collaboration. We wish to thank B. Knuteson for useful discussions.
Appendix
Signals for new physics may appear either as a single deviation or a small set of deviations. The following outlines how a significant deviation might be defined and presents tests of the sensitivity of this analysis to specific signals for new physics.
The probability to observe in the data a greater than in at least event classes is given by the fraction of MC experiments having at least event classes with a . The values obtained for this analysis are presented in table 4. Up to event classes are considered. Since very similar values are found for the and distributions, averaged values are presented. For example, a value smaller than , which might be considered to represent a significant deviation, could be obtained from one event class with a , two event classes with a or three event classes with a . It was found that one of these cases occurs either in or in around of all MC experiments.
A set of pseudo data samples has been produced to test the sensitivity of the analysis procedure to some dedicated signals for new physics. The prediction of a specific model for new physics is added to the SM prediction and this new total prediction is used to generate pseudo data samples. Again a Monte Carlo technique is used to vary the distribution of signal events and generate many MC experiments. The complete algorithm is run on those MC experiments and the mean value of in all of them is derived as a measure of sensitivity of this analysis.
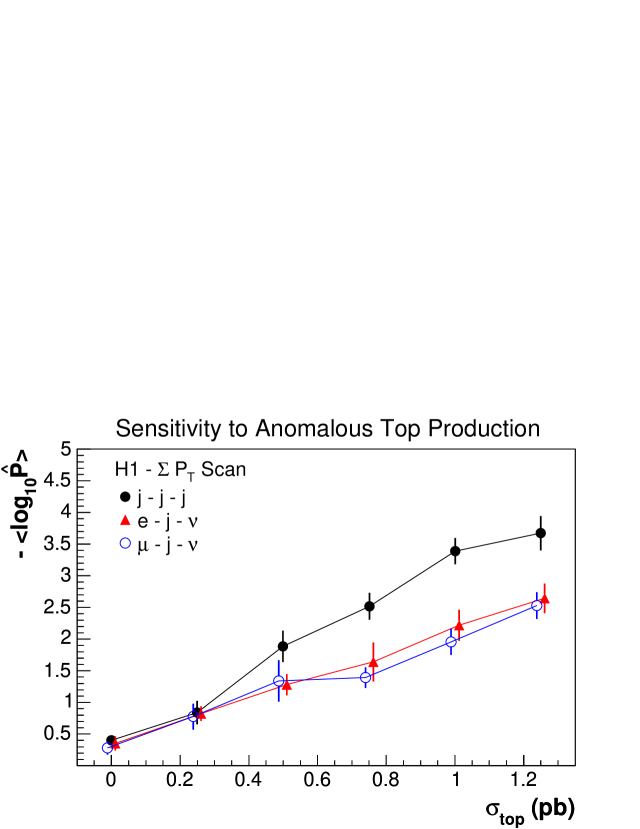
The exotic production of top quarks via a flavour-changing neutral current is first investigated. The decay with subsequent leptonic and hadronic decays has been considered. The values obtained are displayed in figure 6 (top) as a function of the cross section for producing a top when the proton beam energy is 920 GeV. Whereas is around if no signal is present, the value increases if a top is produced. In the -- event class a of is obtained for a cross-section of pb. This value can be compared with the % confidence level exclusion limit on the top production cross section at pb already derived by the H1 experiment using the hadronic top decay channel only [30]. A deviation with three event classes with a would be found in this example for pb.
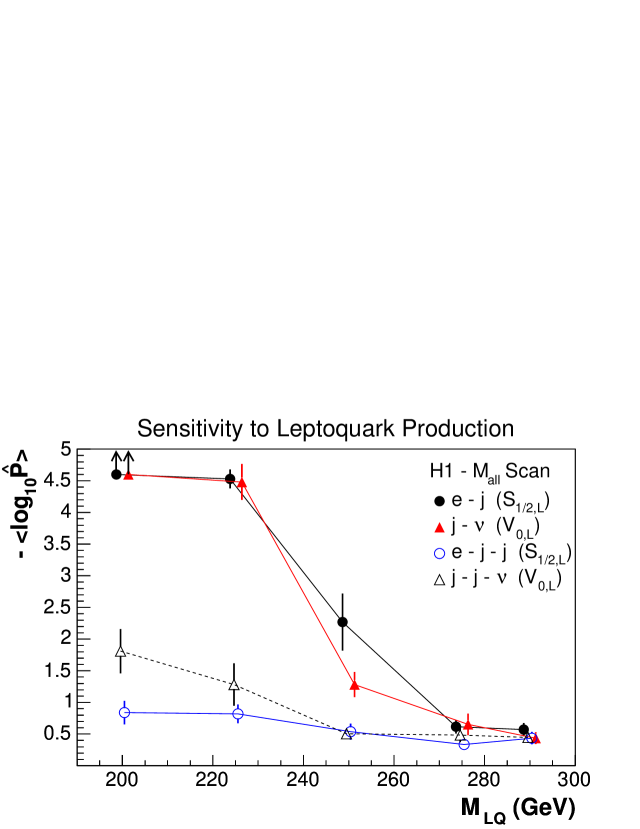
The second test concerns the production of leptoquarks (LQs) [31]. and type leptoquarks have been considered, which would mainly manifest themselves in the - and - channels. A coupling of has been assumed and the sensitivity of the present analysis was tested for various LQ masses. The values obtained from searches in the distributions are summarised in figure 6 (bottom), for both the and LQ appearing in the - and -- as well as the - and -- channels, respectively. This analysis is sensitive to both types of leptoquarks up to masses of GeV. These values can be compared with % confidence level limits of GeV for LQs and GeV for LQs, determined by dedicated analyses [32]. As for the case of single top production, the general search is thus found to have a sensitivity to leptoquark production which is comparable with that of dedicated searches.
References
- [1] M. Kuze and Y. Sirois, Prog. Part. Nucl. Phys. 50 (2003) 1 [hep-ex/0211048].
-
[2]
B. Abbott et al. [D0 Collaboration],
Phys. Rev. D 62 (2000) 092004
[hep-ex/0006011].
B. Abbott et al. [D0 Collaboration], Phys. Rev. D 64 (2001) 012004 [hep-ex/0011067]. - [3] R. Brun, F. Bruyant, M. Maire, A. C. McPherson and P. Zanarini, CERN-DD/EE/84-1.
-
[4]
T. Sjöstrand et al.,
Comput. Phys. Commun. 135 (2001) 238
[hep-ph/0010017].
(The PARP(67) parameter was set to 4 instead of its default value of 1). - [5] H. Jung, Comput. Phys. Commun. 86 (1995) 147.
- [6] A. Kwiatkowski, H. Spiesberger and H. J. Möhring, Comput. Phys. Commun. 69 (1992) 155.
- [7] G. A. Schuler and H. Spiesberger, “Django: The Interface for The Event Generators Heracles and Lepto”.
- [8] L. Lönnblad, Comput. Phys. Commun. 71 (1992) 15.
- [9] C. Berger and P. Kandel, Prepared for Workshop on Monte Carlo Generators for HERA Physics Hamburg, Germany, 27-30 Apr 1998.
- [10] T. Abe, Comput. Phys. Commun. 136 (2001) 126 [hep-ph/0012029].
- [11] A. Mucke et al., Comput. Phys. Commun. 124 (2000) 290 [astro-ph/9903478].
- [12] U. Baur, J. A. Vermaseren and D. Zeppenfeld, Nucl. Phys. B 375 (1992) 3.
- [13] K. P. Diener, C. Schwanenberger and M. Spira, Eur. Phys. J. C 25 (2002) 405 [hep-ph/0203269].
- [14] K. P. Diener, C. Schwanenberger and M. Spira, [hep-ex/0302040].
- [15] C. Adloff et al. [H1 Collaboration], Eur. Phys. J. C 25 (2002) 13 [hep-ex/0201006].
-
[16]
I. Abt et al. [H1 Collaboration],
Nucl. Instrum. Meth. A 386 (1997) 348;
I. Abt et al. [H1 Collaboration], Nucl. Instrum. Meth. A 386 (1997) 310. - [17] B. Andrieu et al. [H1 Calorimeter Group Collaboration], Nucl. Instrum. Meth. A 336 (1993) 460.
- [18] R. D. Appuhn et al. [H1 SPACAL Group Collaboration], Nucl. Instrum. Meth. A 386 (1997) 397.
- [19] C. Adloff et al. [H1 Collaboration], Eur. Phys. J. C 30, 1 (2003) [hep-ex/0304003].
- [20] M. Peez, “Recherche de déviations au Model Standard dans les processus de grande énergie transverse sur le collisionneur électron - proton HERA”, Ph.D. thesis, Université de Lyon (2003), DESY-THESIS-2003-023. (available at http://www-h1.desy.de/psfiles/theses/).
- [21] A. Aktas et al. [H1 Collaboration], Phys. Lett. B 583 (2004) 28 [hep-ex/0311015].
- [22] Z. Zhang, Habilitation Thesis, LAL preprint, LAL 00-57 (2000) [hep-ph/0012249].
- [23] V. Andreev et al. [H1 Collaboration], Phys. Lett. B 561 (2003) 241 [hep-ex/0301030].
- [24] S. D. Ellis and D. E. Soper, Phys. Rev. D 48 (1993) 3160 [hep-ph/9305266].
- [25] S. Catani, Y. L. Dokshitzer, M. H. Seymour and B. R. Webber, Nucl. Phys. B 406 (1993) 187.
- [26] W. T. Giele, E. W. N. Glover and D. A. Kosower, Phys. Rev. D 57 (1998) 1878 [hep-ph/9706210].
- [27] G. Frising, “Rare Phenomena and production in Electron-Proton Scattering at HERA”, Ph.D. thesis, RWTH Aachen (2003) (available at http://www-h1.desy.de/psfiles/theses/).
- [28] M. Wessels, “General Search for New Phenomena in ep Scattering at HERA”, Ph.D. thesis, RWTH Aachen (2004) (available at http://www-h1.desy.de/psfiles/theses/).
- [29] A. Aktas et al. [H1 Collaboration], Eur. Phys. J. C 31 (2003) 17 [hep-ex/0307015].
- [30] A. Aktas et al. [H1 Collaboration], Eur. Phys. J. C 33, 9 (2004) [hep-ex/0310032].
- [31] C. Adloff et al. [H1 Collaboration], Eur. Phys. J. C 11 (1999) 447 [Erratum-ibid. C 14 (2000) 553] [hep-ex/9907002].
- [32] S. Chekanov et al. [ZEUS Collaboration], Phys. Rev. D 68 (2003) 052004 [hep-ex/0304008].
| Object | Energy Scale | Identification | |
|---|---|---|---|
| (mrad) | efficiency | ||
| Jet | 2% | 5–10 | – |
| Electron | 0.7–3% | 1–3 | 2–7% |
| Photon | 0.7–3% | 1–3 | 2–7% |
| Muon | 5% | 3 | 5% |
| Process | Uncertainty |
|---|---|
| and | 15% |
| and | 10% |
| and | 15% |
| and | 3% |
| and | 15% |
| and | 10% |
| 5% |
| event class | ||||||||||||
|---|---|---|---|---|---|---|---|---|---|---|---|---|
| - | 0.38 | 1 | 0.035 | 0.017 | 0.036 | 0.12 | 1 | 0.013 | 0.006 | 0.013 | ||
| - | 0.94 | 111 | 139 | 21 | 0.12 | 0.021 | 12 | 31.2 | 5.1 | 0.0028 | ||
| - | 0.67 | 3 | 1.07 | 0.25 | 0.098 | 0.29 | 3 | 0.70 | 0.23 | 0.040 | ||
| - | 0.34 | 83 | 116 | 14 | 0.028 | 0.22 | 20 | 36.7 | 6.2 | 0.023 | ||
| - | 0.94 | 5 | 10.6 | 4.4 | 0.17 | 0.77 | 0 | 2.1 | 0.8 | 0.17 | ||
| - | 0.32 | 3 | 0.56 | 0.17 | 0.023 | 0.019 | 3 | 0.18 | 0.08 | 0.0013 | ||
| - | 0.21 | 4 | 0.93 | 0.12 | 0.016 | 0.56 | 0 | 2.6 | 0.5 | 0.080 | ||
| - | 0.069 | 2 | 0.14 | 0.04 | 0.010 | 0.036 | 2 | 0.11 | 0.03 | 0.0060 | ||
| - | 0.52 | 3 | 10.8 | 3.7 | 0.052 | 0.77 | 0 | 2.5 | 1.0 | 0.13 | ||
| - | 0.38 | 9 | 19.2 | 2.0 | 0.014 | 0.64 | 8 | 15.7 | 1.9 | 0.040 | ||
| - | 0.47 | 1 | 0.16 | 0.09 | 0.15 | 0.31 | 1 | 0.11 | 0.09 | 0.12 | ||
| -- | 0.41 | 12 | 5.9 | 2.0 | 0.050 | 0.58 | 14 | 7.8 | 2.5 | 0.077 | ||
| -- | 0.69 | 39 | 59.6 | 10.7 | 0.058 | 0.085 | 9 | 23.9 | 4.4 | 0.0072 | ||
| -- | 0.62 | 5 | 1.79 | 0.41 | 0.043 | 0.51 | 5 | 1.74 | 0.45 | 0.040 | ||
| -- | 0.090 | 2 | 0.19 | 0.05 | 0.016 | 0.16 | 2 | 0.28 | 0.06 | 0.034 | ||
| -- | 3 | 0.19 | 0.05 | 0.0011 | 3 | 0.068 | 0.029 | |||||
| -- | 0.27 | 1 | 0.074 | 0.048 | 0.076 | 0.36 | 1 | 0.15 | 0.10 | 0.15 | ||
| -- | 0.47 | 1 | 5.7 | 1.6 | 0.050 | 0.39 | 1 | 5.6 | 1.4 | 0.045 | ||
| --- | 0.98 | 0 | 1.6 | 0.5 | 0.23 | 0.87 | 1 | 0.18 | 0.06 | 0.17 | ||
| --- | 0.33 | 1 | 0.084 | 0.045 | 0.083 | 0.20 | 2 | 0.31 | 0.14 | 0.044 | ||
| 1 | 95% | 65% | 28% | 9% | 3% | 0.9% | 0.2% | 0.1% | 0.05% |
|---|---|---|---|---|---|---|---|---|---|
| 2 | 79% | 28% | 4% | 0.6% | 0.1% | 0.05% | — | — | — |
| 3 | 53% | 8% | 0.4% | 0.05% | 0.05% | — | — | — | — |