A new limit of T-violating transverse muon polarization in the
decay
Abstract
A search for T-violating transverse muon polarization () in the decay was performed using kaon decays at rest. A new improved value, , was obtained giving an upper limit, . The T-violation parameter was determined to be Im giving an upper limit, Im.
pacs:
11.30.Er, 12.60.Fr, 13.20.Eb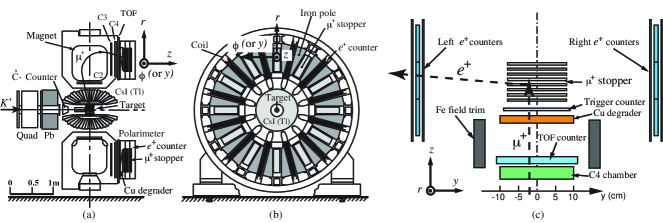
The transverse muon polarization, , in the () decay is one of the observables of CP violation beyond the standard model (SM). CP violation in general is a subject of continuing interest in and meson decays. , defined as the polarization component perpendicular to the decay plane, is an obvious signature of a violation of time reversal (T) invariance, since the spurious effect from final state interactions is very small () zhi . is almost vanishing () in the SM with the Kobayashi-Maskawa scheme san ; it is therefore a very sensitive probe of CP violation mechanisms beyond the SM and new physics along with physics such as and some other decays bdc . Models bel such as those with multi-Higgs doublets or leptoquarks, or some SUSY may to give rise to as large as .
At the High Energy Accelerator Research Organization (KEK) the E246 collaboration has been performing a search for in . In 1999, the first result was published abe based on good events from the data taken during 1996 and 1997, indicating no evidence for T violation. Further runs provided a cumulative data sample with three times more events. This Letter constitutes our final result from all the data with an improved analysis. The present result supersedes all our earlier reports.
The principle of the experiment was the same as described before abe . A kaon beam with an average intensity of /s was produced at the 12 GeV proton synchrotron from protons per spill of 0.7 s duration with a 2.7 s repetition time. The detector setup (Fig.1) using stopped kaons at a 12-sector magnet is described in detail in mac . The muon polarization consists of three components a) longitudinal, parallel to the muon momentum , b) normal, normal to in the decay plane, and c) transverse, perpendicular to the decay plane. was searched for as the azimuthal polarization ( or component in Fig.1) of emitted radially (in the direction) and stopped in the Al stoppers when a was tagged in the forward () or the backward () direction relative to the detector axis. The spin depolarization during flight and in the stopper was estimated to be negligible. This azimuthal polarization was measured as an asymmetry between clockwise () and counter-clockwise () emitted Michel , and . Summation over the twelve sectors with 12-fold azimuthal symmetry played an important role in reducing systematic errors. Events from and s have opposite asymmetries. We exploit this feature to double the signal and also as a powerful means to cancel the systematic errors.
The total data were grouped into three periods of (I) 1996-1997, (II) 1998, and (III) 1999-2000, each having nearly the same beam conditions and amount of data. As was described in abe , two completely independent analyses, A1 and A2, pursued their own best off-line event selections with their own analysis policies. This approach provided a cross-check of the quality of selected events and also an estimate of the systematic errors in the analysis. Basic event selection criteria were same in both analyses. The ’s were identified not only as two photons (2) but also as one photon (1) with energy 70 MeV. The maximum sensitivity to is provided by the and regions of (2) or photons (1) with , where is the polar angle corrected for muon direction. Slight differences between the two analyses led to a non-negligible amount of uncommon good events in each analysis. All the selected events were categorized into the common () events and two sets of uncommon events ( and ) separately for 2 and 1. In total 6.3 million and 5.5 million good events were obtained for 2 and 1, respectively. The fraction of 2 and 1 mismatch events between A1 and A2 was only 1.5% and these were rejected. The positron yield was extracted from the time spectra by integrating from 20 ns to 6.0 s after subtraction of the constant background deduced from fitting between 6.0 s to 19.5 s. The only significant background to muon stopping and its decay was due to decay in flight from ; its contamination effect was estimated and included in the systematic errors.
In abe the T-violating asymmetry was calculated as , where for the - () region, using the total positron and counts. Then, was calculated as using an average analyzing power and the angular attenuation factor with being the angle of decay plane normal vector relative to the axis. However, this method is prone to a systematic error due to potentially different muon stopping distributions of and events. To obtain a finite stopping efficiency, muon stoppers with finite size in the and directions were employed. A geometrical asymmetry appears for muons at off center which, in turn, can induce a fake if the muon stopping distribution is different between and events, in particular in the direction. In the current analysis an exact treatment, in which we use the muon stopping point from the C4 tracking chamber located just in front of the stopper, was employed. For the direction an integration was used because the change of geometrical asymmetry is much smaller (about 1/10 of -dependence), and because its determination from tracking was poor. The transverse polarization for each data set was evaluated as the average of contribution from each part of the stopper using the C4 coordinate as;
| (1) |
where is the weight function proportional to (here, is the error distribution) and normalized to 1, and is
| (2) |
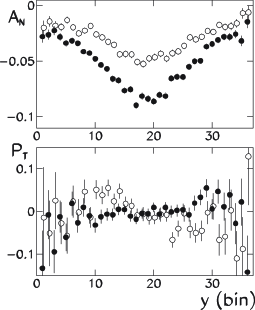
with the -dependent asymmetry and analyzing power . The definition of assured that it was free from the geometrical asymmetry and from muon stopping densities, and canceled the systematic errors common for /. Here, and were calculated as . The dependence of analyzing power could be calibrated using the positron asymmetry associated with the normal polarization as is proportional to . was measured by rearranging the and events into and categories of directions, and calculating . This has a maximum at the center of the stopper (Fig.2). The absolute value of was calibrated by a Monte Carlo simulation as . The coefficient included the effects of intrinsic muon decay asymmetry, muon spin precession around the field, positron interactions, and the finite counter solid angle. The obtained function corresponded to , which is significantly higher than our previous estimate of abe deduced as and thus less reliable. thus obtained in Eq.(1) is regarded as the average value of distribution in the finite kinematical acceptance of in the stopper. The validity of applying the proportionality relation in Eq.(2) was carefully checked under the actual trigger condition. In order to increase the statistical accuracy of , of all the data sets was summed since is only dependent on and should not depend significantly on the data set. In the actual analysis, the averaging of and bins was used because the shape of should be symmetric in the first order approximation also in the presence of the magnetic field. Fig.2 shows thus calculated which is nearly constant with slight but opposite-sign gradients for 2 and 1. This is due to different muon stopping distributions along the direction for and events with an opposite tendency of for and due to kimematics. was calculated, for the integration Eq.(1), by summation over the 36 bins from cm to +9.0 cm. The effect of the -origin gradients is eliminated since the effect cancels between and , and the distribution is symmetric. The average values of , weighted by the statistical significance of respective , were 0.007mm and 0.020 mm for and , respectively. These small ’s confirm an excellent C4/stopper alignment and justify this analysis. The factor was evaluated for each data set by using a Monte Carlo calculation taking into account realistic background conditions, to be typically 0.7 and 0.6 for and , respectively.
| Data category | I(1996-1997) | II(1998) | III(1999-2000) |
|---|---|---|---|
| 2 [A1 A2] | |||
| 2 [ A2] | |||
| 2 [A1 ] | |||
| 1 [A1 A2] | |||
| 1 [ A2] | |||
| 1 [A1 ] |
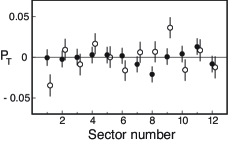
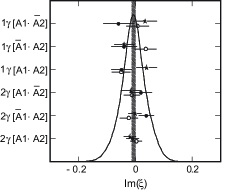
Data quality checks were performed for the 18 data sets of the 3 groups with 6 data categories each. First the null asymmetry was calculated as the asymmetry of all the and events added, using the total and counts integrated over and it was confirmed that there was no significant bias. Next, were compared. Although there was a slight difference among the 1 data sets due to different cut criteria of the event selection we decided to use all the 1 data. Then the distribution of decay plane normal with its and components abe was studied to check for any possible kinematical phase space distortions, and no significant offsets were found. Finally, the 18 values (Table I) which are consistent with each other (a fit to a constant gives , where is the degree of freedom), yielded the average of being consistent with zero. The sector dependence of is plotted in Fig.3 with for 2 data and for 1 data showing that the latter is slightly inferior. The ’s were converted to the T-violating physics parameter Im cab with the conversion coefficients and 0.287 for 2 and 1, respectively, deduced from a Monte Carlo simulation abe . The ideogram of Im (Fig.4) shows that there is significant overlap among the different data sets. The average is found to be . It is noteworthy that the analysis by the previous method gives consistent central values of and Im.
Although almost all the systematics were canceled due to the summation of the 12 sectors and the double ratio between and events, a few errors remain giving rise to spurious or a small admixture of resulting in a spurious effect (Table II). The contribution of misalignments of detector elements and the muon spin rotation field remained as in abe . The small mean values of and were treated as an error. The effect of muon multiple scattering through the Cu degrader may cause a difference in the actual muon stopping distribution of and , in particular in the distribution even for a measured at C4, producing a spurious through the geometrical asymmetry along . This effect, inadvertently omitted in our previous analysis, was carefully estimated in the present analysis to be . The small effect due to gradients and finite values was treated as a systematic error () and included in the item “Analysis” together with other analysis uncertainties abe . The total systematic error was calculated as the quadratic sum of all the contributions resulting in which is much smaller than the statistical error.
| Source | |
| counter misalignment | 2.9 |
| Misalignments of other counters | 2.6 |
| Misalignment of field on the stopper | 6.1 |
| stopping distribution | |
| Decay plane rotations ( and | 1.4 |
| multiple scattering | 7.1 |
| Backgrounds (including decay from ) | |
| Analysis (including gradients) | 4.0 |
| Total |
In conclusion, we obtained the values of and with no indication of T violation. The 90% confidence limits are given as and Im by adding statistical and systematic errors quadratically. This result is a factor 3 improvement over the last BNL-AGS experiment mor and it may constrain the lightest Higgs mass and/or other parameters in the framework of non-SM models bel better than or complementary to the neutron electric dipole moment and meson decays. For example, our result gives a stronger constraint to the three Higgs doublet model than the similar semileptonic decay btn and implies in one of the multi-Higgs models (bel Garisto and Kane) that the down quark contribution to should be more than a factor 10 less than the current experimental limit of cm; our Im 90% limit corresponds to cm.
This work was supported in Japan by a Grant-in-Aid from the Ministry of Education, Science, Sports and Culture, and by JSPS; in Russia by the Ministry of Science and Technology, and by the Russian Foundation for Basic Research; in Canada by NSERC and IPP, and by infrastructure of TRIUMF provided under its NRC contribution; in Korea by BSRI-MOE and KOSEF; and in the U.S.A. by NSF and DOE. The authors thank K. Nakai, K. Nakamura, S. Iwata, S. Yamada, M. Kobayashi, H. Sugawara, V.A. Matveev and V.M. Lobashev for encouragement in executing the present work. They also gratefully acknowledge the excellent support received from the KEK staff.
References
- (1) Deceased.
- (2) A.R. Zhitnitskii, Yad. Fiz. 31, 1024 (1980) [Sov. J. Nucl. Phys. 31, 529 (1980)]; V.P. Efrosinin et al., Phys. Letters B493, 293 (2000).
- (3) I.I. Bigi and A.I. Sanda, CP Violation (Cambridge University Press, 2000); E. Golowich and G. Valencia, Phys. Rev. D40, 112 (1989).
- (4) See, for example, T. Hurth, Rev. Mod. Phys. 75, 1159 (2003) [hep-ph/0212304]; Y. Grossman, Int. J. Mod. Phys. A19, 907 (2004) [hep-ph/0310229].
- (5) R. Garisto and G. Kane, Phys. Rev. D44, 2038 (1991); G. Bélanger and C.Q. Geng, Phys. Rev. D44, 2789 (1991); M. Kobayashi, T.-T. Lin, and Y. Okada, Prog. Theor. Phys. 95, 361 (1995); M. Fabbrichesi and F. Vissani, Phys. Rev. D55, 5334 (1997); G.-H. Wu and J.N. Ng, Phys. Lett. B392, 93 (1997).
- (6) M. Abe et al., Phys. Rev. Letters 83, 4253 (1999).
- (7) J.A. Macdonald et al., Nucl. Instr. Method A506, 60 (2003).
- (8) N. Cabibbo and A. Maksymowicz, Phys. Lett. 9, 352 (1964); 11, 360(E) (1964); 14, 72(E) (1966).
- (9) S.R. Blatt et al., Phys. Rev. D27, 1056 (1983).
- (10) Particle Data Group, Phys. Letters B592, 1 (2004); Y. Grossman, Nucl. Phys. B426, 355 (1994).