BABAR-CONF-04/20
SLAC-PUB-10610
August 2004
Measurement of the Branching Fractions for the Decays , , and
The BABAR Collaboration
Abstract
The meson decay modes , and are studied in a sample of pairs collected with the BABAR detector at the PEP-II collider. The decay of is observed for the first time, with a measured branching fraction . The following branching fractions are also determined: , , and . In each decay mode the invariant mass spectra of the charmed mesons and the baryons are compared with a pure phase-space hypothesis in order to gain insight into the meson decay dynamics. In particular, the Dalitz plots of versus for and of versus for are presented. All results are preliminary.
Submitted to the 32nd International Conference on High-Energy Physics, ICHEP 04,
16 August—22 August 2004, Beijing, China
Stanford Linear Accelerator Center, Stanford University, Stanford, CA 94309
Work supported in part by Department of Energy contract DE-AC03-76SF00515.
The BABAR Collaboration,
B. Aubert, R. Barate, D. Boutigny, F. Couderc, J.-M. Gaillard, A. Hicheur, Y. Karyotakis, J. P. Lees, V. Tisserand, A. Zghiche
Laboratoire de Physique des Particules, F-74941 Annecy-le-Vieux, France
A. Palano, A. Pompili
Università di Bari, Dipartimento di Fisica and INFN, I-70126 Bari, Italy
J. C. Chen, N. D. Qi, G. Rong, P. Wang, Y. S. Zhu
Institute of High Energy Physics, Beijing 100039, China
G. Eigen, I. Ofte, B. Stugu
University of Bergen, Inst. of Physics, N-5007 Bergen, Norway
G. S. Abrams, A. W. Borgland, A. B. Breon, D. N. Brown, J. Button-Shafer, R. N. Cahn, E. Charles, C. T. Day, M. S. Gill, A. V. Gritsan, Y. Groysman, R. G. Jacobsen, R. W. Kadel, J. Kadyk, L. T. Kerth, Yu. G. Kolomensky, G. Kukartsev, G. Lynch, L. M. Mir, P. J. Oddone, T. J. Orimoto, M. Pripstein, N. A. Roe, M. T. Ronan, V. G. Shelkov, W. A. Wenzel
Lawrence Berkeley National Laboratory and University of California, Berkeley, CA 94720, USA
M. Barrett, K. E. Ford, T. J. Harrison, A. J. Hart, C. M. Hawkes, S. E. Morgan, A. T. Watson
University of Birmingham, Birmingham, B15 2TT, United Kingdom
M. Fritsch, K. Goetzen, T. Held, H. Koch, B. Lewandowski, M. Pelizaeus, M. Steinke
Ruhr Universität Bochum, Institut für Experimentalphysik 1, D-44780 Bochum, Germany
J. T. Boyd, N. Chevalier, W. N. Cottingham, M. P. Kelly, T. E. Latham, F. F. Wilson
University of Bristol, Bristol BS8 1TL, United Kingdom
T. Cuhadar-Donszelmann, C. Hearty, N. S. Knecht, T. S. Mattison, J. A. McKenna, D. Thiessen
University of British Columbia, Vancouver, BC, Canada V6T 1Z1
A. Khan, P. Kyberd, L. Teodorescu
Brunel University, Uxbridge, Middlesex UB8 3PH, United Kingdom
A. E. Blinov, V. E. Blinov, V. P. Druzhinin, V. B. Golubev, V. N. Ivanchenko, E. A. Kravchenko, A. P. Onuchin, S. I. Serednyakov, Yu. I. Skovpen, E. P. Solodov, A. N. Yushkov
Budker Institute of Nuclear Physics, Novosibirsk 630090, Russia
D. Best, M. Bruinsma, M. Chao, I. Eschrich, D. Kirkby, A. J. Lankford, M. Mandelkern, R. K. Mommsen, W. Roethel, D. P. Stoker
University of California at Irvine, Irvine, CA 92697, USA
C. Buchanan, B. L. Hartfiel
University of California at Los Angeles, Los Angeles, CA 90024, USA
S. D. Foulkes, J. W. Gary, B. C. Shen, K. Wang
University of California at Riverside, Riverside, CA 92521, USA
D. del Re, H. K. Hadavand, E. J. Hill, D. B. MacFarlane, H. P. Paar, Sh. Rahatlou, V. Sharma
University of California at San Diego, La Jolla, CA 92093, USA
J. W. Berryhill, C. Campagnari, B. Dahmes, O. Long, A. Lu, M. A. Mazur, J. D. Richman, W. Verkerke
University of California at Santa Barbara, Santa Barbara, CA 93106, USA
T. W. Beck, A. M. Eisner, C. A. Heusch, J. Kroseberg, W. S. Lockman, G. Nesom, T. Schalk, B. A. Schumm, A. Seiden, P. Spradlin, D. C. Williams, M. G. Wilson
University of California at Santa Cruz, Institute for Particle Physics, Santa Cruz, CA 95064, USA
J. Albert, E. Chen, G. P. Dubois-Felsmann, A. Dvoretskii, D. G. Hitlin, I. Narsky, T. Piatenko, F. C. Porter, A. Ryd, A. Samuel, S. Yang
California Institute of Technology, Pasadena, CA 91125, USA
S. Jayatilleke, G. Mancinelli, B. T. Meadows, M. D. Sokoloff
University of Cincinnati, Cincinnati, OH 45221, USA
T. Abe, F. Blanc, P. Bloom, S. Chen, W. T. Ford, U. Nauenberg, A. Olivas, P. Rankin, J. G. Smith, J. Zhang, L. Zhang
University of Colorado, Boulder, CO 80309, USA
A. Chen, J. L. Harton, A. Soffer, W. H. Toki, R. J. Wilson, Q. Zeng
Colorado State University, Fort Collins, CO 80523, USA
D. Altenburg, T. Brandt, J. Brose, M. Dickopp, E. Feltresi, A. Hauke, H. M. Lacker, R. Müller-Pfefferkorn, R. Nogowski, S. Otto, A. Petzold, J. Schubert, K. R. Schubert, R. Schwierz, B. Spaan, J. E. Sundermann
Technische Universität Dresden, Institut für Kern- und Teilchenphysik, D-01062 Dresden, Germany
D. Bernard, G. R. Bonneaud, F. Brochard, P. Grenier, S. Schrenk, Ch. Thiebaux, G. Vasileiadis, M. Verderi
Ecole Polytechnique, LLR, F-91128 Palaiseau, France
D. J. Bard, P. J. Clark, D. Lavin, F. Muheim, S. Playfer, Y. Xie
University of Edinburgh, Edinburgh EH9 3JZ, United Kingdom
M. Andreotti, V. Azzolini, D. Bettoni, C. Bozzi, R. Calabrese, G. Cibinetto, E. Luppi, M. Negrini, L. Piemontese, A. Sarti
Università di Ferrara, Dipartimento di Fisica and INFN, I-44100 Ferrara, Italy
E. Treadwell
Florida A&M University, Tallahassee, FL 32307, USA
F. Anulli, R. Baldini-Ferroli, A. Calcaterra, R. de Sangro, G. Finocchiaro, P. Patteri, I. M. Peruzzi, M. Piccolo, A. Zallo
Laboratori Nazionali di Frascati dell’INFN, I-00044 Frascati, Italy
A. Buzzo, R. Capra, R. Contri, G. Crosetti, M. Lo Vetere, M. Macri, M. R. Monge, S. Passaggio, C. Patrignani, E. Robutti, A. Santroni, S. Tosi
Università di Genova, Dipartimento di Fisica and INFN, I-16146 Genova, Italy
S. Bailey, G. Brandenburg, K. S. Chaisanguanthum, M. Morii, E. Won
Harvard University, Cambridge, MA 02138, USA
R. S. Dubitzky, U. Langenegger
Universität Heidelberg, Physikalisches Institut, Philosophenweg 12, D-69120 Heidelberg, Germany
W. Bhimji, D. A. Bowerman, P. D. Dauncey, U. Egede, J. R. Gaillard, G. W. Morton, J. A. Nash, M. B. Nikolich, G. P. Taylor
Imperial College London, London, SW7 2AZ, United Kingdom
M. J. Charles, G. J. Grenier, U. Mallik
University of Iowa, Iowa City, IA 52242, USA
J. Cochran, H. B. Crawley, J. Lamsa, W. T. Meyer, S. Prell, E. I. Rosenberg, A. E. Rubin, J. Yi
Iowa State University, Ames, IA 50011-3160, USA
M. Biasini, R. Covarelli, M. Pioppi
Università di Perugia, Dipartimento di Fisica and INFN, I-06100 Perugia, Italy
M. Davier, X. Giroux, G. Grosdidier, A. Höcker, S. Laplace, F. Le Diberder, V. Lepeltier, A. M. Lutz, T. C. Petersen, S. Plaszczynski, M. H. Schune, L. Tantot, G. Wormser
Laboratoire de l’Accélérateur Linéaire, F-91898 Orsay, France
C. H. Cheng, D. J. Lange, M. C. Simani, D. M. Wright
Lawrence Livermore National Laboratory, Livermore, CA 94550, USA
A. J. Bevan, C. A. Chavez, J. P. Coleman, I. J. Forster, J. R. Fry, E. Gabathuler, R. Gamet, D. E. Hutchcroft, R. J. Parry, D. J. Payne, R. J. Sloane, C. Touramanis
University of Liverpool, Liverpool L69 72E, United Kingdom
J. J. Back,111Now at Department of Physics, University of Warwick, Coventry, United Kingdom C. M. Cormack, P. F. Harrison,11footnotemark: 1 F. Di Lodovico, G. B. Mohanty11footnotemark: 1
Queen Mary, University of London, E1 4NS, United Kingdom
C. L. Brown, G. Cowan, R. L. Flack, H. U. Flaecher, M. G. Green, P. S. Jackson, T. R. McMahon, S. Ricciardi, F. Salvatore, M. A. Winter
University of London, Royal Holloway and Bedford New College, Egham, Surrey TW20 0EX, United Kingdom
D. Brown, C. L. Davis
University of Louisville, Louisville, KY 40292, USA
J. Allison, N. R. Barlow, R. J. Barlow, P. A. Hart, M. C. Hodgkinson, G. D. Lafferty, A. J. Lyon, J. C. Williams
University of Manchester, Manchester M13 9PL, United Kingdom
A. Farbin, W. D. Hulsbergen, A. Jawahery, D. Kovalskyi, C. K. Lae, V. Lillard, D. A. Roberts
University of Maryland, College Park, MD 20742, USA
G. Blaylock, C. Dallapiccola, K. T. Flood, S. S. Hertzbach, R. Kofler, V. B. Koptchev, T. B. Moore, S. Saremi, H. Staengle, S. Willocq
University of Massachusetts, Amherst, MA 01003, USA
R. Cowan, G. Sciolla, S. J. Sekula, F. Taylor, R. K. Yamamoto
Massachusetts Institute of Technology, Laboratory for Nuclear Science, Cambridge, MA 02139, USA
D. J. J. Mangeol, P. M. Patel, S. H. Robertson
McGill University, Montréal, QC, Canada H3A 2T8
A. Lazzaro, V. Lombardo, F. Palombo
Università di Milano, Dipartimento di Fisica and INFN, I-20133 Milano, Italy
J. M. Bauer, L. Cremaldi, V. Eschenburg, R. Godang, R. Kroeger, J. Reidy, D. A. Sanders, D. J. Summers, H. W. Zhao
University of Mississippi, University, MS 38677, USA
S. Brunet, D. Côté, P. Taras
Université de Montréal, Laboratoire René J. A. Lévesque, Montréal, QC, Canada H3C 3J7
H. Nicholson
Mount Holyoke College, South Hadley, MA 01075, USA
N. Cavallo,222Also with Università della Basilicata, Potenza, Italy F. Fabozzi,22footnotemark: 2 C. Gatto, L. Lista, D. Monorchio, P. Paolucci, D. Piccolo, C. Sciacca
Università di Napoli Federico II, Dipartimento di Scienze Fisiche and INFN, I-80126, Napoli, Italy
M. Baak, H. Bulten, G. Raven, H. L. Snoek, L. Wilden
NIKHEF, National Institute for Nuclear Physics and High Energy Physics, NL-1009 DB Amsterdam, The Netherlands
C. P. Jessop, J. M. LoSecco
University of Notre Dame, Notre Dame, IN 46556, USA
T. Allmendinger, K. K. Gan, K. Honscheid, D. Hufnagel, H. Kagan, R. Kass, T. Pulliam, A. M. Rahimi, R. Ter-Antonyan, Q. K. Wong
Ohio State University, Columbus, OH 43210, USA
J. Brau, R. Frey, O. Igonkina, C. T. Potter, N. B. Sinev, D. Strom, E. Torrence
University of Oregon, Eugene, OR 97403, USA
F. Colecchia, A. Dorigo, F. Galeazzi, M. Margoni, M. Morandin, M. Posocco, M. Rotondo, F. Simonetto, R. Stroili, G. Tiozzo, C. Voci
Università di Padova, Dipartimento di Fisica and INFN, I-35131 Padova, Italy
M. Benayoun, H. Briand, J. Chauveau, P. David, Ch. de la Vaissière, L. Del Buono, O. Hamon, M. J. J. John, Ph. Leruste, J. Malcles, J. Ocariz, M. Pivk, L. Roos, S. T’Jampens, G. Therin
Universités Paris VI et VII, Laboratoire de Physique Nucléaire et de Hautes Energies, F-75252 Paris, France
P. F. Manfredi, V. Re
Università di Pavia, Dipartimento di Elettronica and INFN, I-27100 Pavia, Italy
P. K. Behera, L. Gladney, Q. H. Guo, J. Panetta
University of Pennsylvania, Philadelphia, PA 19104, USA
C. Angelini, G. Batignani, S. Bettarini, M. Bondioli, F. Bucci, G. Calderini, M. Carpinelli, F. Forti, M. A. Giorgi, A. Lusiani, G. Marchiori, F. Martinez-Vidal,333Also with IFIC, Instituto de Física Corpuscular, CSIC-Universidad de Valencia, Valencia, Spain M. Morganti, N. Neri, E. Paoloni, M. Rama, G. Rizzo, F. Sandrelli, J. Walsh
Università di Pisa, Dipartimento di Fisica, Scuola Normale Superiore and INFN, I-56127 Pisa, Italy
M. Haire, D. Judd, K. Paick, D. E. Wagoner
Prairie View A&M University, Prairie View, TX 77446, USA
N. Danielson, P. Elmer, Y. P. Lau, C. Lu, V. Miftakov, J. Olsen, A. J. S. Smith, A. V. Telnov
Princeton University, Princeton, NJ 08544, USA
F. Bellini, G. Cavoto,444Also with Princeton University, Princeton, USA R. Faccini, F. Ferrarotto, F. Ferroni, M. Gaspero, L. Li Gioi, M. A. Mazzoni, S. Morganti, M. Pierini, G. Piredda, F. Safai Tehrani, C. Voena
Università di Roma La Sapienza, Dipartimento di Fisica and INFN, I-00185 Roma, Italy
S. Christ, G. Wagner, R. Waldi
Universität Rostock, D-18051 Rostock, Germany
T. Adye, N. De Groot, B. Franek, N. I. Geddes, G. P. Gopal, E. O. Olaiya
Rutherford Appleton Laboratory, Chilton, Didcot, Oxon, OX11 0QX, United Kingdom
R. Aleksan, S. Emery, A. Gaidot, S. F. Ganzhur, P.-F. Giraud, G. Hamel de Monchenault, W. Kozanecki, M. Legendre, G. W. London, B. Mayer, G. Schott, G. Vasseur, Ch. Yèche, M. Zito
DSM/Dapnia, CEA/Saclay, F-91191 Gif-sur-Yvette, France
M. V. Purohit, A. W. Weidemann, J. R. Wilson, F. X. Yumiceva
University of South Carolina, Columbia, SC 29208, USA
D. Aston, R. Bartoldus, N. Berger, A. M. Boyarski, O. L. Buchmueller, R. Claus, M. R. Convery, M. Cristinziani, G. De Nardo, D. Dong, J. Dorfan, D. Dujmic, W. Dunwoodie, E. E. Elsen, S. Fan, R. C. Field, T. Glanzman, S. J. Gowdy, T. Hadig, V. Halyo, C. Hast, T. Hryn’ova, W. R. Innes, M. H. Kelsey, P. Kim, M. L. Kocian, D. W. G. S. Leith, J. Libby, S. Luitz, V. Luth, H. L. Lynch, H. Marsiske, R. Messner, D. R. Muller, C. P. O’Grady, V. E. Ozcan, A. Perazzo, M. Perl, S. Petrak, B. N. Ratcliff, A. Roodman, A. A. Salnikov, R. H. Schindler, J. Schwiening, G. Simi, A. Snyder, A. Soha, J. Stelzer, D. Su, M. K. Sullivan, J. Va’vra, S. R. Wagner, M. Weaver, A. J. R. Weinstein, W. J. Wisniewski, M. Wittgen, D. H. Wright, A. K. Yarritu, C. C. Young
Stanford Linear Accelerator Center, Stanford, CA 94309, USA
P. R. Burchat, A. J. Edwards, T. I. Meyer, B. A. Petersen, C. Roat
Stanford University, Stanford, CA 94305-4060, USA
S. Ahmed, M. S. Alam, J. A. Ernst, M. A. Saeed, M. Saleem, F. R. Wappler
State University of New York, Albany, NY 12222, USA
W. Bugg, M. Krishnamurthy, S. M. Spanier
University of Tennessee, Knoxville, TN 37996, USA
R. Eckmann, H. Kim, J. L. Ritchie, A. Satpathy, R. F. Schwitters
University of Texas at Austin, Austin, TX 78712, USA
J. M. Izen, I. Kitayama, X. C. Lou, S. Ye
University of Texas at Dallas, Richardson, TX 75083, USA
F. Bianchi, M. Bona, F. Gallo, D. Gamba
Università di Torino, Dipartimento di Fisica Sperimentale and INFN, I-10125 Torino, Italy
L. Bosisio, C. Cartaro, F. Cossutti, G. Della Ricca, S. Dittongo, S. Grancagnolo, L. Lanceri, P. Poropat,555Deceased L. Vitale, G. Vuagnin
Università di Trieste, Dipartimento di Fisica and INFN, I-34127 Trieste, Italy
R. S. Panvini
Vanderbilt University, Nashville, TN 37235, USA
Sw. Banerjee, C. M. Brown, D. Fortin, P. D. Jackson, R. Kowalewski, J. M. Roney, R. J. Sobie
University of Victoria, Victoria, BC, Canada V8W 3P6
H. R. Band, B. Cheng, S. Dasu, M. Datta, A. M. Eichenbaum, M. Graham, J. J. Hollar, J. R. Johnson, P. E. Kutter, H. Li, R. Liu, A. Mihalyi, A. K. Mohapatra, Y. Pan, R. Prepost, P. Tan, J. H. von Wimmersperg-Toeller, J. Wu, S. L. Wu, Z. Yu
University of Wisconsin, Madison, WI 53706, USA
M. G. Greene, H. Neal
Yale University, New Haven, CT 06511, USA
1 INTRODUCTION
The very successful performance of the two factories PEP II and KEKB enables the study of meson decays with unprecedented sensitivity. In this paper meson decays to final states which include a charmed meson and a baryon anti-baryon pair are studied. The observation of the and decays by CLEO [1], and the color-suppressed and decay modes by Belle [2] suggest the dominance of multi-body final states in decays of mesons into baryons [3]. In this paper we present the measurements of the branching fractions for the following four decay modes: , , , and . Observation of modes proposed here would help clarify the dynamics of weak decays of involving baryons [4].
Since the branching fractions of multi-body decays are sizable [5], it is natural to ask whether such final states are actually the products of an intermediate two-body channel. If this is the case, then these initial two-body decays may involve a baryon-antibaryon bound states () [6, 7] or a charmed pentaquark (, which can be for example) [8, 9] or a (nonexotic) heavy charmed baryon. Motivated by these considerations, the invariant mass spectrum of the baryon-antibaryon and the invariant mass spectra of the charmed meson and baryon are investigated. In particular, the Dalitz plots for versus and versus for the and decay modes, respectively, are presented. The inclusion of the charge conjugate modes is implicit throughout this report.
2 THE BABAR DETECTOR AND DATASET
The data used in this analysis were collected with the BABAR detector at the PEP-II storage ring. The sample corresponds to an integrated luminosity of at the resonance (on-resonance) and taken below the resonance (off-resonance). The on-resonance sample contains about pairs. The collider is operated with asymmetric beam energies, producing a boost of of the along the collision axis.
The BABAR detector is optimized for asymmetric energy collisions at a center-of-mass (CM) energy corresponding to the resonance. The detector is described in detail in reference [10]. Charged particle tracking is provided by a five-layer double-sided silicon vertex tracker (SVT) and a 40-layer drift chamber (DCH) contained within the magnetic field of a 1.5T superconducting solenoid. The tracking system provides momentum reconstruction of charged particles and measures energy-loss () for particle identification. Additional charged – particle identification is provided by a ring-imaging Cherenkov detector (DIRC), which exploits the total internal reflection of Cherenkov photons within synthetic quartz bars. The energies of neutral particles are measured by an electromagnetic calorimeter (EMC) composed of 6580 CsI(Tl) crystals. The magnetic flux return of the solenoid (IFR) is instrumented with resistive plate chambers in order to provide muon and neutral hadron identification.
A GEANT4-based [11] Monte Carlo (MC) simulation is used to model the signal efficiency and the physics backgrounds. Simulation samples equivalent to approximately three times the accumulated data were used to model events, and samples equivalent to approximately one times the accumulated data were used to model , , , and events.
3 ANALYSIS METHOD
The meson is reconstructed in the following four decay modes: , , , and . The and are reconstructed as and , respectively. The candidates are reconstructed in the decay mode . The candidates are reconstructed in the mode.
3.1 SELECTION
The reconstruction proceeds as follows. First we reconstruct the and candidates in the decay modes noted above. For all decay modes, charged kaons are distinguished from the pions and protons with energy-loss () information in the tracking system and the Cherenkov angle and the number of photons measured by the DIRC. For the decay mode only, the pion from decay must not be identified as either an electron, muon, kaon or proton. The mass of the reconstructed or candidates must be within 3 standard deviations of the fitted mean of reconstructed or mass for each decay mode. Finally, the daughter tracks from the or are required to be consistent with originating from a common vertex.
For the decay modes and , and candidates are reconstructed by combining the candidate with a soft track or a soft , respectively. The momentum of the soft track or soft in the CM frame must be less than 0.45 /c. The candidate is required to have a two-photon invariant mass between 0.116–0.150 /, and its daughter photon candidates must have a minimum cluster energy of 30 . The mass difference between and () is required to be less than and for and candidates, respectively. The requirement removes crossfeed from into . For each track except for the soft pion from decays, the transverse momentum must be larger than 0.1 /c in order to improve the quality of the vertex fit.
To reconstruct the candidate and decay modes, both proton and anti-proton candidates are distinguished from pions and kaons on the basis of energy-loss () information in the tracking system and the Cherenkov angle and the number of photons measured by DIRC. The reconstructed and , respectively, are combined with an identified proton and anti-proton pair and a track. We require that the pion candidate track must not be identified as either an electron, a muon, a kaon or a proton. For the decay modes and , the and candidates, respectively, are combined with an identified proton and anti-proton pair. All the daughters of the must originate from a common vertex.
Two additional kinematic variables are used to identify the reconstructed candidates [10]. The first is the beam-energy-substituted mass, , where is the total CM energy of the collision, () is the four-momentum of the initial system and is the momentum of the reconstructed candidate, both measured in the laboratory frame. The second variable is , where is the -candidate energy in the CM frame. The meson candidates are defined by requiring: and . These two variables are then used in a maximum likelihood fit to extract signal and background yields.
If more than one suitable candidate is reconstructed in an event, then for each decay mode one best candidate is selected. The best candidate selection algorithm is based on a -like quantity constructed from the difference between the mass and/or mass difference for the candidate and the nominal value [12]. For a given event, the candidate with the lowest value of is selected for each decay mode. For the and decays, the best candidate is selected based on the mass of the candidate and . For the and decay modes, the reconstructed meson mass is used for best candidate selection.
To suppress background from two-jet-like continuum, variables that characterize the event topology are used. We require , where is the angle between the thrust axis of the candidate and that of the rest of the event. This requirement eliminates 63% of the continuum background and retains 88% of the signal events. For further continuum background suppression we require that the ratio of the second to zeroth Fox-Wolfram moments [13] is less than 0.35.
The signal efficiency in each decay mode after applying all selection criteria is shown in Table 1. The efficiencies listed in the table are obtained from signal MC simulation assuming pure phase-space for the decay model.
| Mode | Efficiency, % | Signal yield | Statistical significance |
|---|---|---|---|
| 6.97 0.10 | 13014 | 18 | |
| 5.87 0.10 | 23822 | 17 | |
| 5.53 0.09 | 13 4 | 5 | |
| 16.53 0.15 | 96 11 | 17 |
3.2 THE MAXIMUM LIKELIHOOD FIT
We perform an unbinned extended maximum likelihood (ML) fit to extract the signal and background yields. The variables , are used to separate signal from backgrounds. The data sample is assumed to consist of signal and combinatorial backgrounds, which arise from random combinations of charged or neutral candidates from both continuum and events. The extended likelihood for a sample of candidates is
| (1) |
where and are the number of signal and background yields (to be determined by the fit), respectively, and +. The probability density functions (PDFs) and are the product of the PDFs of two discriminating variables. The signal PDF is thus given by . The signal PDFs are decomposed into two parts with distinct distributions:
-
•
Signal class I: signal events that are correctly reconstructed or signal events that are misreconstructed due to a random slow or assigned to a or decay. Since the and distributions for these two kinds of events do not significantly differ from each other, we put them into one signal class in the ML fit.
-
•
Signal class II: signal events that are misreconstructed due to wrong tracks from direct decays or from a wrongly reconstructed meson. The and distributions are significantly different from those of signal class I. Hereafter signal class II events are also called Self-Cross-Feed (SCF) events. The fraction of this kind of misreconstructed signal event is estimated by MC simulation.
The PDFs of and for signal events are taken from the MC simulation, with the exception that the means of the signal Gaussian for the and PDFs are free to vary in the fit. The and PDFs for the combinatorial backgrounds, which include background and continuum background, are described by two free parameters. One of these is from an ARGUS function [14] used to describe the shape, the other is from a first-order polynomial for the shape. A total of six parameters, including signal and background yields and all the parameters related to background PDFs, are varied in the fit.
4 PHYSICS RESULTS
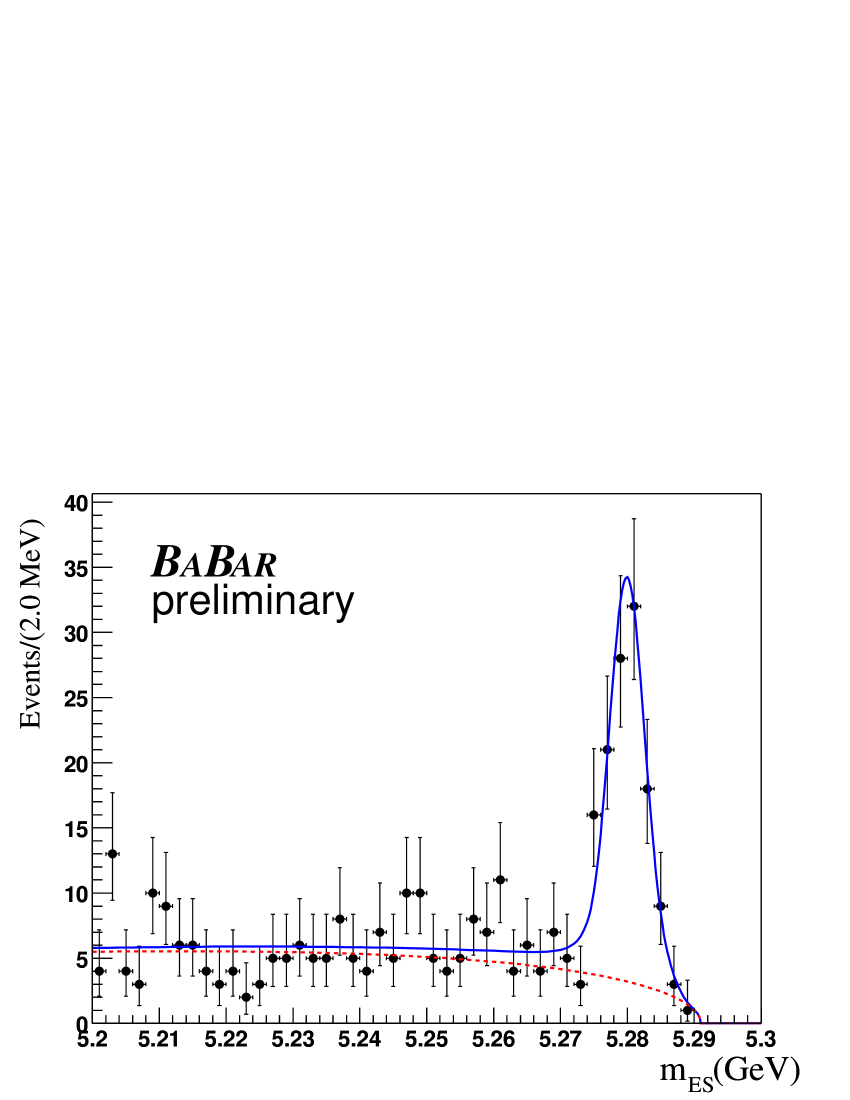
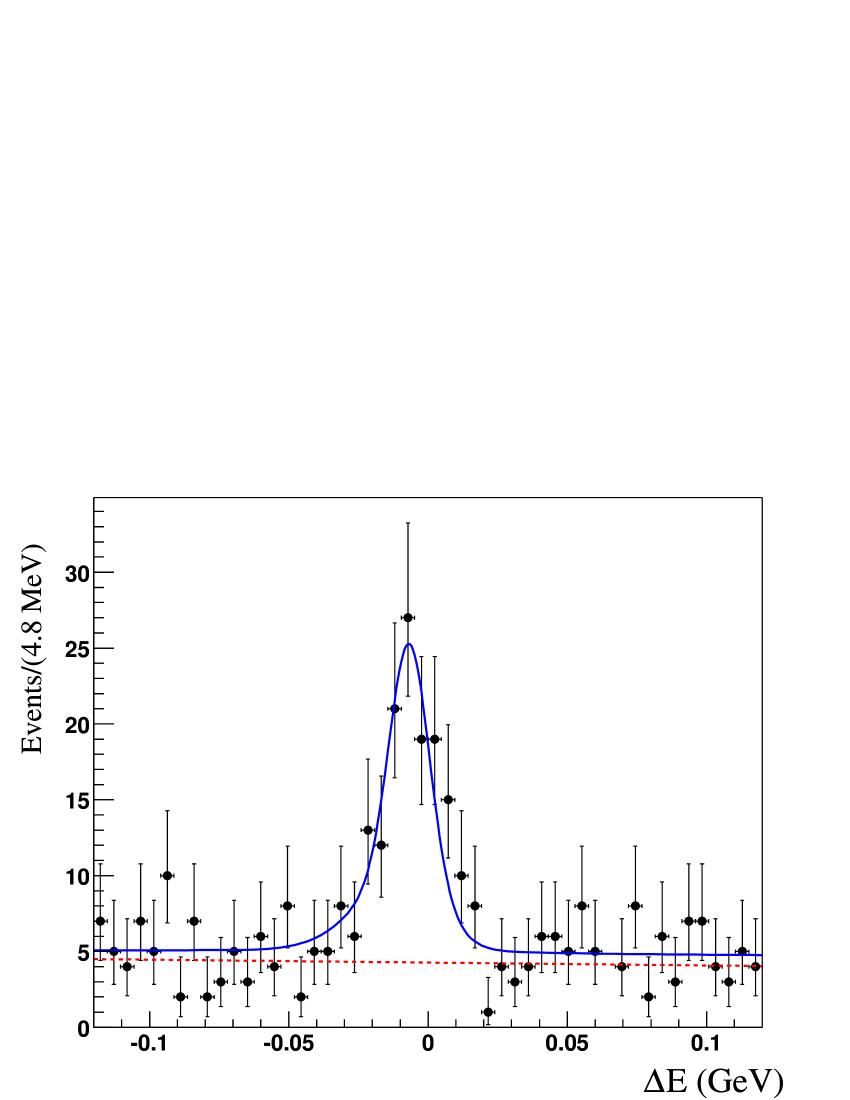
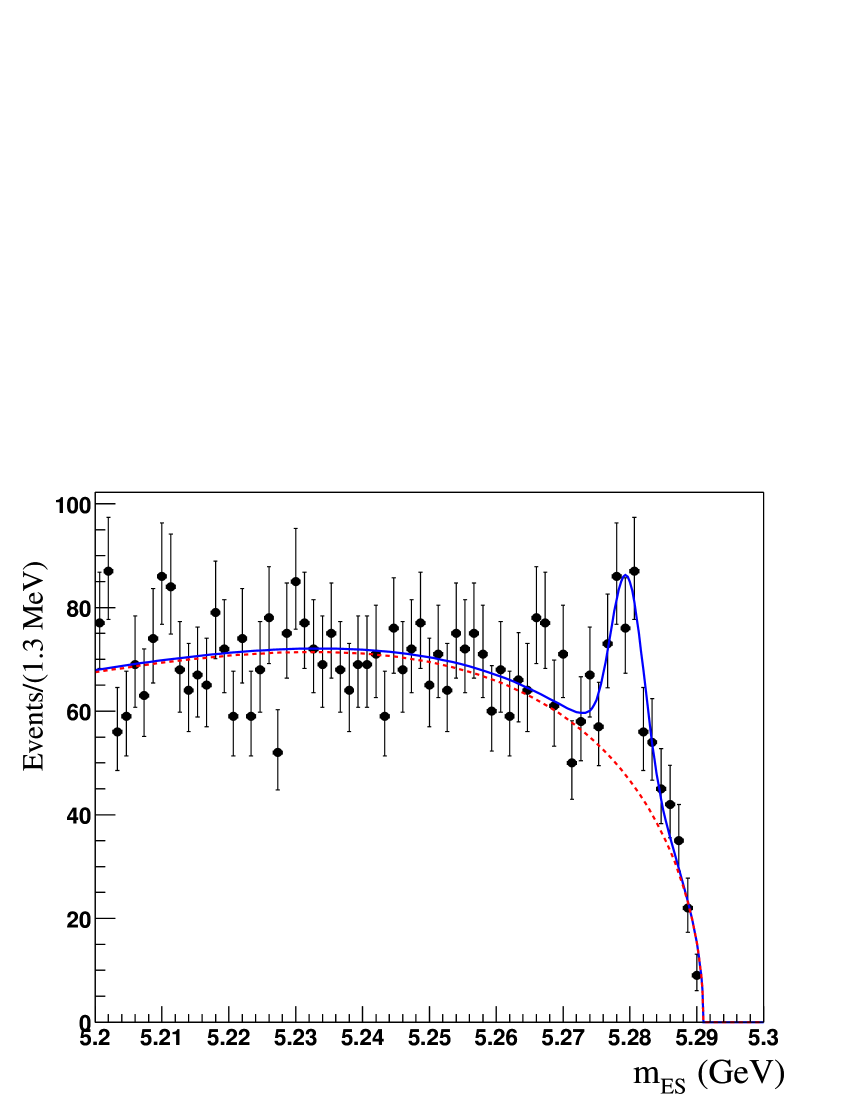
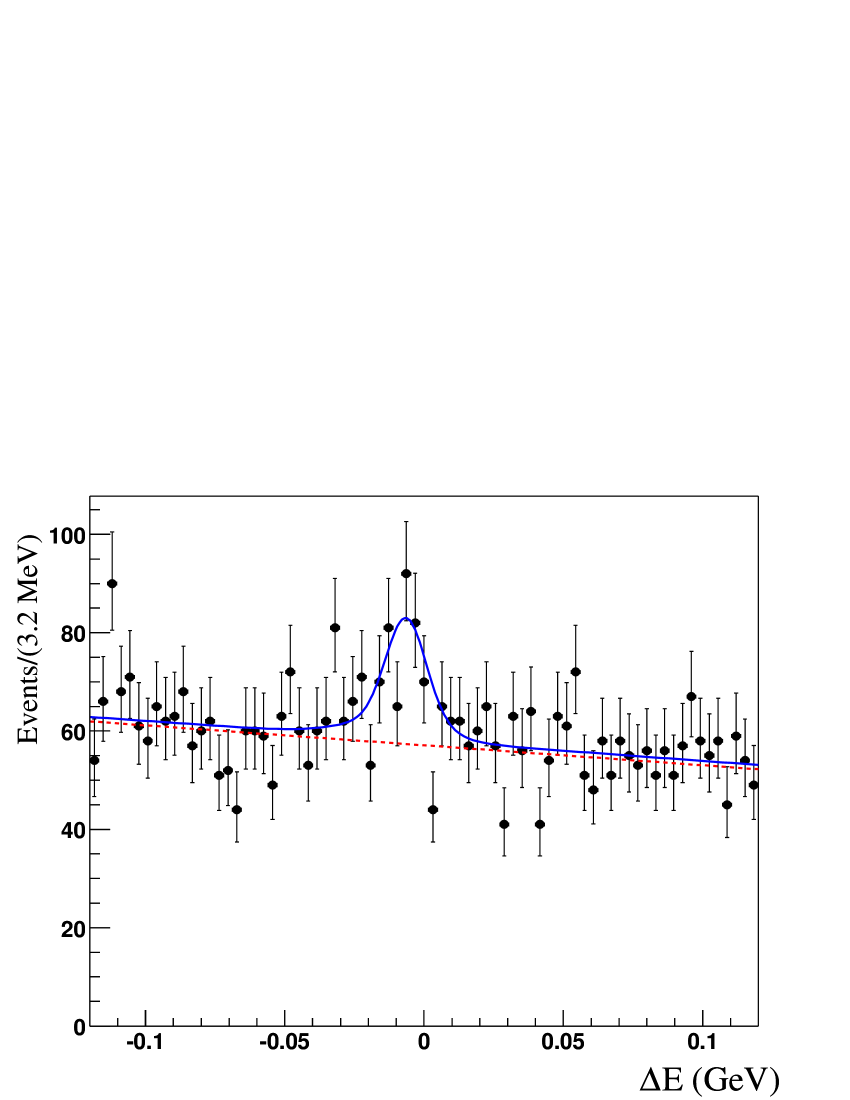
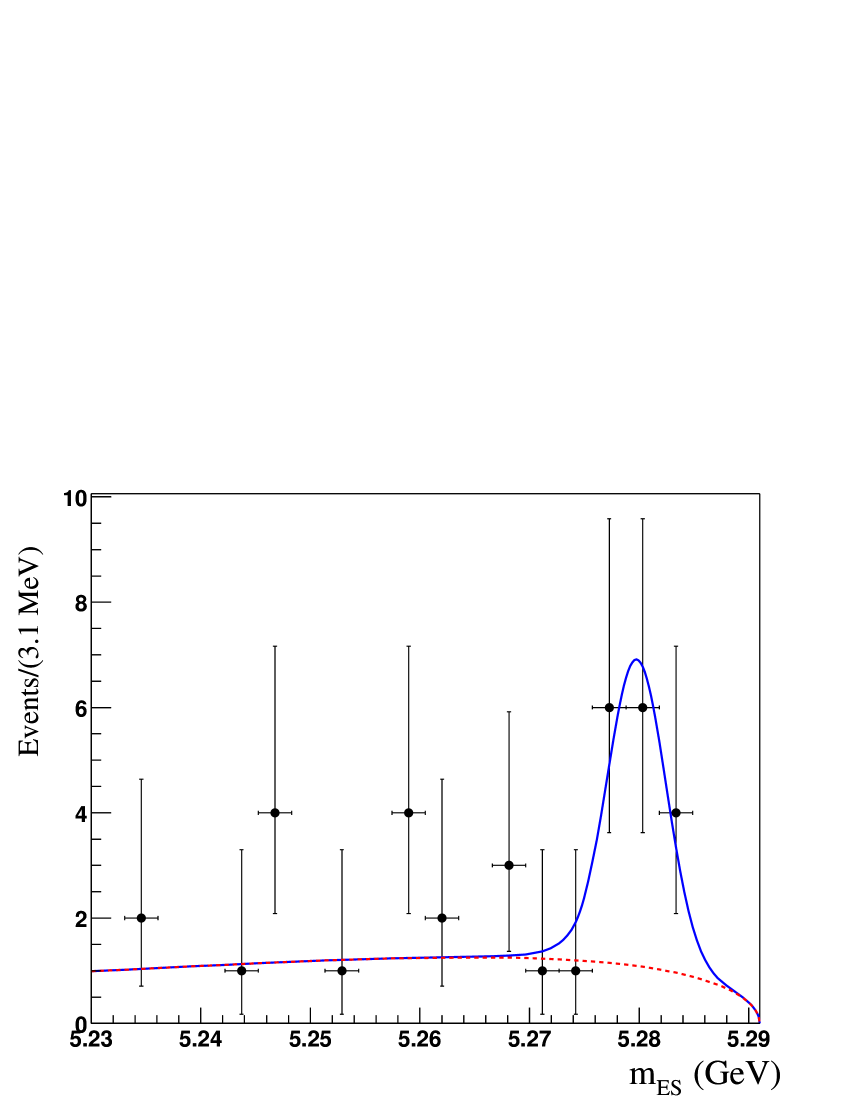
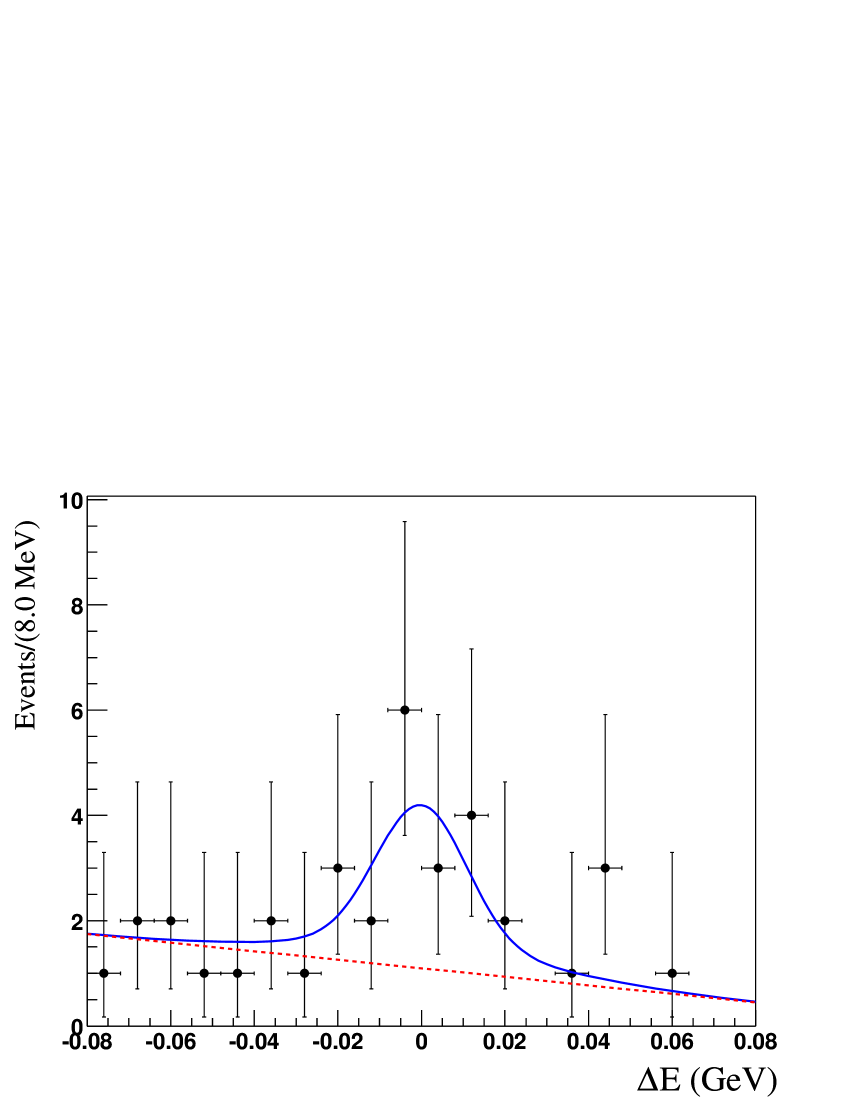

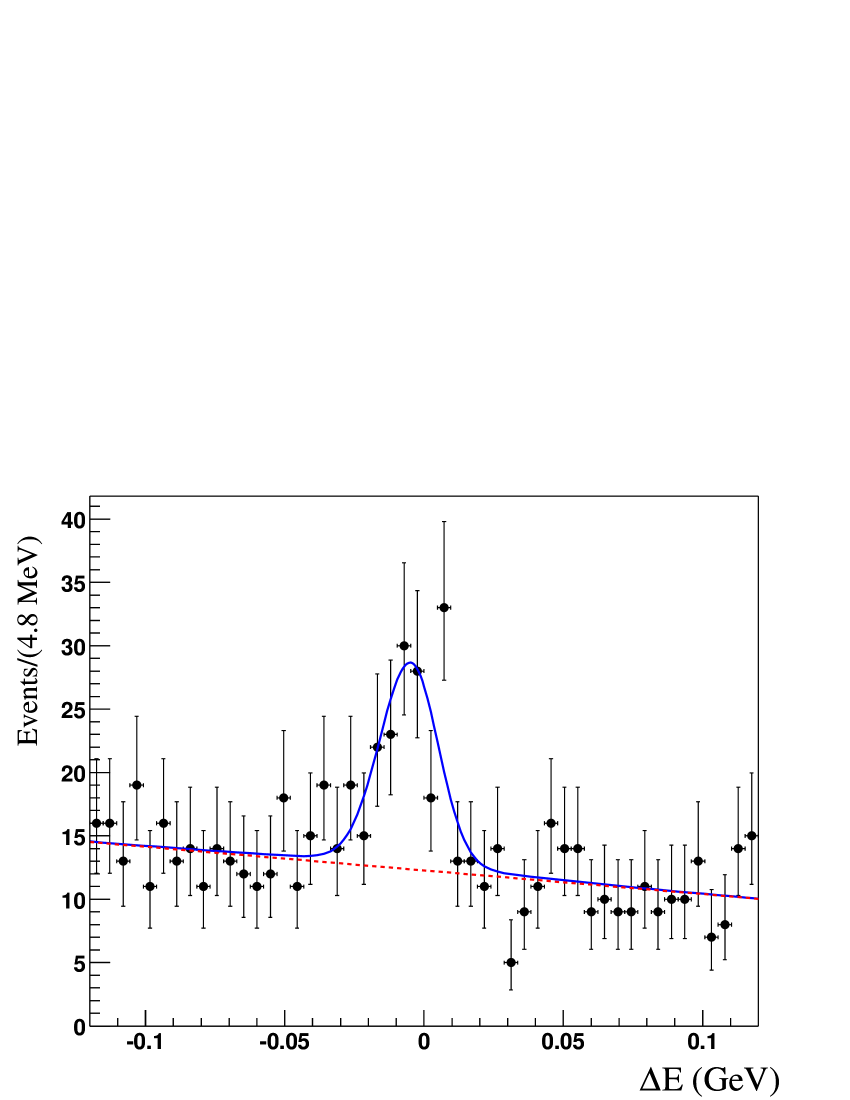
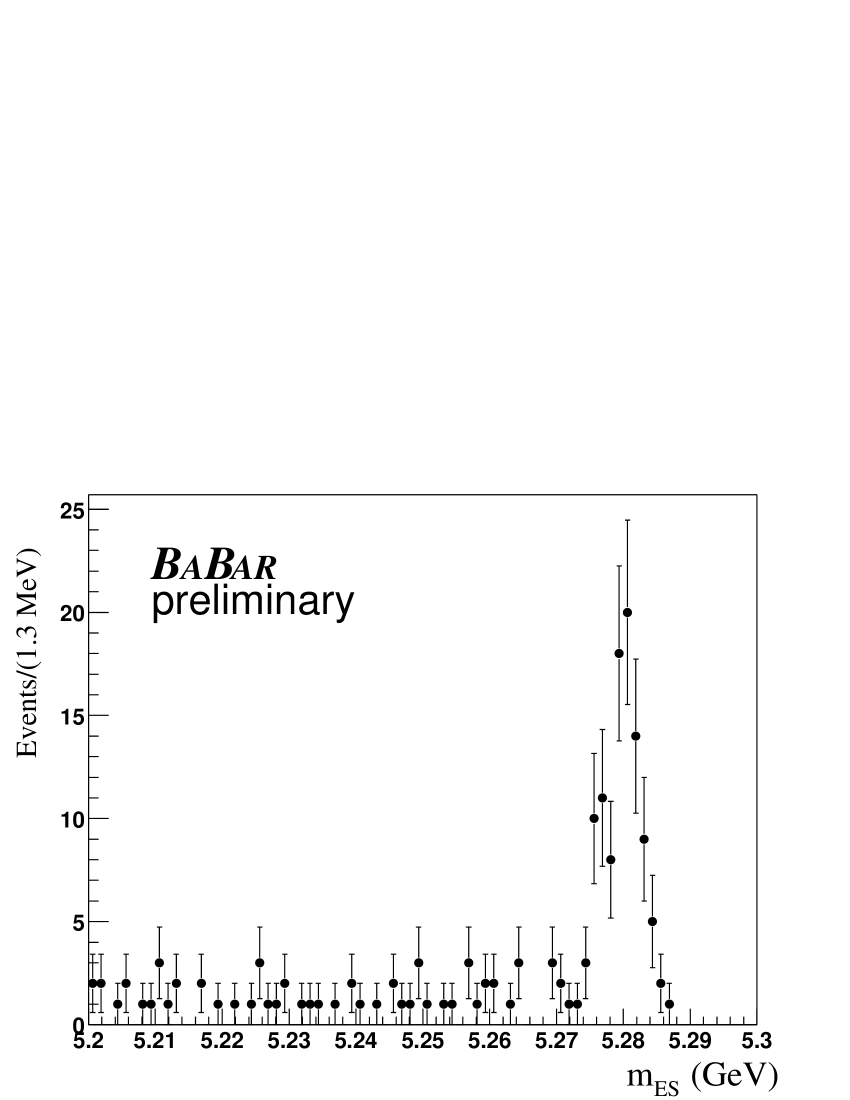

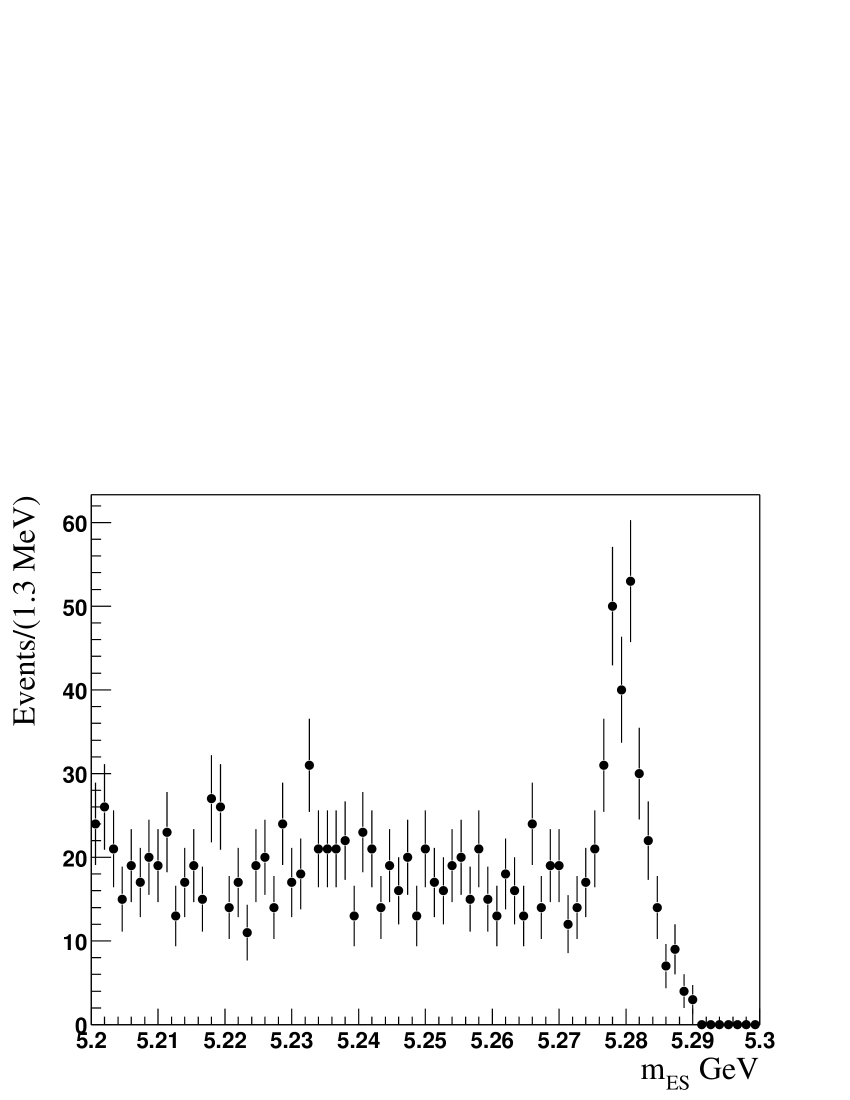
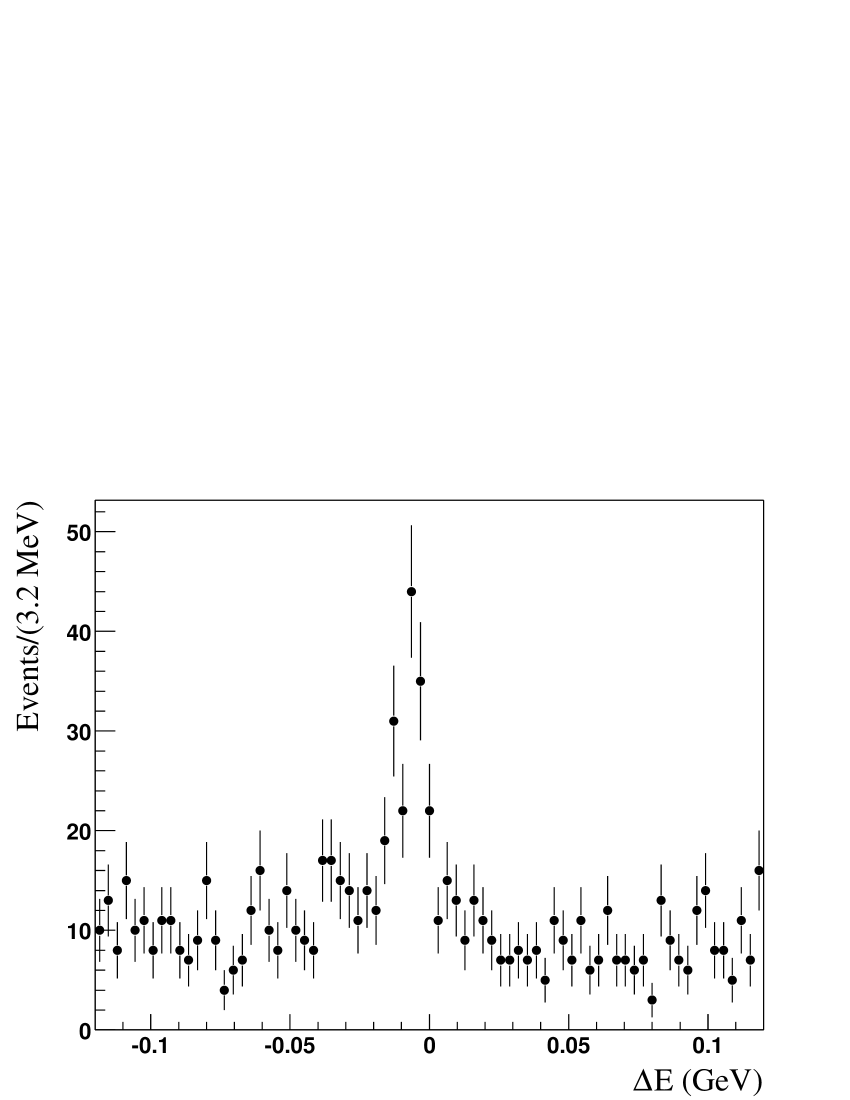

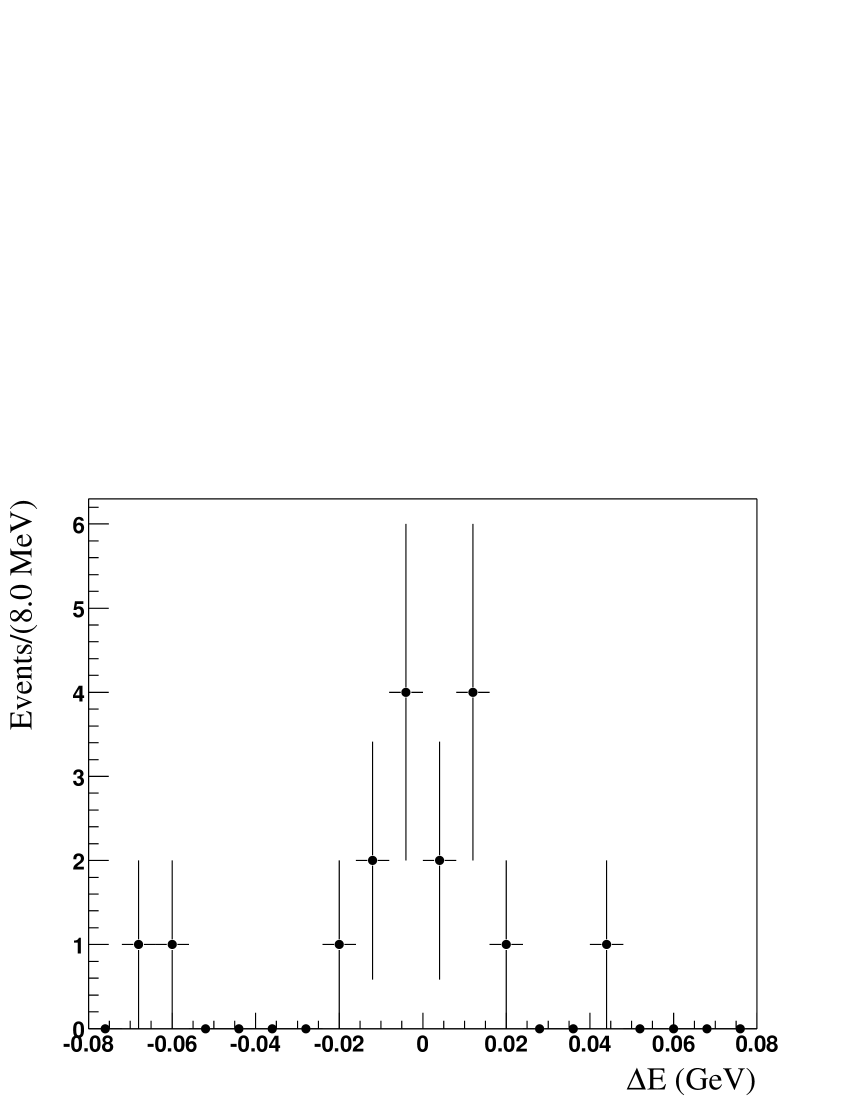
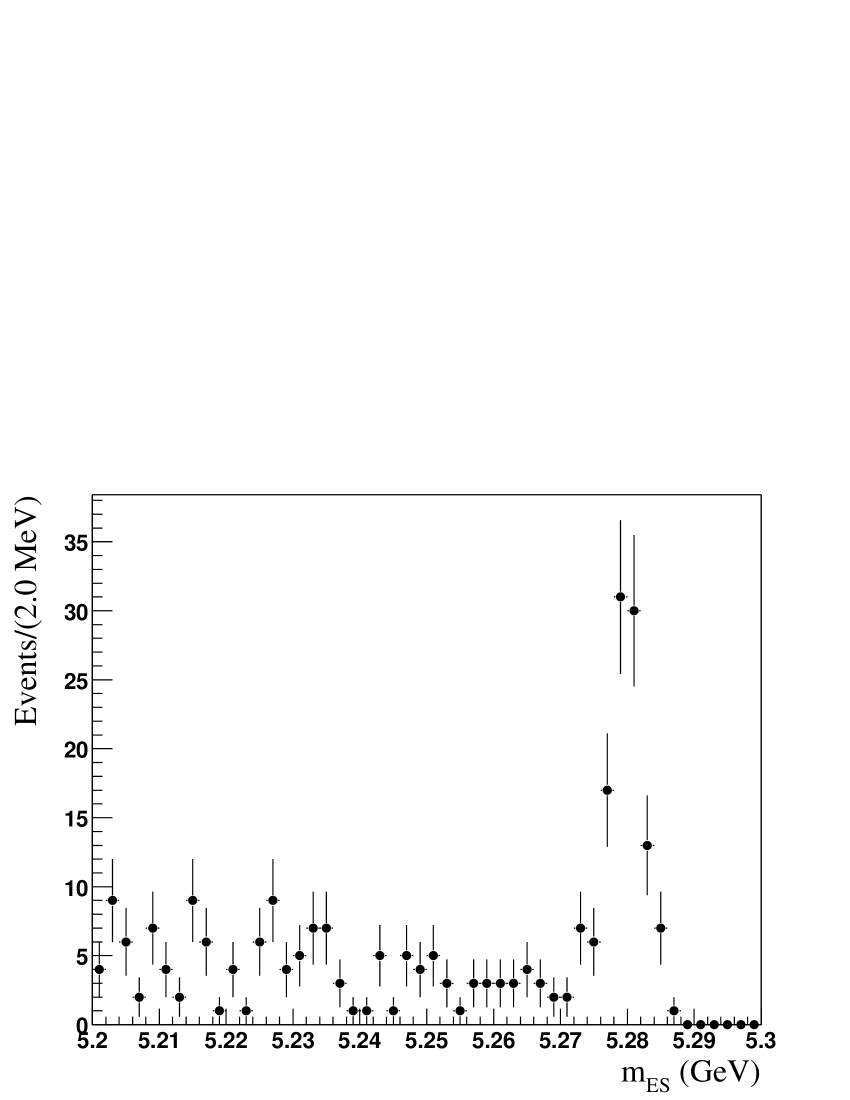
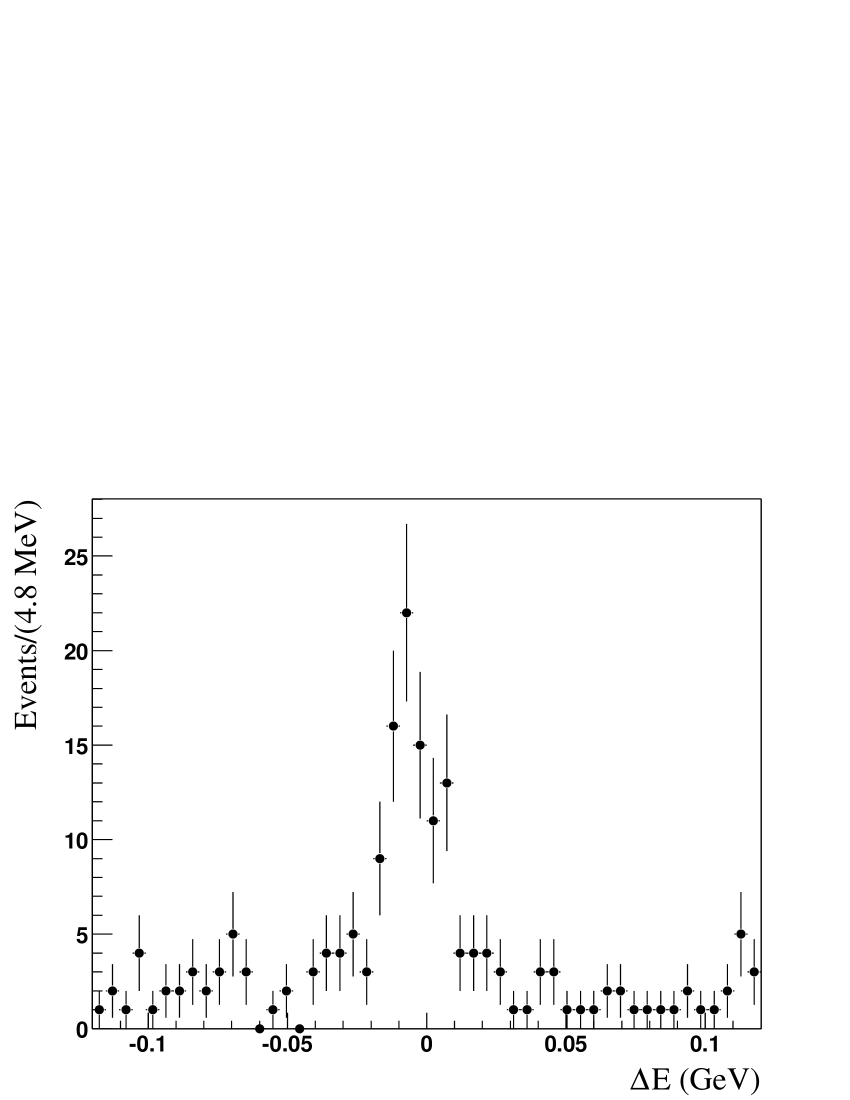
The signal yield from the ML fit and statistical significance for each of the modes are summarized in Table 1. The statistical significance is calculated as , where is the log-likelihood difference between a signal hypothesis corresponding to the yield and that corresponding to a null yield. Figure 1 shows projection plots of and from the likelihood fit. The fit shows satisfactory agreement with distributions of the discriminating variables.
To correct for the efficiency variation across the Dalitz plot, which is of order 20% for and 5% for three-body decays, each event is assigned a signal weight, , which takes correlations into account:
| (2) |
where is the number of events, is the PDF of the component given the event values of and , and is the signal row of the covariance matrix of the components yields obtained from the likelihood fit. We determine the efficiency as a function of position on the Dalitz plot from simulated signal events. The branching fractions of and three-body decays are corrected by the Dalitz plot dependent efficiencies. The effect of the polarization in the mode is neglected in this Dalitz plot dependent efficiency correction.
We estimate the efficiencies for 4-body decays with the same method as for three-body decays. We find that the differences are 7.5% and 3.1% from the efficiencies obtained from a pure phase-space MC for the and , respectively. We will assign 7.5% and 3.1% as additional systematic errors for the two four-body decays, respectively.
In each of the four decay modes, the signal region is defined as: and . The distributions after applying the requirement , and distributions after applying the requirement , are shown in Fig. 2 for all four decay modes. We also compare the invariant mass spectra for charmed meson and baryon combinations with a pure phase space hypothesis for decays. Figure 3 shows the invariant mass of and for signal candidates in the mode. The open histogram is the expected distribution from phase space signal MC simulation which is normalized to the fitted signal yield in data. The cross-hatched histograms describe the contributions from different background processes, which is normalized to the fitted background yield in data.

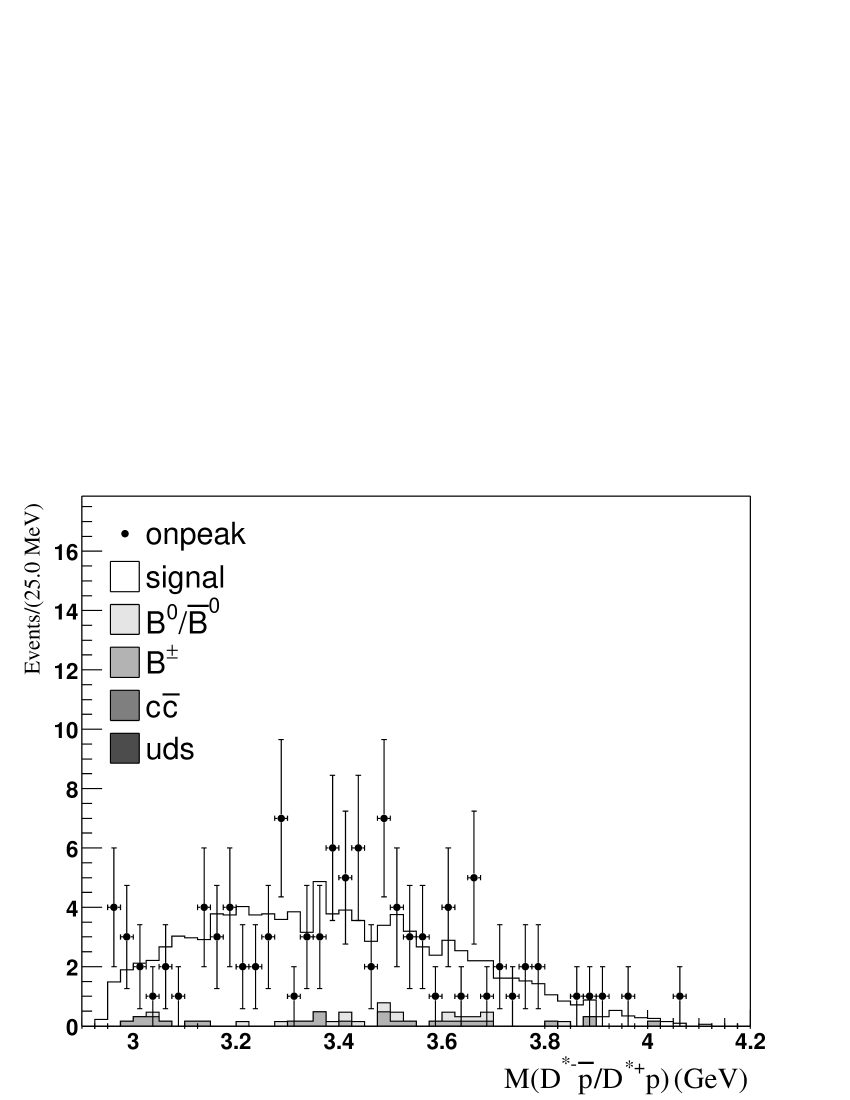
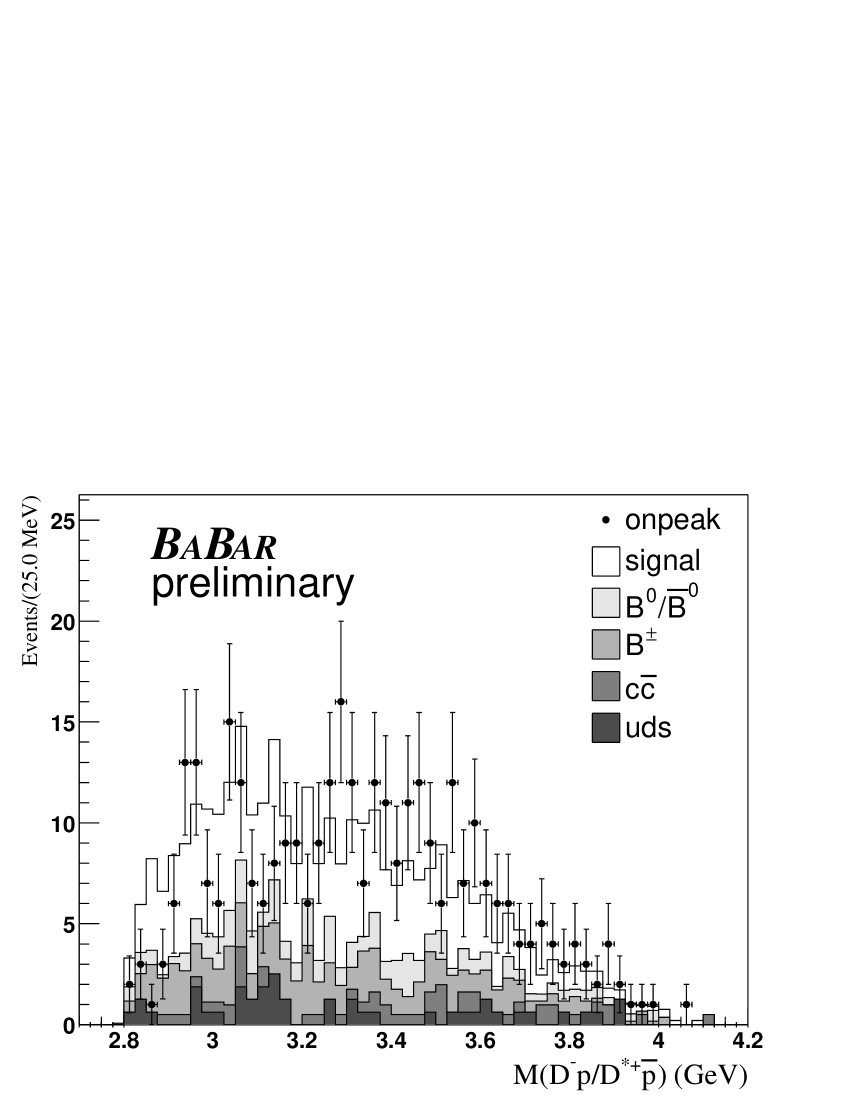


The shape of the invariant mass spectra in Fig. 3 show that the distribution in data is only marginally consistent with a phase space model, while the is quite consistent with phase space. A similar observation holds for the and distribution from signal candidates in the mode as shown in Fig. 4.
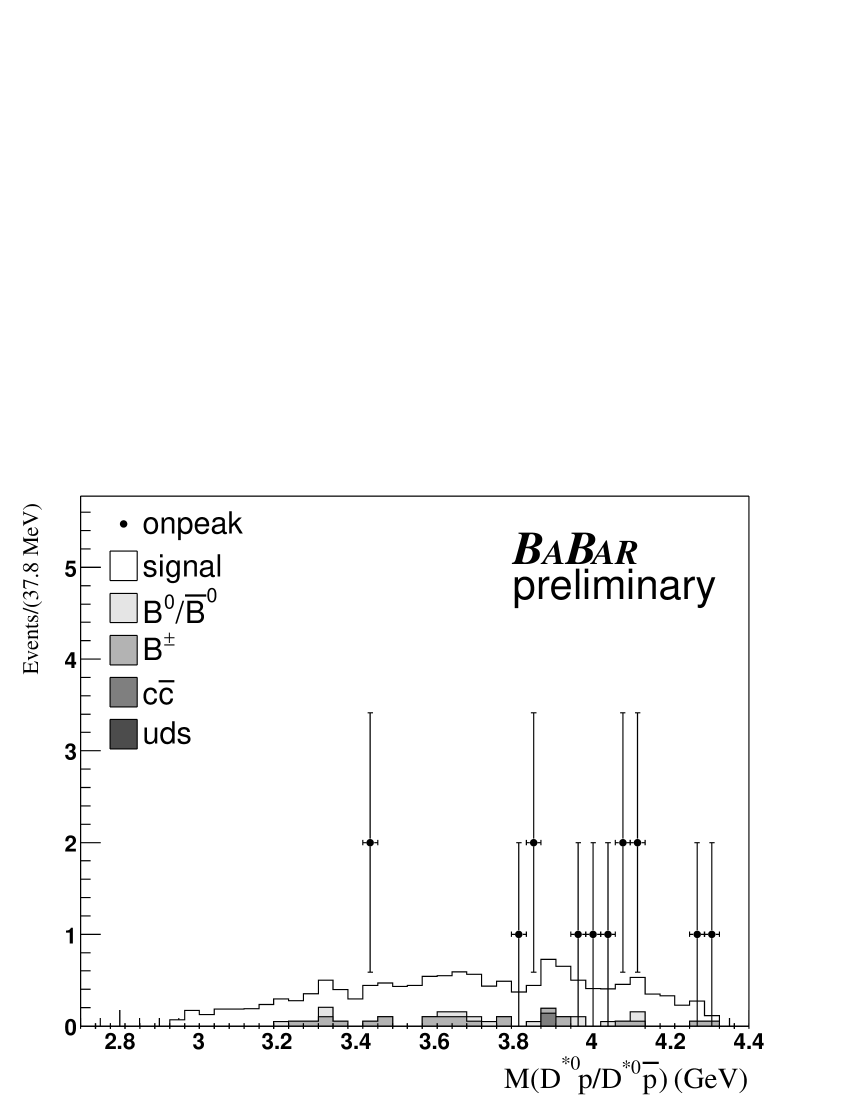
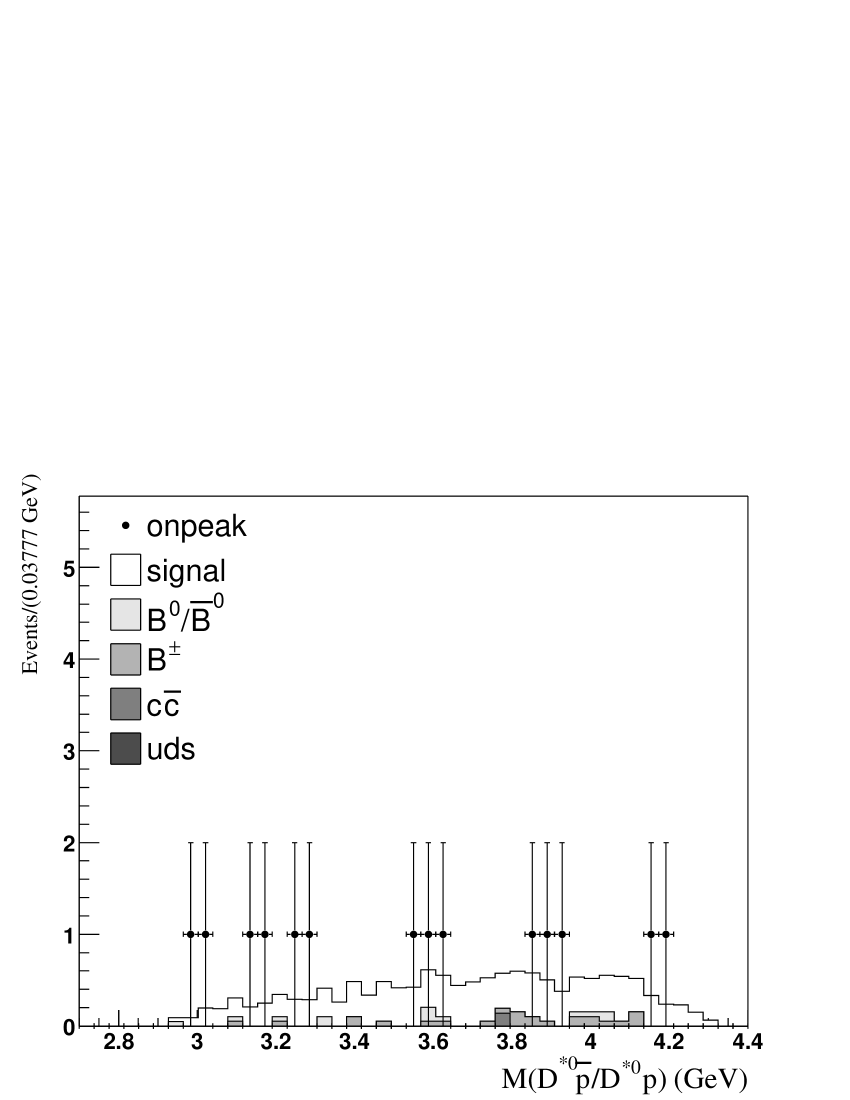
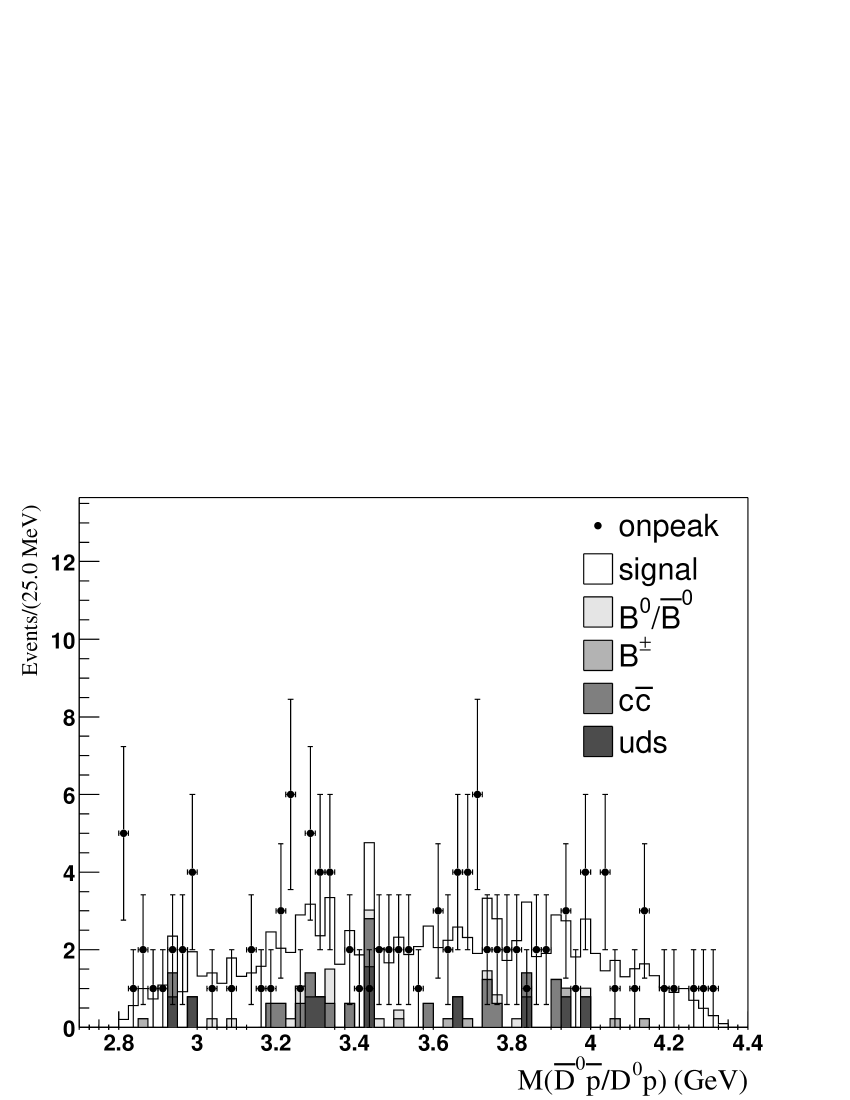
As shown in Fig. 5, the shapes of the invariant mass spectra from a phase-space model for the and distributions in the mode, are consistent with data given the current low statistics. However, the shape for the distribution in the mode is inconsistent and it appears to deviate from the phase-space expectation, as illustrated in the left-hand plot of Fig. 6. For , the distribution in data is consistent with the phase space, as shown in the right-hand plot of Fig. 6.
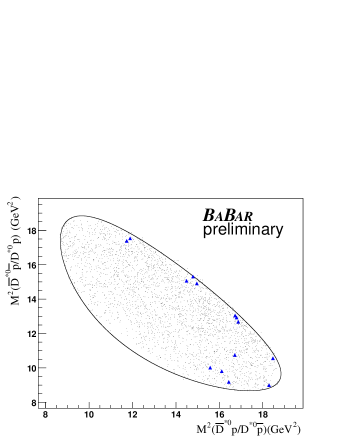
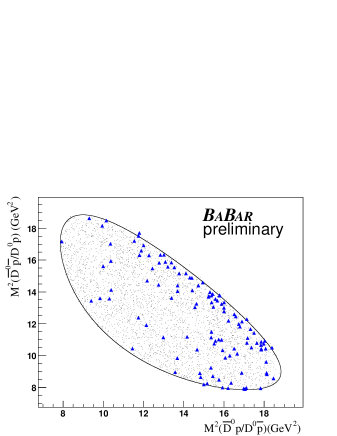
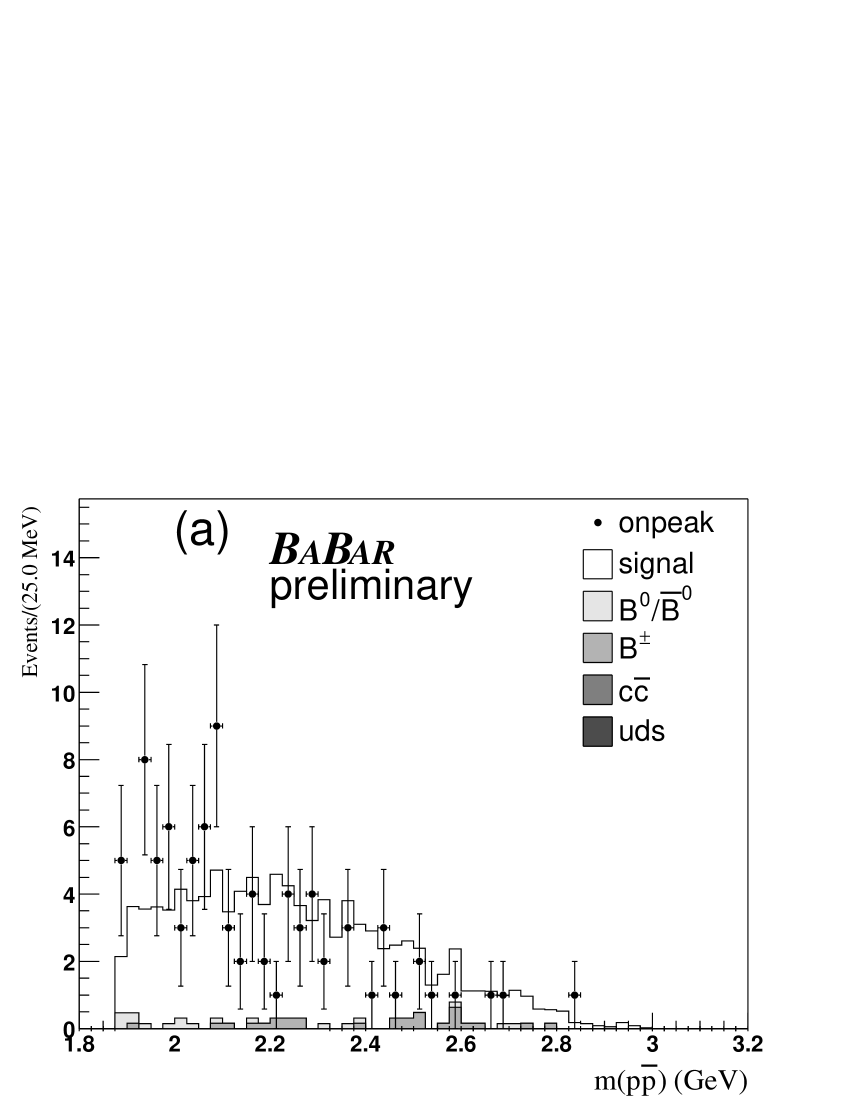
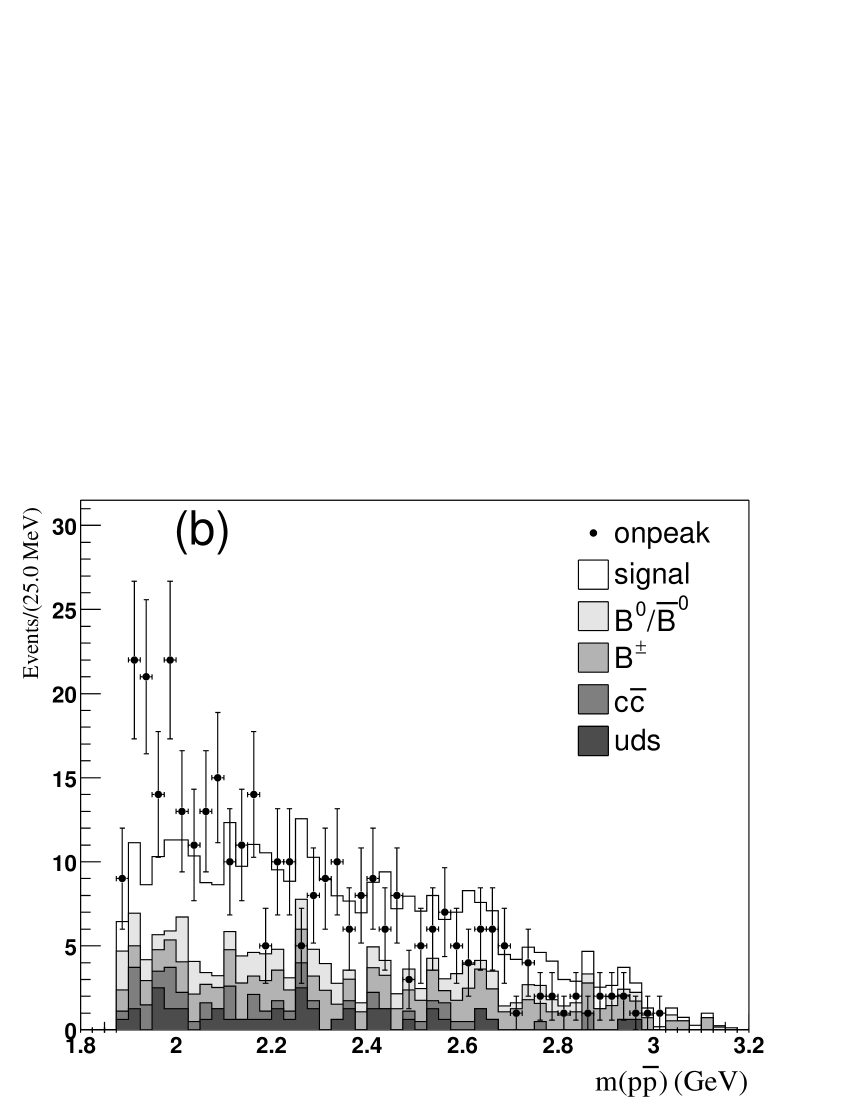
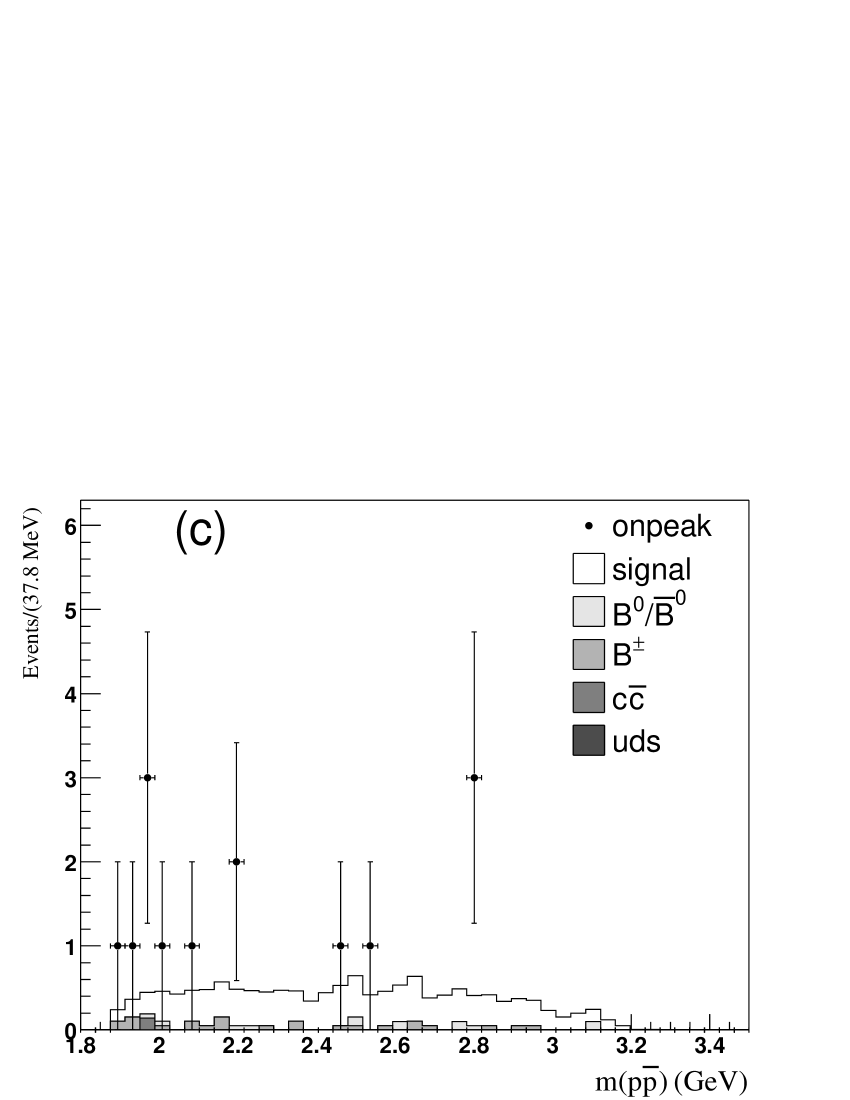
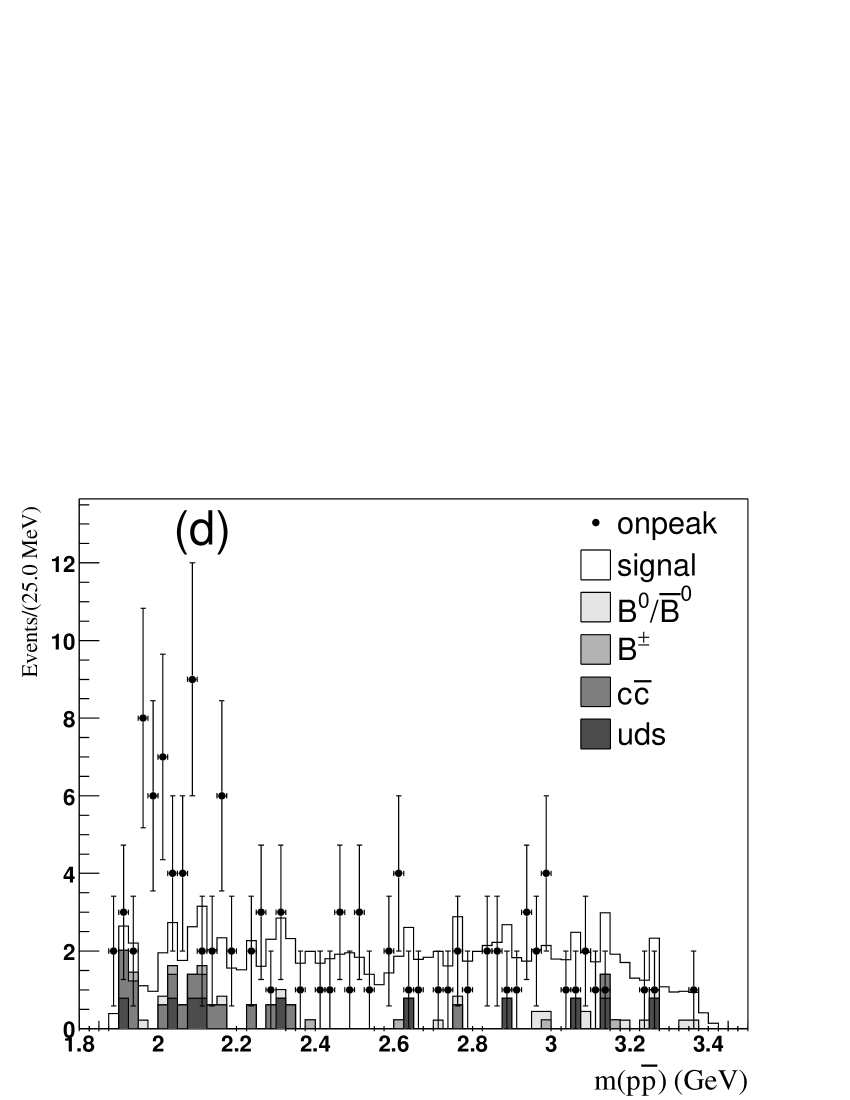
To further compare the observed mass distributions in data with uniform phase space, we show the Dalitz plot distributions for the two three-body decay modes in Figures 7 and 8. The distribution of versus for signal candidates in the mode is shown in Figure 7; the distribution between and for the mode is shown in Figure 8. The triangles and dots correspond to data and the phase space MC simulation. Figure 7 shows a Dalitz plot for the mode . The comparison with the phase space distribution is limited by low statistics. The equivalent plot for the mode , shown in Figure 8, shows a deviation from the pure phase space model. In addition, the Dalitz plots display a threshold enhancement in the invariant mass spectrum. Figure 9 shows the invariant masses of for each decay mode. A threshold enhancement is observed for each decay mode. A similar effect has also been observed by other experiments [2, 16].
The compatibility of data and MC simulation was quantified by means of a Kolmogorov-Smirnov test. Table 2 shows the probabilities of compatibility of data and MC simulation, where the shape of the data points and the MC histograms shown in Figures 3-6 and 9 were compared. The first and second columns correspond to the invariant mass spectra of the relevant -meson and combination (the corresponding minimal quark content is given in parentheses). Charge conjugation is assumed. The last column corresponds to the invariant mass spectra of the system. We draw a number of observations from the calculated probabilities in Table 2. For the first column, the top two rows are marginally consistent with phase space, while the third is consistent, and the last row is inconsistent. The entire second column is consistent with phase space, while in the third column only the third row is consistent, and all others are inconsistent.
| M() | |||
|---|---|---|---|
| 1.32 | 0.83 | 1.22 | |
| M() | |||
| 1.78 | 1.00 | 2.58 | |
| M() | |||
| 0.13 | 0.68 | 0.32 | |
| M() | |||
| 3.51 | 0.77 | 3.26 |
5 SYSTEMATIC STUDIES
| Error source | (in %) | |||
|---|---|---|---|---|
| Event selection | 3.1 | 3.9 | 5.6 | 7.6 |
| Signal model | 3.0 | 3.2 | 9.0 | 0.5 |
| Track finding | 9.2 | 8.4 | 4.8 | 4.8 |
| reconstruction | - | - | 5.6 | - |
| Particle ID | 0.1 | 0.3 | 0.1 | 0.1 |
| Phase space MC | 7.5 | 3.1 | - | - |
| Number of mesons | 1.1 | 1.1 | 1.1 | 1.1 |
| Daughter branching fraction | 2.5 | 6.5 | 5.3 | 2.4 |
| Total | 13.0 | 12.2 | 13.9 | 9.4 |
Systematic uncertainties in the ML fit originate from the modeling of the PDFs. We vary the PDF parameters within their respective uncertainties, and derive the associated systematic errors. The SCF fractions can be floated in the fit to data for the decays and . The differences between MC and data are 8% and 16% for the two decays, respectively. For the systematic uncertainty due to the SCF fraction, we vary the SCF fraction by in the fit according to the above validation from data. We also perform fits to large MC samples with signal and combinatorial background. No bias is observed in these tests.
The systematic errors in the efficiencies are for the track finding (1.2% - 1.4% per track and 2.2% for the slow charged ), particle identification (0.1 - 0.3 %) and reconstruction (5.6%). The systematic error in each decay mode arising from variations of the selection criteria is also shown in Table 3. The reconstruction efficiencies depend on the final state distributions due to decay dynamics. As discussed earlier, we assign 7.5% and 3.1% systematic uncertainties to account for the uncertainty on the efficiencies from the phase-space MC simulation for and four-body decays, respectively. Other systematic effects are from event-selection criteria, daughter branching fractions [12], MC statistics, and the number of mesons in the sample [15]. The contributions to the systematic errors on signal yields are summarized in Table 3.
6 SUMMARY
The meson decay modes , and have been studied in a data sample equivalent 113 fb-1 of integrated luminosity. Table 4 summarizes the branching fractions obtained for the decays , , and . These results are compared with previous measurements performed by the CLEO [1] and Belle [2] collaborations, when possible, and good agreement is found. The decay has been observed for the first time with the branching fraction . All results are preliminary.
| Final state | Significance | Reference | |
|---|---|---|---|
| 13 | [1] | ||
| 13 | - | ||
| 4.0 | [2] | ||
| 12 | [2] |
7 ACKNOWLEDGMENTS
We are grateful for the extraordinary contributions of our PEP-II colleagues in achieving the excellent luminosity and machine conditions that have made this work possible. The success of this project also relies critically on the expertise and dedication of the computing organizations that support BABAR. The collaborating institutions wish to thank SLAC for its support and the kind hospitality extended to them. This work is supported by the US Department of Energy and National Science Foundation, the Natural Sciences and Engineering Research Council (Canada), Institute of High Energy Physics (China), the Commissariat à l’Energie Atomique and Institut National de Physique Nucléaire et de Physique des Particules (France), the Bundesministerium für Bildung und Forschung and Deutsche Forschungsgemeinschaft (Germany), the Istituto Nazionale di Fisica Nucleare (Italy), the Foundation for Fundamental Research on Matter (The Netherlands), the Research Council of Norway, the Ministry of Science and Technology of the Russian Federation, and the Particle Physics and Astronomy Research Council (United Kingdom). Individuals have received support from CONACyT (Mexico), the A. P. Sloan Foundation, the Research Corporation, and the Alexander von Humboldt Foundation.
References
- [1] CLEO Collaboration, S. Anderson et al., Phys. Rev. Lett. 86 (2001) 2732.
- [2] Belle Collaboration, K. Abe et al., Phys. Rev. Lett. 89 (2002) 151802.
- [3] C-K Chua, W-S Hou and S-Y Tsai Phys. Rev. D 65 (2002) 034003.
- [4] W. S. Hou and A. Soni, Phys. Rev. Lett. 86 (2001) 4247.
- [5] I. Dunietz, Phys. Rev. D 58 (1998) 094010.
- [6] E. Fermi and C. N. Yang, Phys. Rev. 76 (1949) 1739.
- [7] J. L. Rosner, Phys. Rev. D 68 (2003) 014004.
- [8] R. Jaffe and F. Wilczek, Phys. Rev. Lett. 91 (2003) 232003.
- [9] S. Armstrong, B. Mellado and Sau Lan Wu, hep-ph/0312344.
- [10] BABAR Collaboration, B. Aubert et al., Nucl. Instrum. Methods A 479, (2002) 1.
- [11] S. Agostinelli et al., Nucl. Instrum. Meth. A 506 (2003) 250.
- [12] Particle Data Group, S. Eidelman et al., Phys. Rev. D 66, 010001 (2002).
- [13] G. C. Fox and S. Wolfram, Phys. Rev. Lett. 41, (1978) 1581.
- [14] ARGUS Collaboration, H. Albrecht et al., Phys. Lett. B 185 (1987) 218.
- [15] BABAR Collaboration, B. Aubert et al., Phys. Rev. D 67, (2003) 032002.
- [16] BES Collaboration, J. Z. Bai et al., Phys. Rev. Lett. 91 (2003) 022001.