M. Ablikim1, J. Z. Bai1, Y. Ban10,
J. G. Bian1, X. Cai1, J. F. Chang1,
H. F. Chen16, H. S. Chen1, H. X. Chen1,
J. C. Chen1, Jin Chen1, Jun Chen6,
M. L. Chen1, Y. B. Chen1, S. P. Chi2,
Y. P. Chu1, X. Z. Cui1, H. L. Dai1,
Y. S. Dai18, Z. Y. Deng1, L. Y. Dong1,
S. X. Du1, Z. Z. Du1, J. Fang1,
S. S. Fang2, C. D. Fu1, H. Y. Fu1,
C. S. Gao1, Y. N. Gao14, M. Y. Gong1,
W. X. Gong1, S. D. Gu1, Y. N. Guo1,
Y. Q. Guo1, Z. J. Guo15, F. A. Harris15,
K. L. He1, M. He11, X. He1,
Y. K. Heng1, H. M. Hu1, T. Hu1,
G. S. Huang1† , L. Huang6, X. P. Huang1,
X. B. Ji1, Q. Y. Jia10, C. H. Jiang1,
X. S. Jiang1, D. P. Jin1, S. Jin1,
Y. Jin1, Y. F. Lai1, F. Li1,
G. Li1, H. H. Li1, J. Li1,
J. C. Li1, Q. J. Li1, R. B. Li1,
R. Y. Li1, S. M. Li1, W. G. Li1,
X. L. Li7, X. Q. Li9, X. S. Li14,
Y. F. Liang13, H. B. Liao5, C. X. Liu1,
F. Liu5, Fang Liu16, H. M. Liu1,
J. B. Liu1, J. P. Liu17, R. G. Liu1,
Z. A. Liu1, Z. X. Liu1, F. Lu1,
G. R. Lu4, J. G. Lu1, C. L. Luo8,
X. L. Luo1, F. C. Ma7, J. M. Ma1,
L. L. Ma11, Q. M. Ma1, X. Y. Ma1,
Z. P. Mao1, X. H. Mo1, J. Nie1,
Z. D. Nie1, S. L. Olsen15, H. P. Peng16,
N. D. Qi1, C. D. Qian12, H. Qin8,
J. F. Qiu1, Z. Y. Ren1, G. Rong1,
L. Y. Shan1, L. Shang1, D. L. Shen1,
X. Y. Shen1, H. Y. Sheng1, F. Shi1,
X. Shi10, H. S. Sun1, S. S. Sun16,
Y. Z. Sun1, Z. J. Sun1, X. Tang1,
N. Tao16, Y. R. Tian14, G. L. Tong1,
G. S. Varner15, D. Y. Wang1, J. Z. Wang1,
K. Wang16, L. Wang1, L. S. Wang1,
M. Wang1, P. Wang1, P. L. Wang1,
S. Z. Wang1, W. F. Wang1, Y. F. Wang1,
Zhe Wang1, Z. Wang1, Zheng Wang1,
Z. Y. Wang1, C. L. Wei1, D. H. Wei3,
N. Wu1, Y. M. Wu1, X. M. Xia1,
X. X. Xie1, B. Xin7, G. F. Xu1,
H. Xu1, Y. Xu1, S. T. Xue1,
M. L. Yan16, F. Yang9, H. X. Yang1,
J. Yang16, S. D. Yang1, Y. X. Yang3,
M. Ye1, M. H. Ye2, Y. X. Ye16,
L. H. Yi6, Z. Y. Yi1, C. S. Yu1,
G. W. Yu1, C. Z. Yuan1, J. M. Yuan1,
Y. Yuan1, Q. Yue1, S. L. Zang1,
Yu. Zeng1,Y. Zeng6, B. X. Zhang1,
B. Y. Zhang1, C. C. Zhang1, D. H. Zhang1,
H. Y. Zhang1, J. Zhang1, J. Y. Zhang1,
J. W. Zhang1, L. S. Zhang1, Q. J. Zhang1,
S. Q. Zhang1, X. M. Zhang1, X. Y. Zhang11,
Y. J. Zhang10, Y. Y. Zhang1, Yiyun Zhang13,
Z. P. Zhang16, Z. Q. Zhang4, D. X. Zhao1,
J. B. Zhao1, J. W. Zhao1, M. G. Zhao9,
P. P. Zhao1, W. R. Zhao1, X. J. Zhao1,
Y. B. Zhao1, Z. G. Zhao1∗, H. Q. Zheng10,
J. P. Zheng1, L. S. Zheng1, Z. P. Zheng1,
X. C. Zhong1, B. Q. Zhou1, G. M. Zhou1,
L. Zhou1, N. F. Zhou1, K. J. Zhu1,
Q. M. Zhu1, Y. C. Zhu1, Y. S. Zhu1,
Yingchun Zhu1, Z. A. Zhu1, B. A. Zhuang1,
B. S. Zou1.
(BES Collaboration)
1 Institute of High Energy Physics, Beijing 100039, People’s Republic of China
2 China Center of Advanced Science and Technology, Beijing 100080,
People’s Republic of China
3 Guangxi Normal University, Guilin 541004, People’s Republic of China
4 Henan Normal University, Xinxiang 453002, People’s Republic of China
5 Huazhong Normal University, Wuhan 430079, People’s Republic of China
6 Hunan University, Changsha 410082, People’s Republic of China
7 Liaoning University, Shenyang 110036, People’s Republic of China
8 Nanjing Normal University, Nanjing 210097, People’s Republic of China
9 Nankai University, Tianjin 300071, People’s Republic of China
10 Peking University, Beijing 100871, People’s Republic of China
11 Shandong University, Jinan 250100, People’s Republic of China
12 Shanghai Jiaotong University, Shanghai 200030, People’s Republic of China
13 Sichuan University, Chengdu 610064, People’s Republic of China
14 Tsinghua University, Beijing 100084, People’s Republic of China
15 University of Hawaii, Honolulu, Hawaii 96822, USA
16 University of Science and Technology of China, Hefei 230026, People’s Republic of China
17 Wuhan University, Wuhan 430072, People’s Republic of China
18 Zhejiang University, Hangzhou 310028, People’s Republic of China
∗ Visiting professor to University of Michigan, Ann Arbor, MI 48109, USA
† Current address: Purdue University, West Lafayette, Indiana 47907, USA
Abstract
Using 58 million events taken
with the BES II detector at the Beijing Electron Positron
Collider, a new decay mode is
observed for the first time. The branching ratio is determined to be
, where
the quoted errors are statistical and systematic, respectively.
pacs:
13.25.Gv, 14.40.Gx, 13.40.Hq
I Introduction
Precise branching ratios are needed in order to better understand
physics. Unfortunately, only about 50 to 60% of
decay modes have been observed so far pdg . A sample of 58
million events has been accumulated with the upgraded Beijing
Spectrometer (BES II). With this sample, the world’s largest, it is
possible to systematically study decays.
For the decay , studies have been done by MARK III
mark3 ; Adler:1988kg , DM2 dm2 and BES
Bai:1999mm ; besetac . A large part of the final state is
from mark3 . MARK III also reported the
observation of
Adler:1988kg . In this paper, evidence for the decay
is observed, and the branching ratio of
is measured for the first time.
II BES Detector
BES is a conventional solenoidal magnet
detector bes ; bes2 .
A 12-layer vertex chamber (VTC)
surrounding the beam pipe provides trigger and trajectory information. A
forty-layer main drift chamber (MDC), located radially outside the
VTC, provides trajectory and energy loss () information for
charged tracks over of the total solid angle with a
momentum resolution of ( in
) and a resolution for hadron tracks of
. An array of 48 scintillation counters surrounding the
MDC measures the time-of-flight (TOF) of charged tracks with a
resolution of ps for hadrons. Radially outside the TOF
system is a 12 radiation length, lead-gas barrel shower counter
(BSC). This measures the energies of electrons and photons over
of the total solid angle with an energy resolution of
( in GeV). Outside the solenoidal
coil, which provides a 0.4 Tesla magnetic field over the tracking
volume, is an iron flux return that is instrumented with three
double layers of proportional counters that identify muons of momentum greater
than 0.5 GeV/c.
A Geant3 based Monte Carlo, SIMBES, which simulates the
detector response, including interactions of secondary particles
in the detector material, is used in this analysis.
Reasonable agreement between data and Monte Carlo simulation is
observed in various channels tested, including , , ,
and ,
.
III Event Selection
First a
sample is selected. Events are
required to have four good charged tracks and one or more photon
candidates. A good track, reconstructed from hits in the MDC, must be
well fitted to a helix originating from the interaction point; have a
polar angle, , with ; and a transverse
momentum greater than 60 MeV.
The TOF and information are used for particle
identification. To identify pions, we define:
Here denotes , and . If the charged track has only
TOF information or only information, then is
determined using that system only. To identify a pion, it is required
that: and . At least three
tracks must be identified as pions.
To reduce the number of spurious low energy photons produced by
secondary hadronic interactions, photon candidates must have a minimum
energy of 30 MeV and be outside a cone with a half-angle of
around any charged track.
To get higher momentum resolution and to remove backgrounds, events
are kinematically fitted to the hypothesis, looping
over all photon candidates. The fit with the highest probability is
selected, and the of the fit is required to be less than 20.
For decay, a major source of background is from
. To remove events containing a when there
are multiple photons, is required if
is in the plane of the two photons,
and , i.e. . Here is the unit vector of the
missing momentum of all charged tracks; and
are unit vectors in the and directions, respectively; and is the
invariant mass of and . Two additional
requirements, and
, are used to further remove background. is the transverse momentum of
the system with respect to the photon. Finally, the
requirement GeV is used to
reject events with multiple photons and charged kaons; here,
and are, respectively, the missing energy and
missing momentum calculated using only the charged particles, which
are assumed to be pions.
There are other possible backgrounds such as ,
, and .
The background is eliminated by the requirement
, where the in is
associated to the missing momentum and energy determined using only
the charged tracks. To remove the background, we
require for both
pairs. To remove the background from , events are rejected if when
.
Figure 1(a) shows the scatter plot of
versus for surviving events with
, where () and
() are the
and with the higher (lower) momentum. There is a clear signal near
(, ). Since according to Monte Carlo study
most events from have
invariant mass greater than 2.6 GeV, the
scatter plot of versus with
is shown in Fig. 1(b). An
obvious cluster near (, ) is seen besides the
signal near (, ).
There is another possible versus
combination, which is versus . Monte
Carlo studies of and
show that the and signal almost always appears
in the versus combination. Therefore we
use the versus combination to study
decay. The and
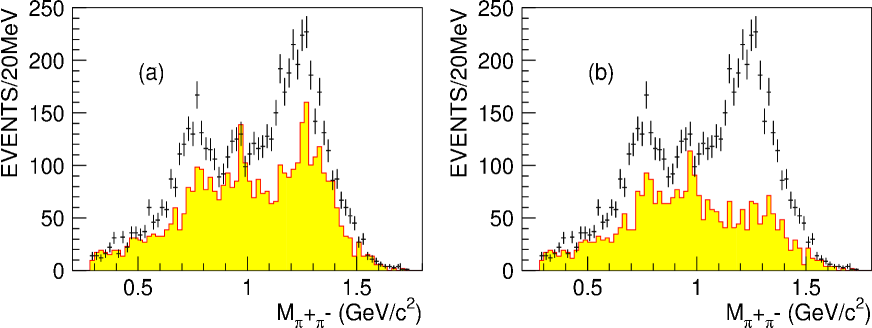
distributions for are shown in Fig.
1(c) and Fig. 1(d) respectively. Besides the
peak, a peak near
(1.275 GeV) can be clearly seen in both of these plots.
Figure 1: (a) versus for
. (b)
versus for . (c)
and
(d) distributions with .
IV Background Analysis
Possible backgrounds are studied using simulated exclusive channels
normalized according to Particle Data Group (PDG) branching ratios, as
well as a 30 million event inclusive decay Monte Carlo sample
generated with Lundcharm chenjc .
Simulated exclusive decays studied are , ,
, , , and
, where events are generated according to
phase space and normalized by PDG pdg branching ratios. After passing the
simulated events through our selection criteria, no
signal remains from these channels.
Figure 2: The spectra from data and
inclusive decay Monte Carlo data, which are
the sum of and .
The dots with error bars are data, the shaded histogram is
from inclusive decay Monte Carlo data. (a) Including . (b) removed.
Fig. 2 shows the spectra
from data and from 30 million inclusive Monte Carlo decays
normalized to 58 million events, where
is required to be greater than 2.6 GeV and the invariant mass
of the other pair satisfies
. This
spectrum is used to fit the signal in Section
V. In Fig. 2(a), there is an signal
from decays from the inclusive Monte Carlo sample. After
removing this channel, there is no signal left in the
inclusive decay Monte Carlo events, as shown in
Fig. 2(b). So the signal in the spectrum
of inclusive Monte Carlo decays is caused by .
Although decay is not listed in the PDG, we observe
this decay in , and it gives a
background in the spectrum of . There is
an signal in the distribution of
when a mass requirement is made on the other
pair. The number of fitted events in this
distribution is 2111, and the efficiency, obtained by a Monte Carlo
simulation, for this selection is 0.67%. The number
of events is , which is used to determine the amount of
background in the spectrum of .
V Results and Systematic Errors
The spectrum for events with and with
one pair satisfying is
used to obtain the number of events.
The mass
spectrum is fitted with a , a , and
a 2nd order polynomial background plus
background using a binned maximum likelihood fit. The mass and width
of the are fixed at the PDG
values. The shape of the is determined by Monte Carlo simulation for (, ).
The shape of the background is determined by Monte Carlo simulation of and
normalized to the estimated number of background events. The fitting result
is shown in Fig. 3. The spectrum is
the sum of the and the
spectra. The fitted number of
component in the spectrum is 1292 (both
projections are used).
Figure 3: Fit of the
spectrum to obtain the signal. The light shaded area is the 2nd order polynomial
background. The dark shaded area is background. The
two peaks are and , respectively.
The branching ratio of can be determined with
the following formula:
where =646(=1292/2) is the average number of survived
events in projection and projection,
is the
efficiency determined from phase space
Monte Carlo events with the same cuts used to select
data sample,
is the total
number of events collected by BES II
fangss , and is the
branching ratio of pdg .
Table 1: Summary of systematic errors
Sources
Systematic error ()
MDC tracking efficiency
8
PID efficiency
3
Photon selection
2
Kinematic fit
4
The number of events
4.7
width
5.1
Cut
9.7
Background uncertainty
5.5
2.8
Total
16.5
Many sources of systematic errors are considered. Systematic
errors associated with efficiencies, such as from the MDC
tracking, particle identification,
photon selection, and kinematic fitting, are determined by
comparing and data with Monte Carlo simulation for very
clean decay channels, such as .
The MDC tracking efficiency has been measured using channels
like and , . It is found
that the efficiency of the Monte Carlo simulation agrees
with that of data within 1-2% per charged track. The
total systematic error from the uncertainty of MDC tracking
efficiency in our analysis is
taken as 8%.
The particle identification (PID) efficiency systematic error is calculated by comparing the
efficiency of data with that of Monte Carlo. The
largest difference between these two efficiencies is within
3%.
According to the study of photon detection efficiency in
lismfangss , SIMBES
simulates the photon detection efficiency in the full energy
range within 1 to 3%. Here, we take 2% as the
systematic error in the photon detection efficiency.
The systematic error for the kinematic fit is caused by the
differences between data and simulated data in the momenta and the
error matrices of charged tracks and the energies and the directions
of neutral tracks. To check the consistency between data and
Monte Carlo simulation, two channels, and
, are analyzed for 2-prong and
4-prong events respectively. The systematic error for 4-prong events
caused by kinematic fit is determined to be 4%.
Other sources of systematic errors come from the uncertainty
of , the width, the requirement, and the
uncertainty of the
background. The total number is determined from 4-prong events fangss .
The width of the is MeV pdg ; 185.1 MeV is used in
the Monte Carlo simulation. To estimate the systematic error caused by
the width of , 188.5 MeV and 182.5 MeV are also tried. After refitting the mass spectrum
of Fig. 3, the relative differences of the branching ratios determined by
using these two widths compared with the original one are 5.1% and -3.5% respectively. The systematic
error caused by the width is taken as 5.1%.
The requirement
is used to select events for
the determination of
. The spectra of real data and
Monte Carlo events are somewhat different. To estimate the
systematic error caused by this requirement, we calculate
with and compare
the result with that obtained with . The
relative difference is 9.7%, and this is taken as one of the
systematic errors.
The background systematic error is caused by
the uncertainty in the background.
This uncertainty is
determined by varying the selection criteria
used to obtain the number of events.
The systematic error caused by the uncertainty of
background is 5.5%.
Table 1 lists all the systematic errors, as well as the
total systematic error of 16.5%, obtained by adding all
contributions in quadrature. The branching ratio of
is
where the first error is statistical and the second
systematic. This branching ratio includes contributions from
intermediate states such as .
VI Summary
A new decay mode is observed,
and its branching ratio is measured to be
. This result will be helpful to understand the complex
decay.
VII Acknowledgment
The BES collaboration thanks the staff of BEPC for their
hard efforts. This work is supported in part by the
National Natural Science Foundation of China under contracts
Nos. 19991480,10225524, 10225525, the Chinese Academy of
Sciences under contract No. KJ 95T-03, the 100 Talents
Program of CAS under Contract Nos. U-11, U-24, U-25, and
the Knowledge Innovation Project of CAS under Contract
Nos. U-602, U-34 (IHEP); by the National Natural Science
Foundation of China under Contract No.10175060 (USTC), and
No.10225522 (Tsinghua University); and by the Department of
Energy under Contract No.DE-FG03-94ER40833 (U Hawaii).
References
(1)
S. Eidelman et al. (Particle Data Group), Phys. Letts. B592, 1 (2004).
(2) R. M. Baltrusaitis et
al., Phys. Rev. D33, 1222 (1986).
(3)
J. Adler et al. (Mark-III Collaboration),
SLAC-PUB-4686,
Submitted to 24th Int. Conf. on High Energy Physics, Munich, Germany, Aug 4-10, 1988.
(4) D. Bisello et
al., Phys. Lett. B200, 215 (1988).
(5)
J. Z. Bai et al. (BES Collaboration),
Phys. Lett. B472, 207 (2000).
(6) J. Z. Bai et al. (BES
Collaboration), Phys. Lett. B555, 174 (2003).
(7) J. Z. Bai et al. (BES
Collaboration), Nucl. Instr. Meth. A344, 319 (1994).
(8) J. Z. Bai et al. (BES
Collaboration), Nucl. Instr. Meth. A458, 627 (2001).
(9) J. C. Chen et
al., Phys. Rev. D62, 034003 (2000).
(10) S. S. Fang et al., High Energy Phys. Nucl. Phys.
27, 277 (2003) (in Chinese).
(11) S.M. Li et al., High Energy Phys. Nucl. Phys. 28, 64 (2004) (in
Chinese).