Dissociation of virtual photons in events with a leading proton at HERA

ZEUS Collaboration
Abstract

The ZEUS detector has been used to study dissociation of virtual photons in events with a leading proton, γpXpsuperscript𝛾𝑝𝑋𝑝\gamma^{\star}p\to Xp, in e+psuperscript𝑒𝑝e^{+}p collisions at HERA. The data cover photon virtualities in two ranges, 0.03<Q2<0.600.03superscript𝑄20.600.03<Q^{2}<0.60 GeV2 and 2<Q2<1002superscript𝑄21002<Q^{2}<100 GeV2, with MX>1.5subscript𝑀𝑋1.5M_{X}>1.5 GeV, where MXsubscript𝑀𝑋M_{X} is the mass of the hadronic final state, X𝑋X. Events were required to have a leading proton, detected in the ZEUS leading proton spectrometer, carrying at least 90% of the incoming proton energy. The cross section is presented as a function of t𝑡t, the squared four-momentum transfer at the proton vertex, ΦΦ\Phi, the azimuthal angle between the positron scattering plane and the proton scattering plane, and Q2superscript𝑄2Q^{2}. The data are presented in terms of the diffractive structure function, F2D(3)superscriptsubscript𝐹2𝐷3F_{2}^{D(3)}. A next-to-leading-order QCD fit to the higher-Q2superscript𝑄2Q^{2} data set and to previously published diffractive charm production data is presented.

\prepnum

DESY-04-131

\makezeustitle

The ZEUS Collaboration

S. Chekanov, M. Derrick, J.H. Loizides1, S. Magill, S. Miglioranzi1, B. Musgrave, J. Repond, R. Yoshida
Argonne National Laboratory, Argonne, Illinois 60439-4815, USA n

M.C.K. Mattingly
Andrews University, Berrien Springs, Michigan 49104-0380, USA

N. Pavel
Institut für Physik der Humboldt-Universität zu Berlin, Berlin, Germany

P. Antonioli, G. Bari, M. Basile, L. Bellagamba, D. Boscherini, A. Bruni, G. Bruni, G. Cara Romeo, L. Cifarelli, F. Cindolo, A. Contin, M. Corradi, S. De Pasquale, P. Giusti, G. Iacobucci, A. Margotti, T. Massam, A. Montanari, R. Nania, F. Palmonari, A. Pesci, A. Polini, L. Rinaldi, G. Sartorelli, A. Zichichi
University and INFN Bologna, Bologna, Italy e

G. Aghuzumtsyan, D. Bartsch, I. Brock, S. Goers, H. Hartmann, E. Hilger, P. Irrgang, H.-P. Jakob, O. Kind, U. Meyer, E. Paul2, J. Rautenberg, R. Renner, J. Tandler3, K.C. Voss, M. Wang
Physikalisches Institut der Universität Bonn, Bonn, Germany b

D.S. Bailey4, N.H. Brook, J.E. Cole, G.P. Heath, T. Namsoo, S. Robins, M. Wing
H.H. Wills Physics Laboratory, University of Bristol, Bristol, United Kingdom m

M. Capua, L. Iannotti5, A. Mastroberardino, M. Schioppa, G. Susinno
Calabria University, Physics Department and INFN, Cosenza, Italy e

J.Y. Kim, I.T. Lim, K.J. Ma, M.Y. Pac6
Chonnam National University, Kwangju, South Korea g

M. Helbich, Y. Ning, Z. Ren, W.B. Schmidke, F. Sciulli
Nevis Laboratories, Columbia University, Irvington on Hudson, New York 10027 o

J. Chwastowski, A. Eskreys, J. Figiel, A. Galas, K. Olkiewicz, P. Stopa, L. Zawiejski
Institute of Nuclear Physics, Cracow, Poland i

L. Adamczyk, T. Bołd, I. Grabowska-Bołd7, D. Kisielewska, A.M. Kowal, J. Łukasik, M. Przybycień, L. Suszycki, D. Szuba, J. Szuba8
Faculty of Physics and Nuclear Techniques, AGH-University of Science and Technology, Cracow, Poland p

A. Kotański9, W. Słomiński
Department of Physics, Jagellonian University, Cracow, Poland

V. Adler, U. Behrens, I. Bloch, K. Borras, D. Dannheim10, G. Drews, J. Fourletova, U. Fricke, A. Geiser, D. Gladkov, P. Göttlicher11, O. Gutsche, T. Haas, W. Hain, C. Horn, B. Kahle, U. Kötz, H. Kowalski, G. Kramberger, H. Labes, D. Lelas12, H. Lim, B. Löhr, R. Mankel, I.-A. Melzer-Pellmann, C.N. Nguyen, D. Notz, A.E. Nuncio-Quiroz, A. Raval, U. Schneekloth, A. Stifutkin, U. Stösslein, G. Wolf, C. Youngman, W. Zeuner
Deutsches Elektronen-Synchrotron DESY, Hamburg, Germany

S. Schlenstedt
Deutsches Elektronen-Synchrotron DESY, Zeuthen, Germany

G. Barbagli, E. Gallo, C. Genta, P. G. Pelfer
University and INFN, Florence, Italy e

A. Bamberger, A. Benen, F. Karstens, D. Dobur, N.N. Vlasov13
Fakultät für Physik der Universität Freiburg i.Br., Freiburg i.Br., Germany b

P.J. Bussey, A.T. Doyle, J. Ferrando, J. Hamilton, S. Hanlon, D.H. Saxon, I.O. Skillicorn
Department of Physics and Astronomy, University of Glasgow, Glasgow, United Kingdom m

I. Gialas14
Department of Engineering in Management and Finance, Univ. of Aegean, Greece

T. Carli, T. Gosau, U. Holm, N. Krumnack, E. Lohrmann, M. Milite, H. Salehi, P. Schleper, T. Schörner-Sadenius, S. Stonjek15, K. Wichmann, K. Wick, A. Ziegler, Ar. Ziegler
Hamburg University, Institute of Exp. Physics, Hamburg, Germany b

C. Collins-Tooth16, C. Foudas, R. Gonçalo17, K.R. Long, A.D. Tapper
Imperial College London, High Energy Nuclear Physics Group, London, United Kingdom m

P. Cloth, D. Filges
Forschungszentrum Jülich, Institut für Kernphysik, Jülich, Germany

M. Kataoka18, K. Nagano, K. Tokushuku19, S. Yamada, Y. Yamazaki
Institute of Particle and Nuclear Studies, KEK, Tsukuba, Japan f

A.N. Barakbaev, E.G. Boos, N.S. Pokrovskiy, B.O. Zhautykov
Institute of Physics and Technology of Ministry of Education and Science of Kazakhstan, Almaty, Kazakhstan

D. Son
Kyungpook National University, Center for High Energy Physics, Daegu, South Korea g

J. de Favereau, K. Piotrzkowski
Institut de Physique Nucléaire, Université Catholique de Louvain, Louvain-la-Neuve, Belgium

F. Barreiro, C. Glasman20, O. González, L. Labarga, J. del Peso, E. Tassi, J. Terrón, M. Zambrana
Departamento de Física Teórica, Universidad Autónoma de Madrid, Madrid, Spain l

M. Barbi, F. Corriveau, C. Liu, S. Padhi, M. Plamondon, D.G. Stairs, R. Walsh, C. Zhou
Department of Physics, McGill University, Montréal, Québec, Canada H3A 2T8 a

T. Tsurugai
Meiji Gakuin University, Faculty of General Education, Yokohama, Japan f

A. Antonov, P. Danilov, B.A. Dolgoshein, V. Sosnovtsev, S. Suchkov
Moscow Engineering Physics Institute, Moscow, Russia j

R.K. Dementiev, P.F. Ermolov, I.I. Katkov, L.A. Khein, I.A. Korzhavina, V.A. Kuzmin, B.B. Levchenko, O.Yu. Lukina, A.S. Proskuryakov, L.M. Shcheglova, S.A. Zotkin
Moscow State University, Institute of Nuclear Physics, Moscow, Russia k

I. Abt, C. Büttner, A. Caldwell, X. Liu, J. Sutiak
Max-Planck-Institut für Physik, München, Germany

N. Coppola, G. Grigorescu, S. Grijpink, A. Keramidas, E. Koffeman, P. Kooijman, E. Maddox, A. Pellegrino, S. Schagen, H. Tiecke, M. Vázquez, L. Wiggers, E. de Wolf
NIKHEF and University of Amsterdam, Amsterdam, Netherlands h

N. Brümmer, B. Bylsma, L.S. Durkin, T.Y. Ling
Physics Department, Ohio State University, Columbus, Ohio 43210 n

P.D. Allfrey, M.A. Bell, A.M. Cooper-Sarkar, A. Cottrell, R.C.E. Devenish, B. Foster, G. Grzelak, C. Gwenlan21, T. Kohno, S. Patel, P.B. Straub, R. Walczak
Department of Physics, University of Oxford, Oxford United Kingdom m

P. Bellan, A. Bertolin, R. Brugnera, R. Carlin, R. Ciesielski, F. Dal Corso, S. Dusini, A. Garfagnini, S. Limentani, A. Longhin, A. Parenti, M. Posocco, L. Stanco, M. Turcato
Dipartimento di Fisica dell’ Università and INFN, Padova, Italy e

E.A. Heaphy, F. Metlica, B.Y. Oh, J.J. Whitmore22
Department of Physics, Pennsylvania State University, University Park, Pennsylvania 16802 o

Y. Iga
Polytechnic University, Sagamihara, Japan f

G. D’Agostini, G. Marini, A. Nigro
Dipartimento di Fisica, Università ’La Sapienza’ and INFN, Rome, Italy e𝑒{}^{e}\leavevmode\nobreak\

J.C. Hart
Rutherford Appleton Laboratory, Chilton, Didcot, Oxon, United Kingdom m

D. Epperson23, C. Heusch, H. Sadrozinski, A. Seiden, R. Wichmann24, D.C. Williams
University of California, Santa Cruz, California 95064, USA n

I.H. Park25
Department of Physics, Ewha Womans University, Seoul, Korea

H. Abramowicz26, A. Gabareen, M. Groys, S. Kananov, A. Kreisel, A. Levy
Raymond and Beverly Sackler Faculty of Exact Sciences, School of Physics, Tel-Aviv University, Tel-Aviv, Israel d

M. Kuze
Department of Physics, Tokyo Institute of Technology, Tokyo, Japan f

T. Fusayasu, S. Kagawa, T. Tawara, T. Yamashita
Department of Physics, University of Tokyo, Tokyo, Japan f

R. Hamatsu, T. Hirose2, M. Inuzuka, H. Kaji, S. Kitamura27, K. Matsuzawa
Tokyo Metropolitan University, Department of Physics, Tokyo, Japan f

N. Cartiglia, R. Cirio, M. Costa, M.I. Ferrero, S. Maselli, V. Monaco, C. Peroni, M.C. Petrucci28, R. Sacchi, A. Solano, A. Staiano
Università di Torino and INFN, Torino, Italy e

M. Arneodo, M. Ruspa
Università del Piemonte Orientale, Novara, and INFN, Torino, Italy e

S. Fourletov, T. Koop, J.F. Martin, A. Mirea
Department of Physics, University of Toronto, Toronto, Ontario, Canada M5S 1A7 a

J.M. Butterworth29, R. Hall-Wilton, T.W. Jones, M.R. Sutton4, C. Targett-Adams
Physics and Astronomy Department, University College London, London, United Kingdom m

J. Ciborowski30, P. Łużniak31, R.J. Nowak, J.M. Pawlak, J. Sztuk32, T. Tymieniecka, A. Ukleja, J. Ukleja33, A.F. Żarnecki
Warsaw University, Institute of Experimental Physics, Warsaw, Poland

M. Adamus, P. Plucinski
Institute for Nuclear Studies, Warsaw, Poland

Y. Eisenberg, D. Hochman, U. Karshon, M.S. Lightwood, M. Riveline
Department of Particle Physics, Weizmann Institute, Rehovot, Israel c

A. Everett, L.K. Gladilin34, D. Kçira, S. Lammers, L. Li, D.D. Reeder, M. Rosin, P. Ryan, A.A. Savin, W.H. Smith
Department of Physics, University of Wisconsin, Madison, Wisconsin 53706, USA n

S. Dhawan
Department of Physics, Yale University, New Haven, Connecticut 06520-8121, USA n

S. Bhadra, C.D. Catterall, G. Hartner, S. Menary, U. Noor, M. Soares, J. Standage, J. Whyte, C. Ying
Department of Physics, York University, Ontario, Canada M3J 1P3 a

1 also affiliated with University College London, UK
2 retired
3 self-employed
4 PPARC Advanced fellow
5 now at Consoft Sistemi s.r.l., Torino, Italy
6 now at Dongshin University, Naju, South Korea
7 partly supported by Polish Ministry of Scientific Research and Information Technology, grant no. 2P03B 12225
8 partly supported by Polish Ministry of Scientific Research and Information Technology, grant no.2P03B 12625
9 supported by the Polish State Committee for Scientific Research, grant no. 2 P03B 09322
10 now at Columbia University, N.Y., USA
11 now at DESY group FEB, Hamburg, Germany
12 now at LAL, Université de Paris-Sud, IN2P3-CNRS, Orsay, France
13 partly supported by Moscow State University, Russia
14 also affiliated with DESY
15 now at University of Oxford, UK
16 now at the Department of Physics and Astronomy, University of Glasgow, UK
17 now at Royal Holloway University of London, UK
18 also at Nara Women’s University, Nara, Japan
19 also at University of Tokyo, Japan
20 Ramón y Cajal Fellow
21 PPARC Postdoctoral Research Fellow
22 on leave of absence at The National Science Foundation, Arlington, VA, USA
23 now at California Polytechnic State University, San Luis Obisbo, USA
24 now at DESY, Hamburg, Germany
25 supported by the Intramural Research Grant of Ewha Womans University
26 also at Max Planck Institute, Munich, Germany, Alexander von Humboldt Research Award
27 present address: Tokyo Metropolitan University of Health Sciences, Tokyo 116-8551, Japan
28 now at University of Perugia, Perugia, Italy
29 also at University of Hamburg, Alexander von Humboldt Fellow
30 also at Łódź University, Poland
31 Łódź University, Poland
32 Łódź University, Poland, supported by the KBN grant 2P03B12925
33 supported by the KBN grant 2P03B12725
34 on leave from Moscow State University, Russia, partly supported by the Weizmann Institute via the U.S.-Israel Binational Science Foundation

a supported by the Natural Sciences and Engineering Research Council of Canada (NSERC)
b supported by the German Federal Ministry for Education and Research (BMBF), under contract numbers HZ1GUA 2, HZ1GUB 0, HZ1PDA 5, HZ1VFA 5
c supported in part by the MINERVA Gesellschaft für Forschung GmbH, the Israel Science Foundation (grant no. 293/02-11.2), the U.S.-Israel Binational Science Foundation and the Benozyio Center for High Energy Physics
d supported by the German-Israeli Foundation and the Israel Science Foundation
e supported by the Italian National Institute for Nuclear Physics (INFN)
f supported by the Japanese Ministry of Education, Culture, Sports, Science and Technology (MEXT) and its grants for Scientific Research
g supported by the Korean Ministry of Education and Korea Science and Engineering Foundation
h supported by the Netherlands Foundation for Research on Matter (FOM)
i supported by the Polish State Committee for Scientific Research, grant no. 620/E-77/SPB/DESY/P-03/DZ 117/2003-2005
j partially supported by the German Federal Ministry for Education and Research (BMBF)
k supported by RF President grant N 1685.2003.2 for the leading scientific schools and by the Russian Ministry of Industry, Science and Technology through its grant for Scientific Research on High Energy Physics
l supported by the Spanish Ministry of Education and Science through funds provided by CICYT
m supported by the Particle Physics and Astronomy Research Council, UK
n supported by the US Department of Energy
o supported by the US National Science Foundation
p supported by the Polish Ministry of Scientific Research and Information Technology, grant no. 112/E-356/SPUB/DESY/P-03/DZ 116/2003-2005

1 Introduction

In diffractive processes in hadron-hadron or photon-hadron collisions, the initial state particles undergo a “peripheral” collision, in which either the particles stay intact (elastic scattering), or they dissociate into low-mass states (diffractive dissociation). The scattered hadrons (or the low-mass states in the dissociative case) have energy equal, to within a few per cent, to that of the incoming hadron, and very small transverse momentum. Diffractive interactions can be parameterised in the framework of Regge phenomenology, where they are ascribed to the exchange of a trajectory with the vacuum quantum numbers, the Pomeron trajectory [1]. In the same framework, events in which the proton loses a more substantial fraction of its energy are ascribed to the exchange of subleading trajectories.

Significant progress has recently been made in understanding diffraction in terms of QCD, notably by studying the diffractive dissociation of virtual photons in electron-proton or positron-proton collisions at HERA. In fact, diffraction has proven to be a tool to study QCD and the low-x𝑥x structure of the proton [2, 3]. In the proton’s rest frame, diffractive ep𝑒𝑝ep scattering, epeXp𝑒𝑝𝑒𝑋𝑝ep\rightarrow eXp, proceeds from the fluctuation of the virtual photon emitted by the electron (or by the positron) into a colour dipole, such as a quark-antiquark pair or a quark-antiquark-gluon system. The dipole interacts hadronically with the proton via the exchange of an object with vacuum quantum numbers – a gluon pair, in leading-order QCD – and then dissociates into the hadronic state, X𝑋X. The dipole has transverse dimensions which decrease as the photon virtuality, Q2superscript𝑄2Q^{2}, increases. It is thus possible to study diffractive interactions in a regime where one of the two interacting hadrons is so small that the strong interaction can be treated perturbatively. Alternatively, in a frame in which the proton is fast, the reaction can be seen as the deep inelastic scattering (DIS) of a pointlike virtual photon off the exchanged object. This gives access to the diffractive parton distribution functions (PDF), for which a QCD factorisation theorem has been proven [4, 5, *qcdf1, 7]. Diffractive PDFs are defined as the proton PDFs probed when the vacuum quantum numbers are exchanged and the proton emerges intact from the interaction, suffering only a small energy loss. In the context of QCD, Pomeron exchange should then be understood as a synonym for exchange of partons from the proton with the vacuum quantum numbers.

This paper presents new measurements of the reaction e+pe+Xpsuperscript𝑒𝑝superscript𝑒𝑋𝑝e^{+}p\rightarrow e^{+}Xp in the regions 0.03<Q2<0.600.03superscript𝑄20.600.03<Q^{2}<0.60 GeV2 (low-Q2superscript𝑄2Q^{2} sample) and 2<Q2<1002superscript𝑄21002<Q^{2}<100 GeV2 (high-Q2superscript𝑄2Q^{2} sample) 111In the following, for simplicity, the symbol e𝑒e will be used to denote both electrons and positrons.. The measurements were made using the ZEUS detector at the HERA ep𝑒𝑝ep collider. The events were selected by requiring the detection in the ZEUS leading proton spectrometer (LPS) of a scattered proton, carrying a fraction xLsubscript𝑥𝐿x_{L} of the incoming proton momentum of at least 0.90.90.9; such fast protons are referred to as leading. This xLsubscript𝑥𝐿x_{L} range includes the so-called diffractive peak, the narrow peak in the cross section at xL1subscript𝑥𝐿1x_{L}\approx 1 ascribed to Pomeron exchange, as well as the transition to the lower xLsubscript𝑥𝐿x_{L} region in which subleading, mesonic exchanges, notably Reggeons, are thought to dominate [1, 3]. The measurement covers the region 0.075<|t|<0.350.075𝑡0.350.075<|t|<0.35 GeV2, where t𝑡t is the square of the four-momentum transferred at the proton vertex.

Sections 2-9 present the experimental set-up and the details of the analysis. Section 10 gives the results. The t𝑡t and ΦΦ\Phi dependences of the cross section are discussed first, where ΦΦ\Phi is the azimuthal angle between the positron and the proton scattering planes in the γpsuperscript𝛾𝑝\gamma^{*}p rest frame. The distribution of ΦΦ\Phi is sensitive to the interference between the amplitudes for scattering of longitudinally and transversely polarised photons, and thus to the helicity structure of the interaction. The Q2superscript𝑄2Q^{2} dependence of the photon-proton differential cross-section dσγpXp/dMX𝑑superscript𝜎superscript𝛾𝑝𝑋𝑝𝑑subscript𝑀𝑋d\sigma^{\gamma^{*}p\rightarrow Xp}/dM_{X} is then studied for different values of the photon-proton centre-of-mass energy, W𝑊W. The data are also discussed in terms of the diffractive structure function, F2D(3)superscriptsubscript𝐹2𝐷3F_{2}^{D(3)}. The dependence of F2D(3)superscriptsubscript𝐹2𝐷3F_{2}^{D(3)} on xIPsubscript𝑥𝐼𝑃x_{I\!\!P} is studied, where xIPsubscript𝑥𝐼𝑃x_{I\!\!P} is the fraction of the proton momentum carried by the object (the Pomeron or the Reggeon, in the Regge framework) exchanged between the virtual photon and the proton, xIP1xLsimilar-to-or-equalssubscript𝑥𝐼𝑃1subscript𝑥𝐿x_{I\!\!P}\simeq 1-x_{L}. The Q2superscript𝑄2Q^{2} and β𝛽\beta dependences of F2D(3)superscriptsubscript𝐹2𝐷3F_{2}^{D(3)} for different values of xIPsubscript𝑥𝐼𝑃x_{I\!\!P} are investigated, and the behaviour of F2D(3)superscriptsubscript𝐹2𝐷3F_{2}^{D(3)} is compared to that of the inclusive proton structure function, F2subscript𝐹2F_{2}. The variable β𝛽\beta is the Bjorken variable defined with respect to the four-momentum of the exchanged object. The results are compared to theoretical predictions based on the colour-dipole approach outlined above. Finally, a next-to-leading-order (NLO) QCD fit to the higher-Q2superscript𝑄2Q^{2} data is presented.

The present data correspond to an integrated luminosity about a factor four larger than that of the previous ZEUS-LPS analysis [8]. The low-Q2superscript𝑄2Q^{2} results have a wider Q2superscript𝑄2Q^{2} and W𝑊W coverage than that studied so far with the LPS or other methods [8, 9]. The ΦΦ\Phi distribution is investigated for the first time. The cross section is measured up to MXsubscript𝑀𝑋M_{X} values of 40 GeV, so far unexplored, and F2D(3)superscriptsubscript𝐹2𝐷3F_{2}^{D(3)} is presented up to xIPsubscript𝑥𝐼𝑃x_{I\!\!P} values of 0.07, thus covering the diffractive-peak region (xIP< 0.02subscript𝑥𝐼𝑃<0.02x_{I\!\!P}\leavevmode\nobreak\ \raisebox{-2.79857pt}{\hbox to0.0pt{$\sim$\hss}}\raisebox{1.72218pt}{$<$}\leavevmode\nobreak\ 0.02) and the transition to the non-diffractive region that is dominated by subleading exchanges.

It is also possible to select diffractive events without detecting the scattered proton. In a previous paper [10], a method based on features of the shape of the mass spectrum of the hadronic final-state X𝑋X (MXsubscript𝑀𝑋M_{X} method) was applied. A discussion of the two approaches is presented, along with a comparison of the corresponding results.

2 Kinematics and cross sections

Figure 1 shows a schematic diagram of the process epeXp𝑒𝑝𝑒𝑋𝑝ep\to eXp. The kinematics of this reaction is described by the variables:

  • Q2=q2=(kk)2superscript𝑄2superscript𝑞2superscript𝑘superscript𝑘2Q^{2}=-q^{2}=-(k-k^{\prime})^{2}, the negative four-momentum squared of the virtual photon, where k𝑘k (k)superscript𝑘(k^{\prime}) is the four-momentum of the incident (scattered) positron;

  • W2=(q+P)2superscript𝑊2superscript𝑞𝑃2W^{2}=(q+P)^{2}, the squared centre-of-mass energy of the photon-proton system, where P𝑃P is the four-momentum of the incident proton;

  • x=Q2/(2Pq)𝑥superscript𝑄22𝑃𝑞x=Q^{2}/(2P\cdot q), the fraction of the proton momentum carried by the quark struck by the virtual photon in the infinite momentum frame (the Bjorken variable);

  • MX2=(q+PP)2subscriptsuperscript𝑀2𝑋superscript𝑞𝑃superscript𝑃2M^{2}_{X}=(q+P-P^{\prime})^{2}, the squared mass of the system X𝑋X, where Psuperscript𝑃P^{\prime} is the four-momentum of the scattered proton;

  • t=(PP)2𝑡superscript𝑃superscript𝑃2t=(P-P^{\prime})^{2}, the squared four-momentum transfer at the proton vertex;

  • ΦΦ\Phi, the angle between the positron scattering plane and the proton scattering plane in the γpsuperscript𝛾𝑝\gamma^{\star}p centre-of-mass frame.

The variables Q2superscript𝑄2Q^{2}, W𝑊W and x𝑥x are related by x=Q2/(Q2+W2Mp2)𝑥superscript𝑄2superscript𝑄2superscript𝑊2superscriptsubscript𝑀𝑝2x=Q^{2}/(Q^{2}+W^{2}-M_{p}^{2}), where Mpsubscript𝑀𝑝M_{p} is the proton mass.

The differential cross sections for the reactions epeXp𝑒𝑝𝑒𝑋𝑝ep\to eXp and γpXpsuperscript𝛾𝑝𝑋𝑝\gamma^{\star}p\to Xp are related by

dσepeXpdlnW2dQ2dMXdt𝑑superscript𝜎𝑒𝑝𝑒𝑋𝑝𝑑superscript𝑊2𝑑superscript𝑄2𝑑subscript𝑀𝑋𝑑𝑡\displaystyle\frac{d\sigma^{ep\rightarrow eXp}}{d\ln{W^{2}}dQ^{2}dM_{X}dt} =\displaystyle= α2π1+(1y)2Q2d(σTγpXp+σLγpXp)dMXdt[1y21+(1y)2RD1+RD]𝛼2𝜋1superscript1𝑦2superscript𝑄2𝑑superscriptsubscript𝜎𝑇superscript𝛾𝑝𝑋𝑝superscriptsubscript𝜎𝐿superscript𝛾𝑝𝑋𝑝𝑑subscript𝑀𝑋𝑑𝑡delimited-[]1superscript𝑦21superscript1𝑦2superscript𝑅𝐷1superscript𝑅𝐷\displaystyle\frac{\alpha}{2\pi}\frac{1+(1-y)^{2}}{Q^{2}}\frac{d(\sigma_{T}^{\gamma^{\star}p\rightarrow Xp}+\sigma_{L}^{\gamma^{\star}p\rightarrow Xp})}{dM_{X}dt}\left[1-\frac{y^{2}}{1+(1-y)^{2}}\frac{R^{D}}{1+R^{D}}\right] (1)
similar-to-or-equals\displaystyle\simeq α2π1+(1y)2Q2dσγpXpdMXdt,𝛼2𝜋1superscript1𝑦2superscript𝑄2𝑑superscript𝜎superscript𝛾𝑝𝑋𝑝𝑑subscript𝑀𝑋𝑑𝑡\displaystyle\frac{\alpha}{2\pi}\frac{1+(1-y)^{2}}{Q^{2}}\frac{d\sigma^{\gamma^{\star}p\rightarrow Xp}}{dM_{X}dt},

where α𝛼\alpha is the fine structure constant and y=(Pq)/(Pk)𝑦𝑃𝑞𝑃𝑘y=(P\cdot q)/(P\cdot k) is the fraction of the positron energy transferred to the proton in its rest frame. The quantity RD=σLγpXp/σTγpXpsuperscript𝑅𝐷superscriptsubscript𝜎𝐿superscript𝛾𝑝𝑋𝑝superscriptsubscript𝜎𝑇superscript𝛾𝑝𝑋𝑝R^{D}=\sigma_{L}^{\gamma^{*}p\rightarrow Xp}/\sigma_{T}^{\gamma^{*}p\rightarrow Xp} is the ratio of the cross sections for longitudinally and transversely polarised virtual photons. In the region covered by the present data, the term within the square brackets is taken to be unity since RDsuperscript𝑅𝐷R^{D} is expected to be small [11].

The kinematics of the reaction epeXp𝑒𝑝𝑒𝑋𝑝ep\to eXp can also be described by Q2superscript𝑄2Q^{2}, t𝑡t and ΦΦ\Phi, in conjunction with the two dimensionless variables xIPsubscript𝑥𝐼𝑃x_{I\!\!P} and β𝛽\beta introduced in Section 1 given by

xIP=(PP)qPq=Q2+MX2tQ2+W2Mp2,subscript𝑥𝐼𝑃𝑃superscript𝑃𝑞𝑃𝑞superscript𝑄2superscriptsubscript𝑀𝑋2𝑡superscript𝑄2superscript𝑊2superscriptsubscript𝑀𝑝2x_{I\!\!P}=\frac{(P-P^{\prime})\cdot q}{P\cdot q}=\frac{Q^{2}+M_{X}^{2}-t}{Q^{2}+W^{2}-M_{p}^{2}}, (2)
β=Q22(PP)q=Q2Q2+MX2t.𝛽superscript𝑄22𝑃superscript𝑃𝑞superscript𝑄2superscript𝑄2superscriptsubscript𝑀𝑋2𝑡\beta=\frac{Q^{2}}{2(P-P^{\prime})\cdot q}=\frac{Q^{2}}{Q^{2}+M_{X}^{2}-t}. (3)

The quantities xIPsubscript𝑥𝐼𝑃x_{I\!\!P} and β𝛽\beta are related to x𝑥x by xIPβ=xsubscript𝑥𝐼𝑃𝛽𝑥x_{I\!\!P}\beta=x.

The cross section for the reaction epeXp𝑒𝑝𝑒𝑋𝑝ep\to eXp can be expressed in terms of the structure function F2D(4)superscriptsubscript𝐹2𝐷4F_{2}^{D(4)}, which is defined by the equation

dσepeXpdβdQ2dxIPdt𝑑superscript𝜎𝑒𝑝𝑒𝑋𝑝𝑑𝛽𝑑superscript𝑄2𝑑subscript𝑥𝐼𝑃𝑑𝑡\displaystyle\frac{d\sigma^{ep\rightarrow eXp}}{d\beta dQ^{2}dx_{I\!\!P}dt} =\displaystyle= 4πα2βQ4[1y+y22(1+RD)]F2D(4)(β,Q2,xIP,t)4𝜋superscript𝛼2𝛽superscript𝑄4delimited-[]1𝑦superscript𝑦221superscript𝑅𝐷superscriptsubscript𝐹2𝐷4𝛽superscript𝑄2subscript𝑥𝐼𝑃𝑡\displaystyle\frac{4\pi\alpha^{2}}{\beta Q^{4}}\biggl{[}1-y+\frac{y^{2}}{2(1+R^{D})}\biggr{]}F_{2}^{D(4)}(\beta,Q^{2},x_{I\!\!P},t) (4)
similar-to-or-equals\displaystyle\simeq 4πα2βQ4[1y+y22]F2D(4)(β,Q2,xIP,t).4𝜋superscript𝛼2𝛽superscript𝑄4delimited-[]1𝑦superscript𝑦22superscriptsubscript𝐹2𝐷4𝛽superscript𝑄2subscript𝑥𝐼𝑃𝑡\displaystyle\frac{4\pi\alpha^{2}}{\beta Q^{4}}\biggl{[}1-y+\frac{y^{2}}{2}\biggr{]}F_{2}^{D(4)}(\beta,Q^{2},x_{I\!\!P},t).

The structure function F2D(3)(β,Q2,xIP)superscriptsubscript𝐹2𝐷3𝛽superscript𝑄2subscript𝑥𝐼𝑃F_{2}^{D(3)}(\beta,Q^{2},x_{I\!\!P}) is obtained by integrating F2D(4)superscriptsubscript𝐹2𝐷4F_{2}^{D(4)} over t𝑡t:

F2D(3)(β,Q2,xIP)=F2D(4)(β,Q2,xIP,t)𝑑t.superscriptsubscript𝐹2𝐷3𝛽superscript𝑄2subscript𝑥𝐼𝑃superscriptsubscript𝐹2𝐷4𝛽superscript𝑄2subscript𝑥𝐼𝑃𝑡differential-d𝑡F_{2}^{D(3)}(\beta,Q^{2},x_{I\!\!P})=\int{F_{2}^{D(4)}(\beta,Q^{2},x_{I\!\!P},t)dt}.

For the results presented in this paper, the integration was performed in the range 0<|t|<10𝑡10<|t|<1 GeV2.

For unpolarised positrons and protons, the cross section can also be decomposed as

dσepeXpdΦσTγpXp+ϵσLγpXp2ϵ(1+ϵ)σLTγpXpcosΦϵσTTγpXpcos2Φ,proportional-to𝑑superscript𝜎𝑒𝑝𝑒𝑋𝑝𝑑Φsuperscriptsubscript𝜎𝑇superscript𝛾𝑝𝑋𝑝italic-ϵsuperscriptsubscript𝜎𝐿superscript𝛾𝑝𝑋𝑝2italic-ϵ1italic-ϵsubscriptsuperscript𝜎superscript𝛾𝑝𝑋𝑝𝐿𝑇Φitalic-ϵsubscriptsuperscript𝜎superscript𝛾𝑝𝑋𝑝𝑇𝑇2Φ\frac{d\sigma^{ep\rightarrow eXp}}{d\Phi}\propto\sigma_{T}^{\gamma^{*}p\rightarrow Xp}+\epsilon\sigma_{L}^{\gamma^{*}p\rightarrow Xp}-2\sqrt{\epsilon(1+\epsilon)}\sigma^{\gamma^{*}p\rightarrow Xp}_{LT}\cos{\Phi}-\epsilon\sigma^{\gamma^{*}p\rightarrow Xp}_{TT}\cos{2\Phi}, (5)

where σLTγpXpsubscriptsuperscript𝜎superscript𝛾𝑝𝑋𝑝𝐿𝑇\sigma^{\gamma^{*}p\rightarrow Xp}_{LT} is the interference term between the amplitudes for longitudinal and transverse photons and σTTγpXpsubscriptsuperscript𝜎superscript𝛾𝑝𝑋𝑝𝑇𝑇\sigma^{\gamma^{*}p\rightarrow Xp}_{TT} is the interference term between the amplitudes for the two transverse polarisations. The polarisation parameter ϵitalic-ϵ\epsilon is defined as ϵ=2(1y)/[1+(1y)2]italic-ϵ21𝑦delimited-[]1superscript1𝑦2\epsilon=2(1-y)/[1+(1-y)^{2}].

3 Selection of diffraction at HERA

The kinematics of diffractive scattering, γpXpsuperscript𝛾𝑝𝑋𝑝\gamma^{*}p\rightarrow Xp, implies that three features should be present in the final state:

  1. 1.

    the proton suffers only a small perturbation and emerges from the interaction carrying a large fraction, xLsubscript𝑥𝐿x_{L}, of the incoming proton momentum. Diffractive events appear as a peak at xL1subscript𝑥𝐿1x_{L}\approx 1, the diffractive peak, which at HERA approximately covers the region 0.98<xL<10.98subscript𝑥𝐿10.98<x_{L}<1. The absolute value of the four-momentum transfer squared t𝑡t is typically much smaller than 1 GeV2, with |t|0.15delimited-⟨⟩𝑡0.15\langle|t|\rangle\approx 0.15 GeV2;

  2. 2.

    conservation of momentum implies that any other produced system (X𝑋X) must have a small mass (MXsubscript𝑀𝑋M_{X}) with respect to the photon-proton centre-of-mass energy (since 1xL>MX2/W21subscript𝑥𝐿>superscriptsubscript𝑀𝑋2superscript𝑊21-x_{L}\leavevmode\nobreak\ \raisebox{-2.79857pt}{\hbox to0.0pt{$\sim$\hss}}\raisebox{1.72218pt}{$>$}\leavevmode\nobreak\ M_{X}^{2}/W^{2});

  3. 3.

    the difference in rapidity between the outgoing proton and the system X𝑋X is Δηln(1/xIP)Δ𝜂1subscript𝑥𝐼𝑃\Delta\eta\approx\ln{(1/x_{I\!\!P})} [3]. This, combined with the peaking of the cross section at small values of xIPsubscript𝑥𝐼𝑃x_{I\!\!P}, leads to a large separation in rapidity between the outgoing proton and any other hadronic activity in the event.

There are two basic ways to select inclusive diffractive events. The first is the proton-tagging method (exploiting the first signature above), used in the present study and in earlier ones [12, 13, 8, 9, 14]. The second exploits the different characteristics of the system X𝑋X in diffractive and non-diffractive events:

  • in non-diffractive DIS, both the hadronic system associated with the struck quark, which is largely measured in the detector, and that of the proton remnant, which largely escapes down the beam-pipe, are coloured states. In this case, the distribution of the final-state particles is governed by conventional QCD fragmentation and particles are expected to be emitted uniformly in rapidity along the γsuperscript𝛾\gamma^{*}-p𝑝p axis. This leads to a suppression of rapidity gaps as well as a suppression of small masses of the hadronic system observed in the detector;

  • in contrast, small masses of the system X𝑋X and large rapidity gaps are signatures of diffractive processes (the second and third signatures above). At HERA, diffractive analyses based on the hadronic methods have been made with event selections based both on the presence of large rapidity gaps (rapidity-gap method, see e.g. [15, 2] and references therein) and small masses of the system X𝑋X (MXsubscript𝑀𝑋M_{X} method) [10, 8].

The two basic approaches for the selection of diffractive events, the proton-tagging method and the hadronic methods, are complementary:

  • in the hadronic methods, high MXsubscript𝑀𝑋M_{X} values are not accessible since the non-diffractive background grows with MXsubscript𝑀𝑋M_{X}. Also, the estimation of the non-diffractive background relies on models of fragmentation. Furthermore, the measured cross section includes a contribution from proton-dissociative events, epeXN𝑒𝑝𝑒𝑋𝑁ep\rightarrow eXN. In these events, the mass of the forward system (N𝑁N) enters as another variable, and the observed particles must be assigned either to the system N𝑁N or X𝑋X. The number of events in which no particle from N𝑁N is observed must be estimated from a Monte Carlo simulation. While these limitations add to the systematic uncertainty of the hadronic methods, the statistical precision of the results tends to be good due to the high acceptance of the central detector. Also, the acceptance is not limited in t𝑡t, although no measurement of t𝑡t is possible;

  • conversely, samples selected in the proton-tagging method have little or no background from proton-dissociative events or from non-diffractive DIS. They also allow a direct measurement of the variables t𝑡t, ΦΦ\Phi and xIPsubscript𝑥𝐼𝑃x_{I\!\!P} (at large values of xIPsubscript𝑥𝐼𝑃x_{I\!\!P}), and give access to higher values of MXsubscript𝑀𝑋M_{X}. The statistical precision, however, is poorer than for the results obtained using hadronic methods due to the small acceptance of the LPS – approximately 2% in the diffractive peak region.

Section 10.5 presents a comparison between the results obtained with the LPS and MXsubscript𝑀𝑋M_{X} methods. The results are also compared to measurements made by the H1 collaboration [15] in which diffraction was selected with the rapidity-gap method.

4 Experimental set-up

The measurements were carried out at the HERA collider in 1997 using the ZEUS detector. At that time, HERA operated with 820 GeV protons and 27.5 GeV positrons. The data used in this analysis correspond to integrated luminosities of 3.60±0.06plus-or-minus3.600.063.60\pm 0.06 pb-1 (low-Q2superscript𝑄2Q^{2} sample) and 12.8±0.2plus-or-minus12.80.212.8\pm 0.2 pb-1 (high-Q2superscript𝑄2Q^{2} sample).

A detailed description of the ZEUS detector can be found elsewhere [16]. A brief outline of the components that are most relevant for this analysis is given below.

Charged particles are tracked in the central tracking detector (CTD) [17, *npps:b32:181, *nim:a338:254], which operates in a magnetic field of 1.43T1.43T1.43\,\text{T} provided by a thin superconducting coil. The CTD consists of 72 cylindrical drift chamber layers, organised in nine superlayers covering the polar-angle222The ZEUS coordinate system is a right-handed Cartesian system, with the Z𝑍Z axis pointing in the proton beam direction, referred to as the “forward direction”, and the X𝑋X axis pointing left towards the centre of HERA. The coordinate origin is at the nominal interaction point. region 15<θ<164superscript15𝜃superscript16415^{\circ}<\theta<164^{\circ}. The transverse-momentum resolution for full-length tracks is σ(pT)/pT=0.0058pT0.00650.0014/pT𝜎subscript𝑝𝑇subscript𝑝𝑇direct-sum0.0058subscript𝑝𝑇0.00650.0014subscript𝑝𝑇\sigma(p_{T})/p_{T}=0.0058p_{T}\oplus 0.0065\oplus 0.0014/p_{T}, with pTsubscript𝑝𝑇p_{T} in GeV.

The high-resolution uranium-scintillator calorimeter (CAL) [20, *nim:a309:101, *nim:a321:356, *nim:a336:23] consists of three parts: the forward (FCAL), the barrel (BCAL) and the rear (RCAL) calorimeters. The CAL energy resolutions, as measured under test beam conditions, are σ(E)/E=0.18/E𝜎𝐸𝐸0.18𝐸\sigma(E)/E=0.18/\sqrt{E} for electrons and σ(E)/E=0.35/E𝜎𝐸𝐸0.35𝐸\sigma(E)/E=0.35/\sqrt{E} for hadrons (E𝐸E in GeV).

Low-Q2superscript𝑄2Q^{2} events were selected by identifying and measuring the scattered positron in the beam-pipe calorimeter (BPC) [24] and beam-pipe tracker (BPT) [25]. The BPC was a tungsten-scintillator sampling calorimeter, located 3 m from the interaction point and covered positron scattering angles relative to the incident direction of 15 to 34 mrad. The BPT was a silicon-microstrip tracking device situated immediately in front the BPC. In 1997, it was equipped with two detector planes to measure the X𝑋X coordinate.

For the high-Q2superscript𝑄2Q^{2} sample, the impact point of the scattered positron was determined with the small-angle rear tracking detector (SRTD) [26] or the CAL. The SRTD is attached to the front face of the RCAL and consists of two planes of scintillator strips, 1 cm wide and 0.5 cm thick, arranged in orthogonal orientations and read out via optical fibres and photomultiplier tubes. It covers a region 68×68686868\times 68 cm2 in X𝑋X and Y𝑌Y, excluding a 10×20102010\times 20 cm2 hole at the centre for the beam-pipe. The corresponding angular coverage is between 4superscript44^{\circ} and 18superscript1818^{\circ} around the beam-pipe. Ambiguities in SRTD hits were resolved with the help of the hadron-electron separator (HES) [27], which consists of a layer of 10 000, 2.89×3.052.893.052.89\times 3.05 cm2 silicon-pad detectors inserted in the CAL at a depth of 3.3 radiation lengths.

The LPS [28] detected positively charged particles scattered at small angles and carrying a substantial fraction, xLsubscript𝑥𝐿x_{L}, of the incoming proton momentum; these particles remain in the beam-pipe and their trajectory was measured by a system of silicon microstrip detectors that could be inserted very close (typically a few mm) to the proton beam. The detectors were grouped in six stations, S1 to S6, placed along the beam line in the direction of the proton beam, between 23.8 m and 90.0 m from the interaction point. The particle deflections induced by the magnets of the proton beam-line allowed a momentum analysis of the scattered proton. For the present measurements, only stations S4, S5 and S6 were used. The resolutions were about 0.5%percent0.50.5\% on the longitudinal momentum and about 5 MeV on the transverse momentum. The effective transverse-momentum resolution is dominated by the intrinsic transverse-momentum spread of the proton beam at the interaction point, which is about 40 MeV in the horizontal plane and about 90 MeV in the vertical plane. The LPS acceptance is approximately 2% and xLsubscript𝑥𝐿x_{L}-independent in the diffractive-peak region, 0.98<xL<10.98subscript𝑥𝐿10.98<x_{L}<1; it increases smoothly to about 10% as xLsubscript𝑥𝐿x_{L} decreases to 0.9.

The luminosity was measured from the rate of the bremsstrahlung process epeγp𝑒𝑝𝑒𝛾𝑝ep\rightarrow e\gamma p. The photon was measured in a lead-scintillator calorimeter [29, *lumi2, *lumi3] placed in the HERA tunnel at Z=107𝑍107Z=-107 m.

5 Reconstruction of the kinematic variables

In the low-Q2superscript𝑄2Q^{2} analysis, 0.03<Q2<0.600.03superscript𝑄20.600.03<Q^{2}<0.60 GeV2, the scattered positron was measured in the BPC/BPT. The energy and angle of the scattered positron were used (“electron method”) to determine Q2superscript𝑄2Q^{2} and W𝑊W. For the high-Q2superscript𝑄2Q^{2} data (2<Q2<1002superscript𝑄21002<Q^{2}<100 GeV2) the identification of the scattered positron was based on a neural network [32] which uses information from the CAL. The variables W𝑊W and Q2superscript𝑄2Q^{2} were reconstructed using a combination of the electron method and the double angle method [33].

The longitudinal (pZsubscript𝑝𝑍p_{Z}) and transverse (pX,pYsubscript𝑝𝑋subscript𝑝𝑌p_{X},p_{Y}) momenta of the scattered proton were measured with the LPS. The fractional energy of the outgoing proton, xLsubscript𝑥𝐿x_{L}, was defined as xL=pZ/Epsubscript𝑥𝐿subscript𝑝𝑍subscript𝐸𝑝x_{L}=p_{Z}/E_{p}, where Epsubscript𝐸𝑝E_{p} is the incoming proton energy. The variable t𝑡t is given by

t=pT2xL(1xL)2xLMp2,𝑡superscriptsubscript𝑝𝑇2subscript𝑥𝐿superscript1subscript𝑥𝐿2subscript𝑥𝐿superscriptsubscript𝑀𝑝2t=-\frac{p_{T}^{2}}{x_{L}}-\frac{(1-x_{L})^{2}}{x_{L}}M_{p}^{2}, (6)

where pTsubscript𝑝𝑇p_{T} is the transverse momentum of the proton with respect to the incoming beam direction. The t𝑡t resolution is approximately σ(|t|)=0.14GeV|t|𝜎𝑡0.14GeV𝑡\sigma(|t|)=0.14\leavevmode\nobreak\ {\rm GeV}\sqrt{|t|} (t𝑡t in GeV2) and is dominated by the angular spread of the beam. The proton and the positron momenta were used to determine ΦΦ\Phi, the azimuthal angle between the positron and proton scattering planes in the γpsuperscript𝛾𝑝\gamma^{*}p frame. The resolution on ΦΦ\Phi is approximately 0.2 rad.

The four-momentum of the system X𝑋X was determined from calorimeter and tracking information. The energy deposits in the CAL and the track momenta measured in the CTD were combined in energy flow objects (EFOs) [10, 34] to obtain the best momentum resolution. The mass MXsubscript𝑀𝑋M_{X} was evaluated as

MX,EFO2=(Ei)2(pXi)2(pYi)2(pZi)2,superscriptsubscript𝑀𝑋𝐸𝐹𝑂2superscriptsubscript𝐸𝑖2superscriptsubscript𝑝𝑋𝑖2superscriptsubscript𝑝𝑌𝑖2superscriptsubscript𝑝𝑍𝑖2M_{X,EFO}^{2}=\biggl{(}\sum{E_{i}}\biggr{)}^{2}-\biggl{(}\sum{p_{Xi}}\biggr{)}^{2}-\biggl{(}\sum{p_{Yi}}\biggr{)}^{2}-\biggl{(}\sum{p_{Zi}}\biggr{)}^{2},

where the sums run over all EFOs not assigned to the scattered positron. The mass MXsubscript𝑀𝑋M_{X} can also be determined from the outgoing proton momentum as reconstructed in the LPS:

MX,LPS2[1xL(1+x)]W2.superscriptsubscript𝑀𝑋𝐿𝑃𝑆2delimited-[]1subscript𝑥𝐿1𝑥superscript𝑊2M_{X,LPS}^{2}\approx[1-x_{L}(1+x)]W^{2}.

The best resolution on MXsubscript𝑀𝑋M_{X} is obtained with MX,EFOsubscript𝑀𝑋𝐸𝐹𝑂M_{X,EFO} when MXsubscript𝑀𝑋M_{X} is small and with MX,LPSsubscript𝑀𝑋𝐿𝑃𝑆M_{X,LPS} for large values of MXsubscript𝑀𝑋M_{X}, so MXsubscript𝑀𝑋M_{X} was reconstructed as

MX2=wEFOMX,EFO2+wLPSMX,LPS2,subscriptsuperscript𝑀2𝑋subscript𝑤𝐸𝐹𝑂subscriptsuperscript𝑀2𝑋𝐸𝐹𝑂subscript𝑤𝐿𝑃𝑆subscriptsuperscript𝑀2𝑋𝐿𝑃𝑆M^{2}_{X}=w_{EFO}M^{2}_{X,EFO}+w_{LPS}M^{2}_{X,LPS}, (7)

where the weights wEFOsubscript𝑤𝐸𝐹𝑂w_{EFO} and wLPSsubscript𝑤𝐿𝑃𝑆w_{LPS} are inversely proportional to the appropriate resolutions, and wEFO+wLPS=1subscript𝑤𝐸𝐹𝑂subscript𝑤𝐿𝑃𝑆1w_{EFO}+w_{LPS}=1. The resulting resolution is σ(MX)/MX=0.35/MX+0.08𝜎subscript𝑀𝑋subscript𝑀𝑋0.35subscript𝑀𝑋0.08\sigma(M_{X})/M_{X}=0.35/\sqrt{M_{X}}+0.08, with MXsubscript𝑀𝑋M_{X} in GeV.

The variables xIPsubscript𝑥𝐼𝑃x_{I\!\!P} and β𝛽\beta were obtained from Eqs. (2) and (3), using the value of MXsubscript𝑀𝑋M_{X} from Eq. (7). For the determination of xIPsubscript𝑥𝐼𝑃x_{I\!\!P}, this procedure is equivalent, at large MXsubscript𝑀𝑋M_{X}, to evaluating xIPsubscript𝑥𝐼𝑃x_{I\!\!P} as xIP=1xLsubscript𝑥𝐼𝑃1subscript𝑥𝐿x_{I\!\!P}=1-x_{L}.

The variable y𝑦y was reconstructed as yJB=(EipZi)had2Eesubscript𝑦𝐽𝐵subscriptsubscript𝐸𝑖subscript𝑝𝑍𝑖had2subscript𝐸𝑒y_{JB}=\sum{\frac{(E_{i}-p_{Zi})_{\rm had}}{2E_{e}}}, where the sum is over all EFOs not associated to the scattered positron and Eesubscript𝐸𝑒E_{e} is the energy of the incident positron (“Jacquet-Blondel method” [35]).

6 Event selection

The data used for the analysis were selected at the trigger level by requiring the presence of a scattered positron in the BPC or CAL and a scattered proton in the LPS. In the offline selection the following cuts were imposed, closely following those used in the F2subscript𝐹2F_{2} analyses at low Q2superscript𝑄2Q^{2} [25] and high Q2superscript𝑄2Q^{2} [36]:

  • the energy of the scattered positron, if measured in the BPC, was required to be between 3 and 7 GeV for the events with W>260𝑊260W>260 GeV and greater than 7 GeV for W<260𝑊260W<260 GeV, reflecting the trigger selection. If measured in the CAL, the scattered positron energy was required to be larger than 10 GeV.

    The position of the scattered positron was required to be within the fiducial regions of the BPC or the CAL. In addition, in case the positron was found in the BPC, the impact position at the BPC front face, as extrapolated from the BPT measurement, was required to match with that of the BPC shower. Furthermore, in order to identify electromagnetic showers and to reject hadrons, the transverse size (energy weighted root mean square) of the shower in the BPC was required to be less than 0.8 cm;

  • the requirements 30<(EpZ)<6530𝐸subscript𝑝𝑍6530<(E-p_{Z})<65 GeV and 40<(EpZ)<6540𝐸subscript𝑝𝑍6540<(E-p_{Z})<65 GeV were imposed for the low- and high-Q2superscript𝑄2Q^{2} samples, respectively, where EpZ=(EipZi)𝐸subscript𝑝𝑍subscript𝐸𝑖subscript𝑝𝑍𝑖E-p_{Z}=\sum{(E_{i}-p_{Zi})} and the summation runs over the energies and longitudinal momenta of the final-state positron and all EFOs. This cut reduces the size of the QED radiative corrections and the photoproduction background, i.e. the Q20superscript𝑄20Q^{2}\approx 0 events where the scattered positron escapes undetected in the rear beam-hole;

  • in order to limit event migrations from low y𝑦y, the variable yJBsubscript𝑦𝐽𝐵y_{JB} was required to be greater than 0.06;

  • the Z𝑍Z coordinate of the interaction vertex was required to be in the range 90<Z<9090𝑍90-90<Z<90 cm for the low-Q2superscript𝑄2Q^{2} sample and 50<Z<5050𝑍50-50<Z<50 cm for the high-Q2superscript𝑄2Q^{2} sample. Events without a vertex reconstructed using BPT tracks were discarded in the low-Q2superscript𝑄2Q^{2} analysis. In the high-Q2superscript𝑄2Q^{2} sample, events without a measured vertex were assigned to the nominal interaction point.

The following requirements were used to select the scattered proton measured in the LPS:

  • the candidate proton was tracked along the beam line and was rejected if, at any point, the distance of approach to the beam pipe was less than 0.2 cm for pX<0subscript𝑝𝑋0p_{X}<0, or less than 0.3 cm for pX>0subscript𝑝𝑋0p_{X}>0. This cut reduces the sensitivity of the acceptance to the uncertainty in the position of the beam-pipe apertures;

  • the variable t𝑡t was required to be in the range 0.075<|t|<0.350.075𝑡0.350.075<|t|<0.35 GeV2. This cut eliminated regions where the LPS acceptance was small or rapidly changing;

  • beam-halo background is caused by scattered protons, with energy close to that of the beam, originating from the interaction of a beam proton with the residual gas in the beam-pipe or with the beam collimators. A beam-halo proton may overlap with a standard non-diffractive DIS event. In this case, the proton measured in the LPS is uncorrelated with the activity in the central ZEUS detector. This background was suppressed by the requirement that the sum of the energy and the longitudinal component of the total momentum measured in the CAL, the BPC and the LPS be less than the kinematic limit of twice the incoming proton energy: E+pZ=(E+pZ)CAL+(E+pZ)BPC+2pZLPS<1655𝐸subscript𝑝𝑍subscript𝐸subscript𝑝𝑍CALsubscript𝐸subscript𝑝𝑍BPC2superscriptsubscript𝑝𝑍LPS1655E+p_{Z}=(E+p_{Z})_{\rm CAL}+(E+p_{Z})_{\rm BPC}+2p_{Z}^{\rm LPS}<1655 GeV. This cut takes into account the resolution of the measurement of pZLPSsuperscriptsubscript𝑝𝑍LPSp_{Z}^{\rm LPS}. The residual beam-halo background and its subtraction are discussed in Section 7.

The low-Q2superscript𝑄2Q^{2} analysis was further limited to the kinematic region 0.03<Q2<0.60.03superscript𝑄20.60.03<Q^{2}<0.6 GeV2, 63<W<28063𝑊28063<W<280 GeV, MX>1.5subscript𝑀𝑋1.5M_{X}>1.5 GeV and xL>0.9subscript𝑥𝐿0.9x_{L}>0.9. The average Q2superscript𝑄2Q^{2} value for this sample is 0.23 GeV2. The high-Q2superscript𝑄2Q^{2} analysis was restricted to 2<Q2<1002superscript𝑄21002<Q^{2}<100 GeV2, 25<W<24025𝑊24025<W<240 GeV, MX>1.5subscript𝑀𝑋1.5M_{X}>1.5 GeV and xIP<0.07subscript𝑥𝐼𝑃0.07x_{I\!\!P}<0.07; the average Q2superscript𝑄2Q^{2} value is 10.5 GeV2. These selections yielded 334 events in the low-Q2superscript𝑄2Q^{2} sample and 5945 events in the high-Q2superscript𝑄2Q^{2} sample.

7 Monte Carlo simulation and acceptance corrections

Monte Carlo simulations were used to correct the data for acceptance and detector effects. In the low-Q2superscript𝑄2Q^{2} analysis, events of the type epeXp𝑒𝑝𝑒𝑋𝑝ep\to eXp were simulated with the generator EPSOFT 2.0 [37, 38], based on the triple-Regge formalism [1, 3], in which the cross section can be expressed in terms of three trajectories. If all the trajectories are Pomerons (IPIPIP𝐼𝑃𝐼𝑃𝐼𝑃I\!\!PI\!\!PI\!\!P), the cross-section dσγpXp/dMX2𝑑superscript𝜎superscript𝛾𝑝𝑋𝑝𝑑superscriptsubscript𝑀𝑋2d\sigma^{\gamma^{*}p\rightarrow Xp}/dM_{X}^{2} is approximately proportional to 1/MX21superscriptsubscript𝑀𝑋21/M_{X}^{2}. If one of the trajectories is a Reggeon (IPIPIR𝐼𝑃𝐼𝑃𝐼𝑅I\!\!PI\!\!PI\!\!R), the cross-section dσγpXp/dMX2𝑑superscript𝜎superscript𝛾𝑝𝑋𝑝𝑑superscriptsubscript𝑀𝑋2d\sigma^{\gamma^{*}p\rightarrow Xp}/dM_{X}^{2} falls as 1/MX3similar-toabsent1superscriptsubscript𝑀𝑋3\sim 1/M_{X}^{3}.

In the high-Q2superscript𝑄2Q^{2} analysis, the reaction epeXp𝑒𝑝𝑒𝑋𝑝ep\to eXp was modelled with RAPGAP 2.08/06 [39], which is based on the model of Ingelman and Schlein [40]. In RAPGAP, the structure function F2D(4)superscriptsubscript𝐹2𝐷4F_{2}^{D(4)} is expressed as the sum of Pomeron and Reggeon contributions:

F2D(4)(xIP,t,β,Q2)=fIP(xIP,t)F2IP(β,Q2)+fIR(xIP,t)F2IR(β,Q2).superscriptsubscript𝐹2𝐷4subscript𝑥𝐼𝑃𝑡𝛽superscript𝑄2subscript𝑓𝐼𝑃subscript𝑥𝐼𝑃𝑡superscriptsubscript𝐹2𝐼𝑃𝛽superscript𝑄2subscript𝑓𝐼𝑅subscript𝑥𝐼𝑃𝑡superscriptsubscript𝐹2𝐼𝑅𝛽superscript𝑄2F_{2}^{D(4)}(x_{I\!\!P},t,\beta,Q^{2})=f_{I\!\!P}(x_{I\!\!P},t)F_{2}^{I\!\!P}(\beta,Q^{2})+f_{I\!\!R}(x_{I\!\!P},t)F_{2}^{I\!\!R}(\beta,Q^{2}). (8)

The Pomeron and Reggeon fluxes, fIP,IR(xIP,t)subscript𝑓𝐼𝑃𝐼𝑅subscript𝑥𝐼𝑃𝑡f_{I\!\!P,I\!\!R}(x_{I\!\!P},t), were parameterised [1] as

fIP,IR(xIP,t)=eb0IP,IRtxIP2αIP,IR(t)1,subscript𝑓𝐼𝑃𝐼𝑅subscript𝑥𝐼𝑃𝑡superscript𝑒superscriptsubscript𝑏0𝐼𝑃𝐼𝑅𝑡superscriptsubscript𝑥𝐼𝑃2subscript𝛼𝐼𝑃𝐼𝑅𝑡1f_{I\!\!P,I\!\!R}(x_{I\!\!P},t)=\frac{e^{b_{0}^{I\!\!P,I\!\!R}t}}{x_{I\!\!P}^{2\alpha_{I\!\!P,I\!\!R}(t)-1}}, (9)

with linear trajectories αIP,R(t)=αIP,IR(0)+αIP,IRtsubscript𝛼𝐼𝑃𝑅𝑡subscript𝛼𝐼𝑃𝐼𝑅0superscriptsubscript𝛼𝐼𝑃𝐼𝑅𝑡\alpha_{I\!\!P,R}(t)=\alpha_{I\!\!P,I\!\!R}(0)+\alpha_{I\!\!P,I\!\!R}^{\prime}t, and the values of the parameters were taken from hadron-hadron data. The Pomeron structure function F2IP(β,Q2)superscriptsubscript𝐹2𝐼𝑃𝛽superscript𝑄2F_{2}^{I\!\!P}(\beta,Q^{2}) was taken from the H1 measurements [15] (fit 2). The Reggeon trajectory includes the ρ𝜌\rho, the ω𝜔\omega, the f2subscript𝑓2f_{2} and a2subscript𝑎2a_{2} mesons. Their structure functions are unknown and were approximated with that of the pion [41]. The assumption that F2D(3)superscriptsubscript𝐹2𝐷3F_{2}^{D(3)} can be expressed as the product of a flux, depending only on xIPsubscript𝑥𝐼𝑃x_{I\!\!P} and t𝑡t, and the structure function of a particle-like object (see Eq. (8)) is known as the “Regge factorisation” hypothesis. It gives a fair description of the data, although it has no justification in QCD, where only the concept of diffractive PDFs, which are functions of (xIP,t,β,Q2subscript𝑥𝐼𝑃𝑡𝛽superscript𝑄2x_{I\!\!P},t,\beta,Q^{2}), has a firm basis.

The Monte Carlo generator DIFFVM 1.0 [42] was used to simulate the double-dissociative reaction, epeXN𝑒𝑝𝑒𝑋𝑁ep\to eXN, where the proton diffractively dissociates into the state N𝑁N.

Initial- and final-state QED radiation were simulated by using EPSOFT and RAPGAP in conjunction with HERACLES 4.6 [43].

The generated EPSOFT and RAPGAP events were reweighted in xLsubscript𝑥𝐿x_{L} and t𝑡t so that the measured distributions were well described. All generated events were passed through the standard ZEUS detector simulation, based on the GEANT program [44], and the trigger simulation package. A comparison of data and MC simulations is presented in Figs. 2 and 3 for the variables xLsubscript𝑥𝐿x_{L}, t𝑡t, Q2superscript𝑄2Q^{2}, W𝑊W, MXsubscript𝑀𝑋M_{X}, and xIPsubscript𝑥𝐼𝑃x_{I\!\!P}. In Figs. 2c and 2d, no LPS requirement was imposed, so as to reduce the statistical fluctuations. The simulations reproduce the data satisfactorily. The diffractive peak is evident in Figs. 2a and 3a.

In the low-Q2superscript𝑄2Q^{2} analysis, the measured number of events was corrected for acceptance bin-by-bin. Bin-centring corrections were applied in W𝑊W, xIPsubscript𝑥𝐼𝑃x_{I\!\!P} and MXsubscript𝑀𝑋M_{X} assuming σγpXpW2(2α¯IP1)proportional-tosuperscript𝜎superscript𝛾𝑝𝑋𝑝superscript𝑊22subscript¯𝛼𝐼𝑃1\sigma^{\gamma^{*}p\rightarrow Xp}\propto W^{2(2\bar{\alpha}_{I\!\!P}-1)}, F2D(3)1/xIP2α¯IP1proportional-tosuperscriptsubscript𝐹2𝐷31superscriptsubscript𝑥𝐼𝑃2subscript¯𝛼𝐼𝑃1F_{2}^{D(3)}\propto 1/x_{I\!\!P}^{2\bar{\alpha}_{I\!\!P}-1}, and dσγpXp/dMX21/MX2(2α¯IP1)proportional-to𝑑superscript𝜎superscript𝛾𝑝𝑋𝑝𝑑superscriptsubscript𝑀𝑋21superscriptsubscript𝑀𝑋22subscript¯𝛼𝐼𝑃1d\sigma^{\gamma^{*}p\rightarrow Xp}/dM_{X}^{2}\propto 1/M_{X}^{2(2\bar{\alpha}_{I\!\!P}-1)}, where α¯IPsubscript¯𝛼𝐼𝑃\bar{\alpha}_{I\!\!P} is the t𝑡t-averaged value of the Pomeron trajectory as obtained from the present measurement (Section 10.6). In the high-Q2superscript𝑄2Q^{2} analysis, the cross section for the dissociation of virtual photons at a given point within a bin was obtained from the ratio of the measured number of events to the number of events in that bin predicted from the MC simulation, multiplied by the γpXpsuperscript𝛾𝑝𝑋𝑝\gamma^{*}p\rightarrow Xp cross section calculated by the Monte Carlo generator. Both the acceptance and the bin-centring corrections were thus taken from the MC simulation.

The cross section was directly measured only in a limited t𝑡t region and extrapolated to 0<|t|<10𝑡10<|t|<1 GeV2 using the t𝑡t dependence assumed in the Monte Carlo generator, which was reweighted to the measured value of b𝑏b (see Section 10.1). The effect of the extrapolation is to increase the cross section by a factor of about two (to within 3%); this factor is largely independent of the measured kinematic variables. In the region covered by the present measurements, the extrapolation is performed assuming an exponential dependence on t𝑡t, dσepeXp/dtexp(bt)proportional-to𝑑superscript𝜎𝑒𝑝𝑒𝑋𝑝𝑑𝑡𝑏𝑡d\sigma^{ep\rightarrow eXp}/dt\propto\exp{(bt)}, with b7.9similar-to-or-equals𝑏7.9b\simeq 7.9 GeV-2 at low xIPsubscript𝑥𝐼𝑃x_{I\!\!P}. Data from elastic and p𝑝p-dissociative pp𝑝𝑝pp and p¯p¯𝑝𝑝\bar{p}p scattering indicate that the t𝑡t distribution is better described by the function exp(bt+ct2)𝑏𝑡𝑐superscript𝑡2\exp{(bt+ct^{2})}. For example, fits to the p¯p¯𝑝𝑝\bar{p}p data at s=546𝑠546\sqrt{s}=546 GeV [45] yield c=2.3±0.1𝑐plus-or-minus2.30.1c=2.3\pm 0.1 GeV-4. The present data are only weakly sensitive to the value of c𝑐c. In the extrapolation to the range 0<|t|<10𝑡10<|t|<1 GeV2, c𝑐c was taken to be zero, but was varied by up to 4 GeV-4, yielding changes in the extrapolated cross section of up to 7%. This was included in the normalisation uncertainty discussed in Section 9.

The results presented in this paper were corrected to the Born level and to the following kinematic region:

  • low-Q2superscript𝑄2Q^{2} data: 0.03<Q2<0.60.03superscript𝑄20.60.03<Q^{2}<0.6 GeV2, 63<W<28063𝑊28063<W<280 GeV, MX>1.5subscript𝑀𝑋1.5M_{X}>1.5 GeV, xL>0.9subscript𝑥𝐿0.9x_{L}>0.9 and 0<|t|<10𝑡10<|t|<1 GeV2;

  • high-Q2superscript𝑄2Q^{2} data: 2<Q2<1002superscript𝑄21002<Q^{2}<100 GeV2, 25<W<24025𝑊24025<W<240 GeV, MX>1.5subscript𝑀𝑋1.5M_{X}>1.5 GeV, xL>0.9subscript𝑥𝐿0.9x_{L}>0.9 and 0<|t|<10𝑡10<|t|<1 GeV2.

8 Backgrounds

The main background contribution is given by proton beam-halo events. In such events, the proton detected in the LPS is not correlated with the measurements in the central detector. To estimate the size of this background, the variable E+pZ𝐸subscript𝑝𝑍E+p_{Z} (see Section 6) was used. For a signal event, this quantity should be equal to twice the initial proton energy, 1640 GeV, whereas for a beam-halo event it can exceed this value.

The E+pZ𝐸subscript𝑝𝑍E+p_{Z} spectrum for the beam-halo events was constructed as a random combination of generic DIS events (without the requirement of a track in the LPS) and a beam-halo track measured in the LPS. The resulting distribution, shown in Fig. 4 as the hatched histogram, was normalised to the data for E+pZ>1685𝐸subscript𝑝𝑍1685E+p_{Z}>1685 GeV, which contain beam-halo events only (see Fig. 4). The background remaining after the E+pZ<1655𝐸subscript𝑝𝑍1655E+p_{Z}<1655 GeV cut averaged (10.2±0.7(stat.))%(10.2\pm 0.7\leavevmode\nobreak\ (\rm stat.))\% and was a function of xIPsubscript𝑥𝐼𝑃x_{I\!\!P} and t𝑡t. All results presented in this paper were corrected for this background.

The contribution from proton-dissociative events, epeXN𝑒𝑝𝑒𝑋𝑁ep\to eXN, was studied with the Monte Carlo generator DIFFVM for the DIS sample and was found to be less than 4%percent44\% in all bins. This contribution was neglected.

9 Systematic uncertainties

The systematic uncertainties were calculated by varying the cuts and by modifying the analysis procedure. The variations of the cuts were typically commensurate with the resolutions of the relevant variables, and in general the changes were similar to those made in earlier analyses [25, 28, 12, 13].

The following systematic checks were performed 333The corresponding average effect on the cross section in the measured bins is indicated using the notation b+asubscriptsuperscriptabsent𝑎𝑏{}^{+a}_{-b}: given a systematic check which produces an increase of the cross section in some bins and a decrease in some other bins, a𝑎a is the average increase and b𝑏b is the average decrease.:

  • to evaluate the uncertainties due to the measurement of the scattered positron:

    • low-Q2superscript𝑄2Q^{2} analysis: the checks performed in a previous publication [25] were repeated, and consistent results obtained. Since the present data are a subsample of those used earlier, the systematic uncertainties found previously [25] were used (typically smaller than ±1.5%plus-or-minuspercent1.5\pm 1.5\%);

    • high-Q2superscript𝑄2Q^{2} analysis: the fiducial region for the impact position of the positron was modified (%2.9+3.3{}^{+3.3}_{-2.9}\%); the minimum energy of the positron was increased to 12 GeV (%1.4+1.6{}^{+1.6}_{-1.4}\%);

  • to evaluate the uncertainties due to the reconstruction of the final-state proton, the checks described below were performed. Consistent results were obtained for the low- and the high-Q2superscript𝑄2Q^{2} samples; because of the larger statistical fluctuations of the low-Q2superscript𝑄2Q^{2} sample, the uncertainties quoted are those determined from the high-Q2superscript𝑄2Q^{2} events;

    • the cut on the minimum distance of approach to the beam-pipe was increased by 0.03 cm (%2.4+4.1{}^{+4.1}_{-2.4}\%); the t𝑡t range was enlarged to 0.07<|t|<0.40.07𝑡0.40.07<|t|<0.4 GeV2 (%1.1+2.8{}^{+2.8}_{-1.1}\%); the amount of the subtracted beam-halo background was varied by ±20%plus-or-minuspercent20\pm 20\% (%1.4+2.0{}^{+2.0}_{-1.4}\%);

  • sensitivity to the other selection cuts:

    • low-Q2superscript𝑄2Q^{2} analysis: the checks performed in a previous publication [25] were repeated and consistent results found, notably for the sensitivity to the selections on yJBsubscript𝑦𝐽𝐵y_{JB}, EpZ𝐸subscript𝑝𝑍E-p_{Z} and the Z𝑍Z coordinate of the vertex. The systematic uncertainties determined in [25] were used (typically smaller than ±1.5plus-or-minus1.5\pm 1.5%);

    • high-Q2superscript𝑄2Q^{2} analysis: the minimum value of EpZ𝐸subscript𝑝𝑍E-p_{Z} was raised to 45 GeV (%2.1+1.3{}^{+1.3}_{-2.1}\%); the cut on the Z𝑍Z coordinate of the vertex was restricted to 40<Z<4040𝑍40-40<Z<40 cm (%1.3+2.2{}^{+2.2}_{-1.3}\%); the systematic error due to the uncertainty in the absolute calorimeter energy calibration was estimated by changing the energy scale by ±2%plus-or-minuspercent2\pm 2\% (%1.5+2.6{}^{+2.6}_{-1.5}\%); the minimum value of MXsubscript𝑀𝑋M_{X} was decreased to 1.3 GeV (%1.4+1.7{}^{+1.7}_{-1.4}\%);

  • sensitivity to the Monte Carlo simulations:

    • low-Q2superscript𝑄2Q^{2} analysis: no reweighting of the xLsubscript𝑥𝐿x_{L} distribution was applied in the Monte Carlo simulation (%6.3+3.2{}^{+3.2}_{-6.3}\%); the value of the t𝑡t slope was changed by ±1.5plus-or-minus1.5\pm 1.5 GeV-2 (%0.7+4.4{}^{+4.4}_{-0.7}\%);

    • high-Q2superscript𝑄2Q^{2} analysis: the xIPsubscript𝑥𝐼𝑃x_{I\!\!P} distribution was reweighted by a factor (1/xIP)ksuperscript1subscript𝑥𝐼𝑃𝑘(1/x_{I\!\!P})^{k}, with k𝑘k varying between 0.050.05-0.05 and +0.05 (%1.1+1.7{}^{+1.7}_{-1.1}\%); the value of the t𝑡t slope was changed by ±1.5plus-or-minus1.5\pm 1.5 GeV-2 (%2.1+6.2{}^{+6.2}_{-2.1}\%); the ΦΦ\Phi distribution was reweighted by a factor (1+kcosΦ)1𝑘Φ(1+k\cos{\Phi}), with k𝑘k varying between 0.150.15-0.15 and +0.15 (%1.2+1.8{}^{+1.8}_{-1.2}\%); the intrinsic transverse-momentum spread of the proton beam at the interaction point was increased by 10 MeV in the horizontal plane and 20 MeV in the vertical plane (%2.1+2.7{}^{+2.7}_{-2.1}\%);

  • the t𝑡t slope was determined with an alternative method [28] based on expressing the measured t𝑡t distribution as a convolution of an exponential distribution, dσ/dteb|t|proportional-to𝑑𝜎𝑑𝑡superscript𝑒𝑏𝑡d\sigma/dt\propto e^{-b|t|}, and a two-dimensional Gaussian distribution representing the transverse momentum distribution of the beam. This led to changes in the value of the t𝑡t slope by up to +4%percent4+4\%.

The total systematic uncertainty for each bin was determined by quadratically adding the individual contributions. The quoted uncertainties do not include an overall normalisation uncertainty of ±10%plus-or-minuspercent10\pm 10\% which originates mostly from the uncertainty of the simulation of the proton-beam optics; this uncertainty is largely independent of the kinematic variables and was therefore taken as a normalisation uncertainty. The ±10%plus-or-minuspercent10\pm 10\% normalisation uncertainty also includes the uncertainty on the integrated luminosity (±1.6%plus-or-minuspercent1.6\pm 1.6\%). In addition, a +7%percent7+7\% uncertainty is present in the cross section and structure function results, except those for dσepeXp/dt𝑑superscript𝜎𝑒𝑝𝑒𝑋𝑝𝑑𝑡d\sigma^{ep\rightarrow eXp}/dt, due to the extrapolation from the measured t𝑡t region to 0<|t|<10𝑡10<|t|<1 GeV2 (see Section 7). Thus the overall normalisation uncertainty is %10+12{}^{+12}_{-10}\%.

10 Results

The results in this section are presented as follows. The differential cross-section dσepeXp/dt𝑑superscript𝜎𝑒𝑝𝑒𝑋𝑝𝑑𝑡d\sigma^{ep\rightarrow eXp}/dt in the region 0.075<|t|<0.350.075𝑡0.350.075<|t|<0.35 GeV2 is presented first. The data are then integrated over t𝑡t and extrapolated to the range 0<|t|<10𝑡10<|t|<1 GeV2, as discussed in Section 7. The resulting cross sections are presented as a function of ΦΦ\Phi in Section 10.2, where the sensitivity of the present data to the helicity structure of the reaction epeXp𝑒𝑝𝑒𝑋𝑝ep\rightarrow eXp is discussed. The dependence of the cross section on Q2superscript𝑄2Q^{2} is presented in Section 10.3, and is compared with that of the total photon-proton cross section.

In Section 10.4 the data are presented in terms of the diffractive structure function, F2D(3)superscriptsubscript𝐹2𝐷3F_{2}^{D(3)}. This allows an interpretation based on the diffractive PDFs of the proton. The present data in the diffractive-peak region are compared to those obtained with the MXsubscript𝑀𝑋M_{X} method by ZEUS and with the rapidity-gap method by H1 in Section 10.5.

In Section 10.6, the xIPsubscript𝑥𝐼𝑃x_{I\!\!P} dependence of F2D(3)superscriptsubscript𝐹2𝐷3F_{2}^{D(3)} is used to extract the intercept of the Pomeron trajectory, αIP(0)subscript𝛼𝐼𝑃0\alpha_{I\!\!P}(0), the quantity that, in Regge phenomenology, determines the energy dependence of the total hadron-hadron cross section [1]. It is interesting to see if the value of αIP(0)subscript𝛼𝐼𝑃0\alpha_{I\!\!P}(0) in ep𝑒𝑝ep diffractive scattering at high Q2superscript𝑄2Q^{2} is larger than that measured in hadron-hadron collisions, as expected in the framework introduced earlier, in which diffraction is due to the exchange of partons from the proton. In Section 10.7 the results are compared to some perturbative QCD (pQCD) models based on the dipole picture outlined in Section 1. Finally, an NLO QCD fit was performed.

The results of this paper extend up to xIP0.07similar-to-or-equalssubscript𝑥𝐼𝑃0.07x_{I\!\!P}\simeq 0.07. In the following, the data for the diffractive-peak region are often contrasted with those at high xIPsubscript𝑥𝐼𝑃x_{I\!\!P}. For this purpose, the value xIP=0.01subscript𝑥𝐼𝑃0.01x_{I\!\!P}=0.01 is chosen as the transition between the high- and low-xIPsubscript𝑥𝐼𝑃x_{I\!\!P} bins, such that the low-xIPsubscript𝑥𝐼𝑃x_{I\!\!P} bins are dominated by diffractive-peak events. This choice is somewhat restrictive, since the diffractive peak extends to xIP0.02similar-to-or-equalssubscript𝑥𝐼𝑃0.02x_{I\!\!P}\simeq 0.02, see Figs. 2a and 3a. In the region xIP<0.01subscript𝑥𝐼𝑃0.01x_{I\!\!P}<0.01, the contribution from non-Pomeron exchanges is less than 10%. The average value of xIPsubscript𝑥𝐼𝑃x_{I\!\!P} is 0.003 for xIP<0.01subscript𝑥𝐼𝑃0.01x_{I\!\!P}<0.01 and 0.043 for xIP>0.01subscript𝑥𝐼𝑃0.01x_{I\!\!P}>0.01.

Preliminary versions of the present results, along with details of the analysis, have been presented earlier [46, 47, 48].

10.1 𝒕𝒕t dependence

Figure 5a presents the differential cross-section dσepeXp/dt𝑑superscript𝜎𝑒𝑝𝑒𝑋𝑝𝑑𝑡d\sigma^{ep\rightarrow eXp}/dt in the kinematic range 2<Q2<1002superscript𝑄21002<Q^{2}<100 GeV2, MX>1.5subscript𝑀𝑋1.5M_{X}>1.5 GeV, xIP<0.01subscript𝑥𝐼𝑃0.01x_{I\!\!P}<0.01. For this sample, Q2=8.4delimited-⟨⟩superscript𝑄28.4\langle Q^{2}\rangle=8.4 GeV2 and β=0.32delimited-⟨⟩𝛽0.32\langle\beta\rangle=0.32. The value of the slope parameter, b𝑏b, obtained from the fit with the function dσepeXp/dteb|t|proportional-to𝑑superscript𝜎𝑒𝑝𝑒𝑋𝑝𝑑𝑡superscript𝑒𝑏𝑡d\sigma^{ep\rightarrow eXp}/dt\propto e^{-b|t|} in the range 0.075<|t|<0.350.075𝑡0.350.075<|t|<0.35 GeV2 is

b=7.9±0.5(stat.)0.5+0.9(syst.)GeV2.b=7.9\pm 0.5(\rm stat.)^{+0.9}_{-0.5}(\rm syst.)\leavevmode\nobreak\ \rm{GeV^{-2}}.

This agrees with and improves on the previous measurement of the diffractive slope of b=7.2±1.1(stat.)0.9+0.7(syst.)b=7.2\pm 1.1(\rm{stat.})^{+0.7}_{-0.9}(\rm{syst.}) GeV-2 [12].

The t𝑡t distribution was studied in two Q2superscript𝑄2Q^{2} bins, 2<Q2<72superscript𝑄272<Q^{2}<7 GeV2 and 7<Q2<1007superscript𝑄21007<Q^{2}<100 GeV2. The fitted values of b𝑏b are 7.7±0.7(stat.)0.7+0.9(syst.)GeV27.7\pm 0.7(\rm{stat.})^{+0.9}_{-0.7}(\rm{syst.})\leavevmode\nobreak\ \rm{GeV^{-2}} and 8.0±0.8(stat.)0.5+0.9(syst.)GeV28.0\pm 0.8(\rm{stat.})^{+0.9}_{-0.5}(\rm{syst.})\leavevmode\nobreak\ \rm{GeV^{-2}}, respectively. These results, presented in Fig. 5b together with the previous ZEUS measurements in photoproduction [13] and in DIS [12], show that b𝑏b is independent of Q2superscript𝑄2Q^{2} within the errors. This behaviour is expected in a QCD-based model [49].

However, the value of b𝑏b decreases with xIPsubscript𝑥𝐼𝑃x_{I\!\!P}, as shown in Fig. 5c (see also Table 1). Figure 5d shows the values of bpT2subscript𝑏superscriptsubscript𝑝𝑇2b_{p_{T}^{2}} in bins of xIPsubscript𝑥𝐼𝑃x_{I\!\!P}, calculated from the fit to dσepeXp/dpT2𝑑superscript𝜎𝑒𝑝𝑒𝑋𝑝𝑑superscriptsubscript𝑝𝑇2d\sigma^{ep\rightarrow eXp}/dp_{T}^{2}, so that they can be compared with those of a previous ZEUS publication [9]. The relationship between t𝑡t and pT2superscriptsubscript𝑝𝑇2p_{T}^{2} is given in Eq. (6). In the region of the present data, the values of b𝑏b and bpT2subscript𝑏superscriptsubscript𝑝𝑇2b_{p_{T}^{2}} differ by less than their uncertainties. The present results are consistent with those of the previous ZEUS publication [9]. The pT2superscriptsubscript𝑝𝑇2p_{T}^{2} slope reaches a minimum value for xIP0.05subscript𝑥𝐼𝑃0.05x_{I\!\!P}\approx 0.05 and then rises to bpT27subscript𝑏superscriptsubscript𝑝𝑇27b_{p_{T}^{2}}\approx 7 GeV-2 for higher xIPsubscript𝑥𝐼𝑃x_{I\!\!P} values.

In the dipole model, in which the virtual photon fluctuates into qq¯𝑞¯𝑞q\bar{q} or qq¯g𝑞¯𝑞𝑔q\bar{q}g systems, the qq¯g𝑞¯𝑞𝑔q\bar{q}g contribution dominates for β<0.2𝛽0.2\beta<0.2-0.3 [3]. Different t𝑡t dependences for the qq¯𝑞¯𝑞q\bar{q} and qq¯g𝑞¯𝑞𝑔q\bar{q}g regions are expected [49], with slopes higher by up to 3 GeV-2 at high β𝛽\beta in the diffractive peak. In addition, in the qq¯g𝑞¯𝑞𝑔q\bar{q}g region, the slope b𝑏b is expected to decrease logarithmically with xIPsubscript𝑥𝐼𝑃x_{I\!\!P}: b=b0IP2αIPlnxIP𝑏superscriptsubscript𝑏0𝐼𝑃2subscriptsuperscript𝛼𝐼𝑃subscript𝑥𝐼𝑃b=b_{0}^{I\!\!P}-2\alpha^{\prime}_{I\!\!P}\ln{x_{I\!\!P}}, the so-called shrinkage of the diffractive cone [3]. A decrease is observed in the data, and so is a significant β𝛽\beta dependence. However, these dependences are visible only over an xIPsubscript𝑥𝐼𝑃x_{I\!\!P} range, xIP< 0.07subscript𝑥𝐼𝑃<0.07x_{I\!\!P}\leavevmode\nobreak\ \raisebox{-2.79857pt}{\hbox to0.0pt{$\sim$\hss}}\raisebox{1.72218pt}{$<$}\leavevmode\nobreak\ 0.07, that goes beyond the diffractive-peak region (Fig. 5c), making a comparison with the predictions inconclusive. At higher xIPsubscript𝑥𝐼𝑃x_{I\!\!P} values, a rise of b𝑏b with xIPsubscript𝑥𝐼𝑃x_{I\!\!P} is predicted by a Regge-based model [50], though at a rate smaller than that observed in the data.

10.2 Azimuthal asymmetry

The azimuthal angle ΦΦ\Phi between the positron and proton scattering planes is sensitive to the helicity structure of the reaction epeXp𝑒𝑝𝑒𝑋𝑝ep\to eXp, as shown explicitly in Eq. (5). The analysis of the azimuthal distribution is limited to the high-Q2superscript𝑄2Q^{2} data, since the statistics of the low-Q2superscript𝑄2Q^{2} sample is too small. For this part of the analysis, a radial cut of 18 cm was imposed on the impact point of the scattered electron at the RCAL surface, along with the restriction Q2>4superscript𝑄24Q^{2}>4 GeV2. This reduces the ΦΦ\Phi dependence of the acceptance.

Figures 6a and 6b show the ΦΦ\Phi distribution for the two ranges 0.00025<xIP<0.010.00025subscript𝑥𝐼𝑃0.010.00025<x_{I\!\!P}<0.01 and 0.01<xIP<0.070.01subscript𝑥𝐼𝑃0.070.01<x_{I\!\!P}<0.07. Here again, xIP=0.01subscript𝑥𝐼𝑃0.01x_{I\!\!P}=0.01 was chosen as the transition between the high- and low-xIPsubscript𝑥𝐼𝑃x_{I\!\!P} bins such that the low-xIPsubscript𝑥𝐼𝑃x_{I\!\!P} bin is dominated by diffractive-peak events. The distributions were fitted to the form

dσepeXpdΦ1+ALTcosΦ+ATTcos2Φ,proportional-to𝑑superscript𝜎𝑒𝑝𝑒𝑋𝑝𝑑Φ1subscript𝐴𝐿𝑇Φsubscript𝐴𝑇𝑇2Φ\frac{d\sigma^{ep\rightarrow eXp}}{d\Phi}\propto 1+A_{LT}\cos{\Phi}+A_{TT}\cos{2\Phi},

where ALTsubscript𝐴𝐿𝑇A_{LT} and ATTsubscript𝐴𝑇𝑇A_{TT} are proportional to σLTγpXpsubscriptsuperscript𝜎superscript𝛾𝑝𝑋𝑝𝐿𝑇\sigma^{\gamma^{\star}p\rightarrow Xp}_{LT} and σTTγpXpsubscriptsuperscript𝜎superscript𝛾𝑝𝑋𝑝𝑇𝑇\sigma^{\gamma^{\star}p\rightarrow Xp}_{TT}, respectively. The values of the azimuthal asymmetries obtained in the fit are

ALTsubscript𝐴𝐿𝑇\displaystyle A_{LT} =\displaystyle= 0.009±0.073(stat.)0.039+0.076(syst.),\displaystyle 0.009\pm 0.073(\rm stat.)^{+0.076}_{-0.039}(\rm syst.),
ATTsubscript𝐴𝑇𝑇\displaystyle A_{TT} =\displaystyle= 0.005±0.074(stat.)0.074+0.043(syst.)\displaystyle 0.005\pm 0.074(\rm stat.)^{+0.043}_{-0.074}(\rm syst.)

and

ALTsubscript𝐴𝐿𝑇\displaystyle A_{LT} =\displaystyle= 0.007±0.048(stat.)0.071+0.043(syst.),\displaystyle 0.007\pm 0.048(\rm stat.)^{+0.043}_{-0.071}(\rm syst.),
ATTsubscript𝐴𝑇𝑇\displaystyle A_{TT} =\displaystyle= 0.019±0.046(stat.)0.053+0.026(syst.)\displaystyle 0.019\pm 0.046(\rm stat.)^{+0.026}_{-0.053}(\rm syst.)

for the ranges 0.00025<xIP<0.010.00025subscript𝑥𝐼𝑃0.010.00025<x_{I\!\!P}<0.01 and 0.01<xIP<0.070.01subscript𝑥𝐼𝑃0.070.01<x_{I\!\!P}<0.07, respectively. The interference terms between the longitudinal and transverse amplitudes and between the two transverse amplitudes thus appear to be small in the measured kinematic range, both in the diffractive-peak region and at higher xIPsubscript𝑥𝐼𝑃x_{I\!\!P} values, suggesting that the helicity structure of the reaction epeXp𝑒𝑝𝑒𝑋𝑝ep\rightarrow eXp is similar for Pomeron and Reggeon exchanges.

Figure 6c presents ALTsubscript𝐴𝐿𝑇A_{LT} as a function of xIPsubscript𝑥𝐼𝑃x_{I\!\!P} and Figs. 6d-f present ALTsubscript𝐴𝐿𝑇A_{LT} as a function of β𝛽\beta, t𝑡t and Q2superscript𝑄2Q^{2} for xIP<0.01subscript𝑥𝐼𝑃0.01x_{I\!\!P}<0.01. The asymmetry is consistent with zero in all measured bins. The results are summarised in Table 2.

The measured value of ALTsubscript𝐴𝐿𝑇A_{LT} can be compared with the results obtained in exclusive electroproduction of ρ0superscript𝜌0\rho^{0} mesons, epeρ0p𝑒𝑝𝑒superscript𝜌0𝑝ep\rightarrow e\rho^{0}p, in which the hadronic final state, X𝑋X, consists of a ρ0superscript𝜌0\rho^{0} meson only. In this case, ALT=2ϵ(1+ϵ)(r005+2r115)=0.262±0.038(stat.)±0.068(syst.)A_{LT}=-\sqrt{2\epsilon(1+\epsilon)}\cdot(r^{5}_{00}+2r^{5}_{11})=-0.262\pm 0.038(\rm{stat.})\pm 0.068(\rm{syst.}), where r005subscriptsuperscript𝑟500r^{5}_{00} and r115subscriptsuperscript𝑟511r^{5}_{11} are two of the ρ0superscript𝜌0\rho^{0} spin-density matrix elements [51]. The present data show that the asymmetry is smaller for inclusive scattering than for exclusive ρ0superscript𝜌0\rho^{0} electroproduction.

There are numerous pQCD-based predictions for the behaviour of ALTsubscript𝐴𝐿𝑇A_{LT} [52, 53, 54, 55] in the diffractive peak, mostly concerning the high-β𝛽\beta region (β>0.6𝛽0.6\beta>0.6-0.9), where the asymmetry is expected to be largest, reflecting the large expected value of σLγpXpsuperscriptsubscript𝜎𝐿superscript𝛾𝑝𝑋𝑝\sigma_{L}^{\gamma^{\star}p\rightarrow Xp}; this region was not accessible due to limited statistics. In all calculations, back-to-back configurations, i.e. ALT<0subscript𝐴𝐿𝑇0A_{LT}<0, are favoured; the asymmetry is expected to be close to zero at low β𝛽\beta, in agreement with the present data.

The measurement of the ΦΦ\Phi dependence can, in principle, be used to constrain the cross section of longitudinally polarised photons [55, 53, 54], a quantity notoriously difficult to extract unless data at different centre-of-mass energies are available. No experimental results on σLγpXpsubscriptsuperscript𝜎superscript𝛾𝑝𝑋𝑝𝐿\sigma^{\gamma^{\star}p\rightarrow Xp}_{L} exist so far. The asymmetry ALTsubscript𝐴𝐿𝑇A_{LT} can be related to RDsuperscript𝑅𝐷R^{D} [55]; however, only for β>0.8𝛽0.8\beta>0.8-0.9, beyond the region covered by the present data, is the determination of RDsuperscript𝑅𝐷R^{D} model-independent. More general limits can be obtained for σLγpXpsubscriptsuperscript𝜎superscript𝛾𝑝𝑋𝑝𝐿\sigma^{\gamma^{\star}p\rightarrow Xp}_{L}; using hermiticity and parity conservation, the following relations are found [53, 54]:

2(σLTγpXp)2σ0σTTγpXpσLγpXpσ0σTTγpXpϵ,2superscriptsubscriptsuperscript𝜎superscript𝛾𝑝𝑋𝑝𝐿𝑇2subscript𝜎0subscriptsuperscript𝜎superscript𝛾𝑝𝑋𝑝𝑇𝑇subscriptsuperscript𝜎superscript𝛾𝑝𝑋𝑝𝐿subscript𝜎0subscriptsuperscript𝜎superscript𝛾𝑝𝑋𝑝𝑇𝑇italic-ϵ\frac{2(\sigma^{\gamma^{*}p\rightarrow Xp}_{LT})^{2}}{\sigma_{0}-\sigma^{\gamma^{*}p\rightarrow Xp}_{TT}}\leq\sigma^{\gamma^{*}p\rightarrow Xp}_{L}\leq\frac{\sigma_{0}-\sigma^{\gamma^{*}p\rightarrow Xp}_{TT}}{\epsilon}, (10)

where σ0=σTγpXp+ϵσLγpXpsubscript𝜎0subscriptsuperscript𝜎superscript𝛾𝑝𝑋𝑝𝑇italic-ϵsubscriptsuperscript𝜎superscript𝛾𝑝𝑋𝑝𝐿\sigma_{0}=\sigma^{\gamma^{*}p\rightarrow Xp}_{T}+\epsilon\sigma^{\gamma^{*}p\rightarrow Xp}_{L}. The larger the values of the interference terms σLTγpXpsubscriptsuperscript𝜎superscript𝛾𝑝𝑋𝑝𝐿𝑇\sigma^{\gamma^{*}p\rightarrow Xp}_{LT} and σTTγpXpsubscriptsuperscript𝜎superscript𝛾𝑝𝑋𝑝𝑇𝑇\sigma^{\gamma^{*}p\rightarrow Xp}_{TT}, the stronger the constraint on σLγpXpsuperscriptsubscript𝜎𝐿superscript𝛾𝑝𝑋𝑝\sigma_{L}^{\gamma^{\star}p\rightarrow Xp}. The fact that in the present data the measured asymmetries ALTsubscript𝐴𝐿𝑇A_{LT} and ATTsubscript𝐴𝑇𝑇A_{TT} are consistent with zero implies that the interference terms σLTγpXpsubscriptsuperscript𝜎superscript𝛾𝑝𝑋𝑝𝐿𝑇\sigma^{\gamma^{*}p\rightarrow Xp}_{LT} and σTTγpXpsubscriptsuperscript𝜎superscript𝛾𝑝𝑋𝑝𝑇𝑇\sigma^{\gamma^{*}p\rightarrow Xp}_{TT} are also consistent with zero. In this case, the inequalities (10) are trivially satisfied and give no information on σLγpXpsuperscriptsubscript𝜎𝐿superscript𝛾𝑝𝑋𝑝\sigma_{L}^{\gamma^{\star}p\rightarrow Xp}.

10.3 𝑸𝟐superscript𝑸2Q^{2} dependence of 𝒅𝝈𝜸𝒑𝑿𝒑/𝒅𝑴𝑿𝒅superscript𝝈bold-→superscript𝜸bold-⋆𝒑𝑿𝒑𝒅subscript𝑴𝑿d\sigma^{\gamma^{\star}p\rightarrow Xp}/dM_{X}

Figure 7 shows the cross-section dσγpXp/dMX𝑑superscript𝜎superscript𝛾𝑝𝑋𝑝𝑑subscript𝑀𝑋d\sigma^{\gamma^{\star}p\rightarrow Xp}/dM_{X} as a function of Q2superscript𝑄2Q^{2} for different MXsubscript𝑀𝑋M_{X} and W𝑊W values. The data are also presented in Tables 3 and 4. The present measurements are shown together with the previous ZEUS results at low [8] and high Q2superscript𝑄2Q^{2} [10]; the latter have been corrected for the residual double-dissociative background, taken to be 31%percent3131\%, as determined [10] by comparing those data with the LPS results [12] 444As discussed in Section 10.5, a higher fraction was measured at lower Q2superscript𝑄2Q^{2} [8].. The present results are consistent with the earlier ZEUS measurements [10, 8] and cover a wider kinematic region; notably, they reach higher values of MXsubscript𝑀𝑋M_{X}, lower values of Q2superscript𝑄2Q^{2}, as well as values of W𝑊W close to the kinematic limit. The points at MX=5subscript𝑀𝑋5M_{X}=5 GeV are all in the diffractive-peak region, since xIP<0.01subscript𝑥𝐼𝑃0.01x_{I\!\!P}<0.01. The other bins have contributions from xIP>0.01subscript𝑥𝐼𝑃0.01x_{I\!\!P}>0.01. In all regions of xIPsubscript𝑥𝐼𝑃x_{I\!\!P}, the data exhibit a behaviour qualitatively similar to that of the total γpsuperscript𝛾𝑝\gamma^{*}p cross section, σtotγpsuperscriptsubscript𝜎totsuperscript𝛾𝑝\sigma_{{\rm tot}}^{\gamma^{\star}p}: dσγpXp/dMX𝑑superscript𝜎superscript𝛾𝑝𝑋𝑝𝑑subscript𝑀𝑋d\sigma^{\gamma^{\star}p\rightarrow Xp}/dM_{X} falls rapidly with Q2superscript𝑄2Q^{2} at high Q2superscript𝑄2Q^{2}; as Q20superscript𝑄20Q^{2}\rightarrow 0, the cross-section dependence on Q2superscript𝑄2Q^{2} becomes weak, with dσγpXp/dMX𝑑superscript𝜎superscript𝛾𝑝𝑋𝑝𝑑subscript𝑀𝑋d\sigma^{\gamma^{\star}p\rightarrow Xp}/dM_{X} approaching a constant, as expected from the conservation of the electromagnetic current. The behaviour of dσγpXp/dMX𝑑superscript𝜎superscript𝛾𝑝𝑋𝑝𝑑subscript𝑀𝑋d\sigma^{\gamma^{\star}p\rightarrow Xp}/dM_{X} cannot be fitted with a simple, form-factor-like function of the type 1/(Q2+MX2)n1superscriptsuperscript𝑄2superscriptsubscript𝑀𝑋2𝑛1/(Q^{2}+M_{X}^{2})^{n}, but is described by a pQCD-based model [56] at xIP< 0.01subscript𝑥𝐼𝑃<0.01x_{I\!\!P}\leavevmode\nobreak\ \raisebox{-2.79857pt}{\hbox to0.0pt{$\sim$\hss}}\raisebox{1.72218pt}{$<$}\leavevmode\nobreak\ 0.01 and large Q2superscript𝑄2Q^{2} (see the continuous curves in Fig. 7). This model and the comparison between its predictions and the data, as well as the curves on Fig. 7, are discussed in Section 10.7.

A direct comparison between dσγpXp/dMX𝑑superscript𝜎superscript𝛾𝑝𝑋𝑝𝑑subscript𝑀𝑋d\sigma^{\gamma^{\star}p\rightarrow Xp}/dM_{X} and the total photon-proton cross section is shown in Fig. 8, where the ratio (MX2dσγpXp/dMX2)/σtotγpsubscriptsuperscript𝑀2𝑋𝑑superscript𝜎superscript𝛾𝑝𝑋𝑝𝑑subscriptsuperscript𝑀2𝑋superscriptsubscript𝜎totsuperscript𝛾𝑝(M^{2}_{X}d\sigma^{\gamma^{\star}p\rightarrow Xp}/dM^{2}_{X})/\sigma_{{\rm tot}}^{\gamma^{\star}p} is presented as a function of Q2superscript𝑄2Q^{2} at different MXsubscript𝑀𝑋M_{X} and W𝑊W values. The values of the γpsuperscript𝛾𝑝\gamma^{\star}p total cross section were obtained from the ALLM97 parameterisation [57], which is consistent with the latest H1 and ZEUS F2subscript𝐹2F_{2} data [58]. The plot shows that, in spite of their qualitative similarity, dσγpXp/dMX𝑑superscript𝜎superscript𝛾𝑝𝑋𝑝𝑑subscript𝑀𝑋d\sigma^{\gamma^{\star}p\rightarrow Xp}/dM_{X} and the total cross section exhibit some differences in their Q2superscript𝑄2Q^{2} dependences. In the bin at MX=5subscript𝑀𝑋5M_{X}=5 GeV, which has data from the diffractive peak region only, the ratio grows slowly with Q2superscript𝑄2Q^{2} for Q2<MX2superscript𝑄2superscriptsubscript𝑀𝑋2Q^{2}<M_{X}^{2} and then falls in the region dominated by qq¯𝑞¯𝑞q\bar{q} fluctuations of the photon. At higher MXsubscript𝑀𝑋M_{X} values, which correspond to xIPsubscript𝑥𝐼𝑃x_{I\!\!P} larger than 0.01, Q2superscript𝑄2Q^{2} is always smaller than MX2superscriptsubscript𝑀𝑋2M_{X}^{2} and the ratio grows, indicating a softer Q2superscript𝑄2Q^{2} dependence of dσγpXp/dMX2𝑑superscript𝜎superscript𝛾𝑝𝑋𝑝𝑑subscriptsuperscript𝑀2𝑋d\sigma^{\gamma^{\star}p\rightarrow Xp}/dM^{2}_{X} than of σtotγpsubscriptsuperscript𝜎superscript𝛾𝑝tot\sigma^{\gamma^{\star}p}_{{\rm tot}}. Here again, the low-xIPsubscript𝑥𝐼𝑃x_{I\!\!P} data in the high-Q2superscript𝑄2Q^{2} region can be described by pQCD-based models of diffraction, as argued in Section 10.7, where the curves on Fig. 8 are discussed.

10.4 The structure function 𝑭𝟐𝑫(𝟑)superscriptsubscript𝑭2𝑫3F_{2}^{D(3)}

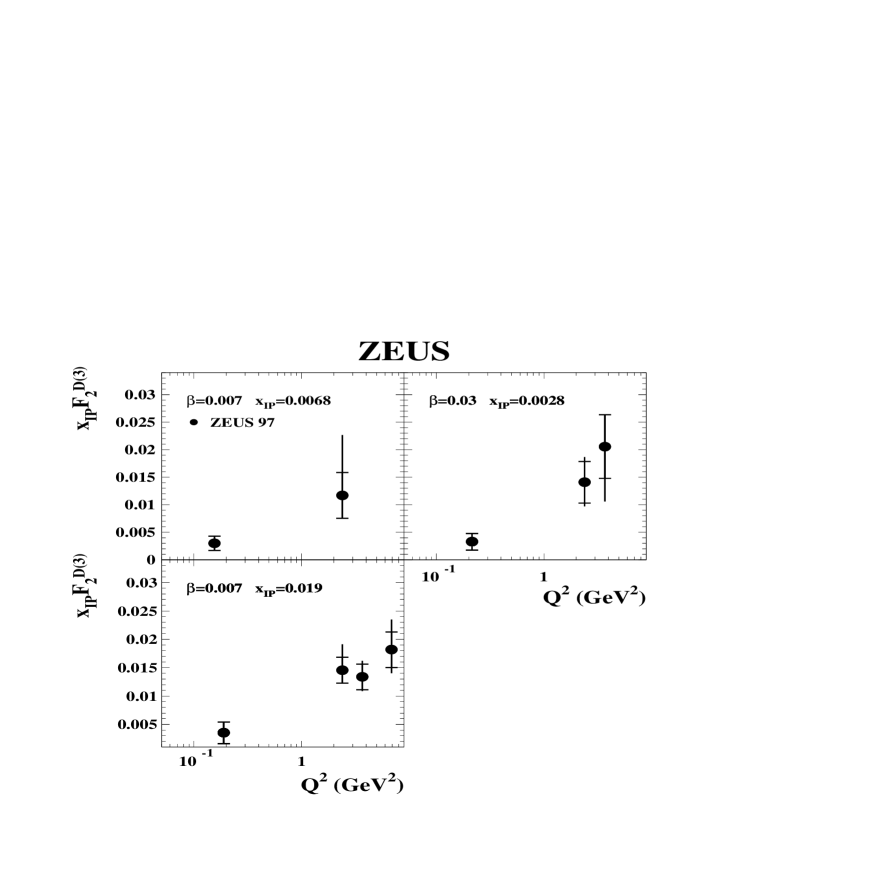
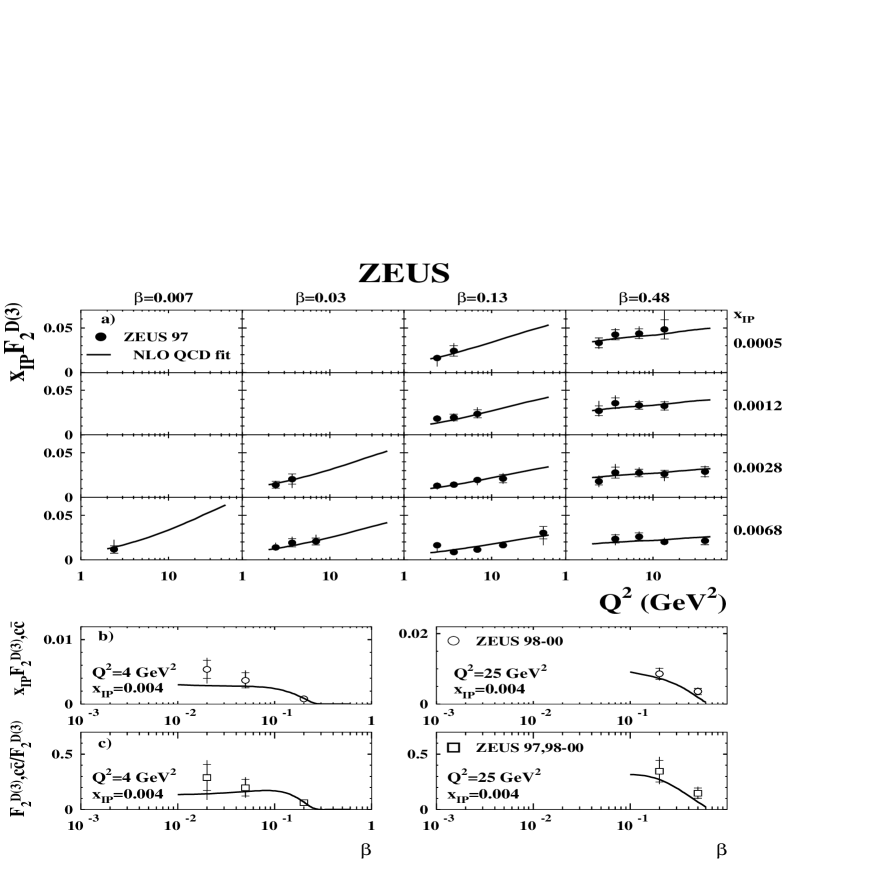
The data of Fig. 7 are presented in Fig. 9 (see also Tables 5-9) in terms of the structure function F2D(3)superscriptsubscript𝐹2𝐷3F_{2}^{D(3)}, evaluated under the assumption that RD=0superscript𝑅𝐷0R^{D}=0. As discussed in Section 2, F2D(3)superscriptsubscript𝐹2𝐷3F_{2}^{D(3)} is defined in this paper as the integral of F2D(4)superscriptsubscript𝐹2𝐷4F_{2}^{D(4)} over the range 0<|t|<10𝑡10<|t|<1 GeV2. The figure shows xIPF2D(3)(β,Q2,xIP)subscript𝑥𝐼𝑃superscriptsubscript𝐹2𝐷3𝛽superscript𝑄2subscript𝑥𝐼𝑃x_{I\!\!P}F_{2}^{D(3)}(\beta,Q^{2},x_{I\!\!P}) as a function of xIPsubscript𝑥𝐼𝑃x_{I\!\!P} for different values of β𝛽\beta and Q2superscript𝑄2Q^{2}. In order to maximise the kinematic overlap between the low-Q2superscript𝑄2Q^{2} and the high-Q2superscript𝑄2Q^{2} samples, only a subset of the low-Q2superscript𝑄2Q^{2} sample is presented in Fig. 9 and Table 5. The values of xIPF2D(3)subscript𝑥𝐼𝑃superscriptsubscript𝐹2𝐷3x_{I\!\!P}F_{2}^{D(3)} decrease with xIPsubscript𝑥𝐼𝑃x_{I\!\!P} at small xIPsubscript𝑥𝐼𝑃x_{I\!\!P}, indicating that F2D(3)superscriptsubscript𝐹2𝐷3F_{2}^{D(3)} falls with xIPsubscript𝑥𝐼𝑃x_{I\!\!P} faster than 1/xIP1subscript𝑥𝐼𝑃1/x_{I\!\!P}. At larger xIPsubscript𝑥𝐼𝑃x_{I\!\!P}, xIPF2D(3)subscript𝑥𝐼𝑃superscriptsubscript𝐹2𝐷3x_{I\!\!P}F_{2}^{D(3)} flattens and, in some bins, increases with xIPsubscript𝑥𝐼𝑃x_{I\!\!P}, indicating a softer dependence of F2D(3)superscriptsubscript𝐹2𝐷3F_{2}^{D(3)} on xIPsubscript𝑥𝐼𝑃x_{I\!\!P}. The xIPsubscript𝑥𝐼𝑃x_{I\!\!P} dependence can be parameterised in terms of the Pomeron intercept αIP(0)subscript𝛼𝐼𝑃0\alpha_{I\!\!P}(0). The extraction of αIP(0)subscript𝛼𝐼𝑃0\alpha_{I\!\!P}(0) is presented in Section 10.6, where the curves in Fig. 9 are discussed.

The dependences of the structure function on Q2superscript𝑄2Q^{2} and β𝛽\beta are presented in Figs. 10-12 for different values of xIPsubscript𝑥𝐼𝑃x_{I\!\!P}. The structure function rises with Q2superscript𝑄2Q^{2} in all of the explored kinematic region. Figure 10 compares the low-Q2superscript𝑄2Q^{2} and high-Q2superscript𝑄2Q^{2} results in the xIPsubscript𝑥𝐼𝑃x_{I\!\!P}-β𝛽\beta region where they overlap. Between the low- and high-Q2superscript𝑄2Q^{2} data, i.e. between Q20.15similar-to-or-equalsdelimited-⟨⟩superscript𝑄20.15\langle Q^{2}\rangle\simeq 0.15 GeV2 and Q210.5similar-to-or-equalsdelimited-⟨⟩superscript𝑄210.5\langle Q^{2}\rangle\simeq 10.5 GeV2, the increase is about a factor five; this steep rise, F2DQ2proportional-tosuperscriptsubscript𝐹2𝐷superscript𝑄2F_{2}^{D}\propto Q^{2}, reflects the flattening of dσγpXp/dMX𝑑superscript𝜎superscript𝛾𝑝𝑋𝑝𝑑subscript𝑀𝑋d\sigma^{\gamma^{\star}p\rightarrow Xp}/dM_{X} for Q20superscript𝑄20Q^{2}\rightarrow 0 (see Eqs. (1), (4)), and is a consequence of the conservation of the electromagnetic current. The Q2superscript𝑄2Q^{2} dependence becomes slower in the high-Q2superscript𝑄2Q^{2} data (Fig. 11). In this region, the rise can be interpreted as a manifestation of QCD evolution; these positive scaling violations are due to the large gluon contribution to F2Dsuperscriptsubscript𝐹2𝐷F_{2}^{D} (see Section 10.7.3). The behaviour is similar in all xIPsubscript𝑥𝐼𝑃x_{I\!\!P} bins, both in the diffractive-peak region and at larger xIPsubscript𝑥𝐼𝑃x_{I\!\!P} values, suggesting that the QCD evolution of the diffractive PDFs is largely independent of xIPsubscript𝑥𝐼𝑃x_{I\!\!P}. The β𝛽\beta dependence of F2D(3)superscriptsubscript𝐹2𝐷3F_{2}^{D(3)} (Fig. 12) has instead a different behaviour at different values of xIPsubscript𝑥𝐼𝑃x_{I\!\!P}: at small xIPsubscript𝑥𝐼𝑃x_{I\!\!P}, F2D(3)superscriptsubscript𝐹2𝐷3F_{2}^{D(3)} has a weak β𝛽\beta dependence with a tendency to rise at large values of β𝛽\beta; for xIP> 0.02subscript𝑥𝐼𝑃>0.02x_{I\!\!P}\leavevmode\nobreak\ \raisebox{-2.79857pt}{\hbox to0.0pt{$\sim$\hss}}\raisebox{1.72218pt}{$>$}\leavevmode\nobreak\ 0.02, F2D(3)superscriptsubscript𝐹2𝐷3F_{2}^{D(3)} decreases as β𝛽\beta approaches unity, as expected in a hadron (bearing in mind that β𝛽\beta is the equivalent of Bjorken-x𝑥x for the exchange). The solid curves shown on Figs. 11 and 12 are the predictions from a pQCD-based model [59] valid in the diffractive region and discussed in Section 10.7.2.

The structure function F2D(3)superscriptsubscript𝐹2𝐷3F_{2}^{D(3)} and the inclusive proton structure function F2subscript𝐹2F_{2} are compared in terms of the ratio xIPF2D(3)(xIP,x,Q2)/F2(x,Q2)subscript𝑥𝐼𝑃superscriptsubscript𝐹2𝐷3subscript𝑥𝐼𝑃𝑥superscript𝑄2subscript𝐹2𝑥superscript𝑄2x_{I\!\!P}F_{2}^{D(3)}(x_{I\!\!P},x,Q^{2})/F_{2}(x,Q^{2}) calculated at fixed values of xIPsubscript𝑥𝐼𝑃x_{I\!\!P}. The values of F2(x,Q2)subscript𝐹2𝑥superscript𝑄2F_{2}(x,Q^{2}) were obtained from the ALLM97 parameterisation. The ratio is presented in Figs. 13 and 14 as a function of Q2superscript𝑄2Q^{2} and x𝑥x, respectively. The x𝑥x range covered by the data is 5×10⁵<x< 5×1025superscript105<𝑥<5superscript1025\times 10^{-5}\leavevmode\nobreak\ \raisebox{-2.79857pt}{\hbox to0.0pt{$\sim$\hss}}\raisebox{1.72218pt}{$<$}\leavevmode\nobreak\ x\leavevmode\nobreak\ \raisebox{-2.79857pt}{\hbox to0.0pt{$\sim$\hss}}\raisebox{1.72218pt}{$<$}\leavevmode\nobreak\ 5\times 10^{-2}. The ratio is largely Q2superscript𝑄2Q^{2}-independent, with possibly some structure at high β𝛽\beta and low xIPsubscript𝑥𝐼𝑃x_{I\!\!P}. A Q2superscript𝑄2Q^{2}-independent ratio would indicate equal scaling violations in the proton for the reaction γpXpsuperscript𝛾𝑝𝑋𝑝\gamma^{\star}p\rightarrow Xp and for inclusive DIS. The ratio grows with x𝑥x in the diffractive-peak region, suggesting that the x𝑥x dependence of the proton PDFs is different when the proton is probed in γpXpsuperscript𝛾𝑝𝑋𝑝\gamma^{\star}p\rightarrow Xp and in inclusive DIS. At higher xIPsubscript𝑥𝐼𝑃x_{I\!\!P}, xIP> 0.02subscript𝑥𝐼𝑃>0.02x_{I\!\!P}\leavevmode\nobreak\ \raisebox{-2.79857pt}{\hbox to0.0pt{$\sim$\hss}}\raisebox{1.72218pt}{$>$}\leavevmode\nobreak\ 0.02, the ratio becomes flatter.

10.5 Comparison with the results of the 𝑴𝑿subscript𝑴𝑿M_{X} method and of H1

In this section, the present results are compared with those obtained with the MXsubscript𝑀𝑋M_{X} method [10] and with the H1 results obtained with the rapidity-gap technique [15].

The MXsubscript𝑀𝑋M_{X}-method analysis [10] includes events in which the proton diffractively dissociates into a system N𝑁N of mass MN< 5.5subscript𝑀𝑁<5.5M_{N}\leavevmode\nobreak\ \raisebox{-2.79857pt}{\hbox to0.0pt{$\sim$\hss}}\raisebox{1.72218pt}{$<$}\leavevmode\nobreak\ 5.5 GeV. In order to facilitate the comparison, the present data were replotted using the binning of the MXsubscript𝑀𝑋M_{X}-method publication [10].

The MXsubscript𝑀𝑋M_{X}-method points are higher than those obtained with the LPS method. The difference was quantified by means of BEKW-type fits to the two data sets (see Section 10.7.1), which give a ratio of the MXsubscript𝑀𝑋M_{X}-method to LPS points of RMX=1.55±0.080.17+0.15subscript𝑅subscript𝑀𝑋plus-or-minus1.55subscriptsuperscript0.080.150.17R_{M_{X}}=1.55\pm 0.08^{+0.15}_{-0.17}, where the first error includes the statistical and systematic uncertainties and the second is due to the normalisation uncertainty. Figure 15 shows xIPF2D(3)subscript𝑥𝐼𝑃superscriptsubscript𝐹2𝐷3x_{I\!\!P}F_{2}^{D(3)} for the two data sets after scaling down the MXsubscript𝑀𝑋M_{X}-method points by RMXsubscript𝑅subscript𝑀𝑋R_{M_{X}}. The agreement between the LPS points and the renormalised MXsubscript𝑀𝑋M_{X}-method results is good, indicating that the difference is mainly in the normalisation. The normalisation difference can be attributed to the residual p𝑝p-dissociative background in the MXsubscript𝑀𝑋M_{X} method. This background was estimated in previous studies [10] by comparing the MXsubscript𝑀𝑋M_{X} results [10] and the earlier LPS data [12]; there the ratio RMXsubscript𝑅subscript𝑀𝑋R_{M_{X}} was found to be RMX=1.450.23+0.34subscript𝑅subscript𝑀𝑋subscriptsuperscript1.450.340.23R_{M_{X}}=1.45^{+0.34}_{-0.23}, consistent with the present result. A similar study was performed [8] for the BPC region, resulting in RMX=1.85±0.38(stat.)R_{M_{X}}=1.85\pm 0.38\leavevmode\nobreak\ (\rm stat.), which is also consistent with the present measurement. The measured value of RMXsubscript𝑅subscript𝑀𝑋R_{M_{X}} corresponds to a percentage of p𝑝p-dissociative events in the sample of Rdiss=(11/RMX)=[35.5±3.37.1+6.2]%subscript𝑅diss11subscript𝑅subscript𝑀𝑋percentdelimited-[]plus-or-minus35.5subscriptsuperscript3.36.27.1R_{\rm diss}=(1-1/R_{M_{X}})=[35.5\pm 3.3^{+6.2}_{-7.1}]\%; the first error corresponds to the statistical and systematic uncertainties in quadrature, the second is due to the normalisation uncertainty.

The agreement between the LPS and the MXsubscript𝑀𝑋M_{X}-method results, after taking the proton-dissociative background into account, lends support to the assumptions on which the MXsubscript𝑀𝑋M_{X} method is based.

Figure 16 shows a comparison of the present F2D(3)superscriptsubscript𝐹2𝐷3F_{2}^{D(3)} results with those of the H1 collaboration obtained with the rapidity-gap selection [15]. These data include a p𝑝p-dissociative contribution with MN<1.6subscript𝑀𝑁1.6M_{N}<1.6 GeV. The data are plotted in terms of xIPF2D(3)subscript𝑥𝐼𝑃superscriptsubscript𝐹2𝐷3x_{I\!\!P}F_{2}^{D(3)} as a function of xIPsubscript𝑥𝐼𝑃x_{I\!\!P} in different β𝛽\beta and Q2superscript𝑄2Q^{2} bins. The ZEUS points were extrapolated to the H1 bin centres using the measured dependences. At small xIPsubscript𝑥𝐼𝑃x_{I\!\!P}, xIP<0.01subscript𝑥𝐼𝑃0.01x_{I\!\!P}<0.01, the agreement is good, although with a tendency for the H1 points to be higher than the present results at high Q2superscript𝑄2Q^{2}. While a normalisation difference is consistent with the presence of a p𝑝p-dissociative contribution in the H1 data, a Q2superscript𝑄2Q^{2} dependence of this difference is not expected. The comparison indicates that the H1 data have a stronger Q2superscript𝑄2Q^{2} dependence than the present data. For xIP>0.01subscript𝑥𝐼𝑃0.01x_{I\!\!P}>0.01, the H1 data are also higher, but the shape is somewhat different, with a larger Reggeon-like contribution in the H1 data.

10.6 Extraction of the Pomeron intercept

In the framework of Regge phenomenology, the xIPsubscript𝑥𝐼𝑃x_{I\!\!P} dependence of F2D(3)superscriptsubscript𝐹2𝐷3F_{2}^{D(3)} is related to the intercept of the Pomeron trajectory, the parameter that drives the energy dependence of the total hadron-hadron cross section at high energies [3]. The Pomeron intercept has been determined to be 1.09640.0091+0.0115subscriptsuperscript1.09640.01150.00911.0964^{+0.0115}_{-0.0091} [60] in soft hadronic interactions. However, the same parameter is significantly larger in the diffractive production of heavy vector mesons, notably in J/ψ𝐽𝜓J/\psi photoproduction (see e.g. [2]), reflecting the rapid rise of the cross section with W𝑊W. This is a consequence of the increase of the parton densities in the proton at low x𝑥x, which drives the rise of the cross section with decreasing x𝑥x, and hence with decreasing xIPsubscript𝑥𝐼𝑃x_{I\!\!P} (since xIP1/W2xproportional-tosubscript𝑥𝐼𝑃1superscript𝑊2proportional-to𝑥x_{I\!\!P}\propto 1/W^{2}\propto x). It is interesting to determine if such a deviation from the behaviour of the hadron-hadron data is also apparent in the inclusive diffractive dissociation of virtual photons.

The high-Q2superscript𝑄2Q^{2} data of Fig. 9 with xIP<0.01subscript𝑥𝐼𝑃0.01x_{I\!\!P}<0.01 were fitted to the form:

F2D(3)(β,Q2,xIP)=fIP(xIP)F2IP(β,Q2),superscriptsubscript𝐹2𝐷3𝛽superscript𝑄2subscript𝑥𝐼𝑃subscript𝑓𝐼𝑃subscript𝑥𝐼𝑃superscriptsubscript𝐹2𝐼𝑃𝛽superscript𝑄2F_{2}^{D(3)}(\beta,Q^{2},x_{I\!\!P})=f_{I\!\!P}(x_{I\!\!P})\cdot F_{2}^{I\!\!P}(\beta,Q^{2}),

i.e. assuming “Regge factorisation” (see Section 7). The Pomeron flux was parameterised as [1]

fIP(xIP)=eb0IPtxIP2αIP(t)1𝑑t.subscript𝑓𝐼𝑃subscript𝑥𝐼𝑃superscript𝑒superscriptsubscript𝑏0𝐼𝑃𝑡superscriptsubscript𝑥𝐼𝑃2subscript𝛼𝐼𝑃𝑡1differential-d𝑡f_{I\!\!P}(x_{I\!\!P})=\int{\frac{e^{b_{0}^{I\!\!P}t}}{x_{I\!\!P}^{2\alpha_{I\!\!P}(t)-1}}dt}.

The parameter αIPsuperscriptsubscript𝛼𝐼𝑃\alpha_{I\!\!P}^{\prime} was set to 0.250.250.25 GeV-2, consistent with the hadron-hadron data [61]. The parameter b0IPsuperscriptsubscript𝑏0𝐼𝑃b_{0}^{I\!\!P} was taken to be 4.67 GeV-2, such that the relation b=b0IP2αIPlnxIP𝑏superscriptsubscript𝑏0𝐼𝑃2superscriptsubscript𝛼𝐼𝑃subscript𝑥𝐼𝑃b=b_{0}^{I\!\!P}-2\alpha_{I\!\!P}^{\prime}\ln{x_{I\!\!P}} [3] reproduces the results of Section 10.1. The values of F2IP(β,Q2)superscriptsubscript𝐹2𝐼𝑃𝛽superscript𝑄2F_{2}^{I\!\!P}(\beta,Q^{2}) in each β𝛽\beta and Q2superscript𝑄2Q^{2} bin and the Pomeron intercept (assumed to be β𝛽\beta and Q2superscript𝑄2Q^{2} independent) were treated as free parameters. The resulting Pomeron intercept is

αIP(0)=1.16±0.02(stat.)±0.02(syst.).\alpha_{I\!\!P}(0)=1.16\pm 0.02\leavevmode\nobreak\ (\rm stat.)\pm 0.02(\rm syst.).

Varying αIPsuperscriptsubscript𝛼𝐼𝑃\alpha_{I\!\!P}^{\prime} in the range 0<αIP<0.40superscriptsubscript𝛼𝐼𝑃0.40<\alpha_{I\!\!P}^{\prime}<0.4 GeV-2 causes αIP(0)subscript𝛼𝐼𝑃0\alpha_{I\!\!P}(0) to change by 0.030+0.011subscriptsuperscriptabsent0.0110.030{}^{+0.011}_{-0.030}; the chosen range includes the small values of αIPsuperscriptsubscript𝛼𝐼𝑃\alpha_{I\!\!P}^{\prime} measured in the diffractive photoproduction of J/ψ𝐽𝜓J/\psi mesons [62]. A variation of RDsuperscript𝑅𝐷R^{D} between 0 and 1 produces a change of αIP(0)subscript𝛼𝐼𝑃0\alpha_{I\!\!P}(0) of +0.0170.017{+0.017}. The quality of the fit is good, with χ2/ndf=14.2/22superscript𝜒2𝑛𝑑𝑓14.222\chi^{2}/ndf=14.2/22 (considering statistical uncertainties only). The fact that the same value of αIP(0)subscript𝛼𝐼𝑃0\alpha_{I\!\!P}(0) fits the whole Q2superscript𝑄2Q^{2}, β𝛽\beta region covered by the data indicates that, within the present accuracy, the hypothesis of Regge factorisation is a good approximation. The result does not change if the fit is extended to the low-Q2superscript𝑄2Q^{2} region; in this case χ2/ndf=14.6/28superscript𝜒2𝑛𝑑𝑓14.628\chi^{2}/ndf=14.6/28 (statistical uncertainties only). The result of this latter fit is shown in Fig. 9. The extrapolation of the fit for xIP>0.01subscript𝑥𝐼𝑃0.01x_{I\!\!P}>0.01, where the contribution from the exchange of the Reggeon trajectory becomes important, is also shown; indeed the fit does not describe this region satisfactorily. The present value of αIP(0)subscript𝛼𝐼𝑃0\alpha_{I\!\!P}(0) is consistent with that from H1, αIP(0)=1.203±0.020(stat.)±0.013(syst.)0.035+0.030(model)\alpha_{I\!\!P}(0)=1.203\pm 0.020{\rm(stat.)}\pm 0.013{\rm(syst.)}^{+0.030}_{-0.035}{\rm(model)} (measured in the region 4.5<Q2<754.5superscript𝑄2754.5<Q^{2}<75 GeV2[15], and with the earlier ZEUS result, αIP(0)=1.157±0.009(stat.)0.012+0.039(syst.)\alpha_{I\!\!P}(0)=1.157\pm 0.009{\rm(stat.)}^{+0.039}_{-0.012}{\rm(syst.)} (measured in the region 7<Q2<1407superscript𝑄21407<Q^{2}<140 GeV2[10]; it is higher than that of the soft Pomeron, suggesting that the parton densities probed in inclusive diffractive ep𝑒𝑝ep interactions also increase rapidly at small x𝑥x and that a single Pomeron trajectory cannot simultaneously describe the high-Q2superscript𝑄2Q^{2} diffractive data and the soft hadron-hadron data.

10.7 Comparison with models

As discussed earlier, the diffractive dissociation of virtual photons can be described in pQCD since the virtuality of the photon provides a hard scale. In the proton rest frame, the reaction can be viewed as the sequence of the photon fluctuating into a qq¯𝑞¯𝑞q\bar{q} (or qq¯g𝑞¯𝑞𝑔q\bar{q}g) colour dipole, the dipole scattering off the proton and producing the final state X𝑋X. At high centre-of-mass energies, these processes are widely separated in time. The qq¯𝑞¯𝑞q\bar{q}, qq¯g𝑞¯𝑞𝑔q\bar{q}g fluctuations are described in terms of the photon wavefunction derived from QCD. The interaction of the dipole with the proton is mediated, in the lowest order, by the exchange of two gluons in a colour-singlet state.

Several models of inclusive diffraction are available, which are discussed in review articles [2, 3]. The discussion of this section is restricted to two approaches based on the framework just outlined. The data were fitted (Section 10.7.1) with a parameterisation based on the model of Bartels et al. (BEKW) [56], which gives a satisfactory description of the earlier ZEUS results [10, 8]. It is interesting to see if the same parameterisation is able to describe the present data which cover a wider kinematic region; the fit is also a useful tool to compare the present data and those based on the ZEUS analysis using the MXsubscript𝑀𝑋M_{X} method [10].

In Section 10.7.2, the results of this paper are also compared with the Golec-Biernat and Wüsthoff model based on the idea of the saturation of the dipole-proton cross section [63, *gbw2, *gbw3], which successfully describes both the inclusive ep𝑒𝑝ep scattering data and earlier diffractive data.

Finally, Section 10.7.3 describes the results of an NLO QCD fit to the present high-Q2superscript𝑄2Q^{2} data. In this approach, the Q2superscript𝑄2Q^{2} dependence of the data is interpreted as due to the QCD evolution of the diffractive PDFs. A parameterisation of the diffractive PDFs at a starting scale is evolved according to the QCD evolution equations and fitted to the data.

10.7.1 BEKW fit

In the BEKW model [56], the dominant (leading-twist) contributions to the diffractive cross section in the kinematic domain of the present measurement come from fluctuations of transversely polarised virtual photons into either qq¯𝑞¯𝑞q\bar{q} or qq¯g𝑞¯𝑞𝑔q\bar{q}g states. The β𝛽\beta (and hence MXsubscript𝑀𝑋M_{X}) spectra of these two components are determined by general properties of the photon wave-function, with the qq¯𝑞¯𝑞q\bar{q} contribution to the cross section proportional to β(1β)𝛽1𝛽\beta(1-\beta) and the qq¯g𝑞¯𝑞𝑔q\bar{q}g contribution proportional to (1β)γsuperscript1𝛽𝛾(1-\beta)^{\gamma}, where γ𝛾\gamma is a free parameter. For small values of MXsubscript𝑀𝑋M_{X}, the qq¯𝑞¯𝑞q\bar{q} states dominate, while at large masses the qq¯g𝑞¯𝑞𝑔q\bar{q}g contribution becomes dominant. The model does not fix the xIPsubscript𝑥𝐼𝑃x_{I\!\!P} dependence of the qq¯𝑞¯𝑞q\bar{q} and qq¯g𝑞¯𝑞𝑔q\bar{q}g contributions, but assumes for both a power-like behaviour, xIPn(Q2)superscriptsubscript𝑥𝐼𝑃𝑛superscript𝑄2x_{I\!\!P}^{-n(Q^{2})}, where the exponent n𝑛n is determined from fits to the data. More explicitly, in the BEKW approach, the diffractive structure function can be parameterised as

xIPF2D(3)(β,xIP,Q2)=cTFqq¯T+cLFqq¯L+cgFqq¯gT,subscript𝑥𝐼𝑃superscriptsubscript𝐹2𝐷3𝛽subscript𝑥𝐼𝑃superscript𝑄2subscript𝑐𝑇subscriptsuperscript𝐹𝑇𝑞¯𝑞subscript𝑐𝐿subscriptsuperscript𝐹𝐿𝑞¯𝑞subscript𝑐𝑔subscriptsuperscript𝐹𝑇𝑞¯𝑞𝑔x_{I\!\!P}F_{2}^{D(3)}(\beta,x_{I\!\!P},Q^{2})=c_{T}F^{T}_{q\bar{q}}+c_{L}F^{L}_{q\bar{q}}+c_{g}F^{T}_{q\bar{q}g},

where

Fqq¯T=(x0/xIP)nT(Q2)β(1β),subscriptsuperscript𝐹𝑇𝑞¯𝑞superscriptsubscript𝑥0subscript𝑥𝐼𝑃subscript𝑛𝑇superscript𝑄2𝛽1𝛽F^{T}_{q\bar{q}}=(x_{0}/x_{I\!\!P})^{n_{T}(Q^{2})}\cdot\beta(1-\beta),
Fqq¯gT=(x0/xIP)ng(Q2)ln(1+Q2/Q02)(1β)γ.subscriptsuperscript𝐹𝑇𝑞¯𝑞𝑔superscriptsubscript𝑥0subscript𝑥𝐼𝑃subscript𝑛𝑔superscript𝑄21superscript𝑄2superscriptsubscript𝑄02superscript1𝛽𝛾F^{T}_{q\bar{q}g}=(x_{0}/x_{I\!\!P})^{n_{g}(Q^{2})}\cdot\ln{(1+Q^{2}/Q_{0}^{2})}\cdot(1-\beta)^{\gamma}.

The contribution of longitudinal photons, Fqq¯Lsubscriptsuperscript𝐹𝐿𝑞¯𝑞F^{L}_{q\bar{q}}, which is relevant only at high β𝛽\beta, was neglected in this analysis. A higher-twist term for qq¯𝑞¯𝑞q\bar{q} states produced by transverse photons was also neglected. In the original BEKW model [56], the exponents nT,g(Q2)subscript𝑛𝑇𝑔superscript𝑄2n_{T,g}(Q^{2}) are parameterised as nT,g(Q2)=n0T,g+n1T,gln(1+lnQ2/Q02)subscript𝑛𝑇𝑔superscript𝑄2superscriptsubscript𝑛0𝑇𝑔superscriptsubscript𝑛1𝑇𝑔1superscript𝑄2superscriptsubscript𝑄02n_{T,g}(Q^{2})=n_{0}^{T,g}+n_{1}^{T,g}\ln{(1+\ln{Q^{2}/Q_{0}^{2}})}; here, this dependence was modified to nT,g(Q2)=n0T,g+n1T,gln(1+Q2/Q02)subscript𝑛𝑇𝑔superscript𝑄2superscriptsubscript𝑛0𝑇𝑔superscriptsubscript𝑛1𝑇𝑔1superscript𝑄2superscriptsubscript𝑄02n_{T,g}(Q^{2})=n_{0}^{T,g}+n_{1}^{T,g}\ln{(1+Q^{2}/Q_{0}^{2})}, which is well defined also when Q20superscript𝑄20Q^{2}\rightarrow 0.

A fit was performed to the present high-Q2superscript𝑄2Q^{2} data using the parameterisation described above. The fit was limited to the region xIP<0.01subscript𝑥𝐼𝑃0.01x_{I\!\!P}<0.01, well within the diffractive peak. The parameters Q02subscriptsuperscript𝑄20Q^{2}_{0}, x0subscript𝑥0x_{0} and n0T,gsuperscriptsubscript𝑛0𝑇𝑔n_{0}^{T,g} were taken to be 0.4 GeV2, 0.01, and 0.13, respectively 555Since nT,g(Q2)=n0T,g+n1T,gln(1+Q2/Q02)subscript𝑛𝑇𝑔superscript𝑄2superscriptsubscript𝑛0𝑇𝑔superscriptsubscript𝑛1𝑇𝑔1superscript𝑄2superscriptsubscript𝑄02n_{T,g}(Q^{2})=n_{0}^{T,g}+n_{1}^{T,g}\ln{(1+Q^{2}/Q_{0}^{2})}, n0subscript𝑛0n_{0} gives the xIPsubscript𝑥𝐼𝑃x_{I\!\!P} dependence of F2D(3)superscriptsubscript𝐹2𝐷3F_{2}^{D(3)} for Q20superscript𝑄20Q^{2}\rightarrow 0. If F2D(3)1/xIP2α¯IP1proportional-tosuperscriptsubscript𝐹2𝐷31superscriptsubscript𝑥𝐼𝑃2subscript¯𝛼𝐼𝑃1F_{2}^{D(3)}\propto 1/x_{I\!\!P}^{2\bar{\alpha}_{I\!\!P}-1} is assumed and αIP(t)subscript𝛼𝐼𝑃𝑡\alpha_{I\!\!P}(t) is taken to be the soft Pomeron trajectory (αIP(0)=1.096subscript𝛼𝐼𝑃01.096\alpha_{I\!\!P}(0)=1.096, αIP=0.25superscriptsubscript𝛼𝐼𝑃0.25\alpha_{I\!\!P}^{\prime}=0.25 GeV-2), then n0=0.13subscript𝑛00.13n_{0}=0.13.. The coefficients cTsubscript𝑐𝑇c_{T}, cgsubscript𝑐𝑔c_{g}, n1T,gsuperscriptsubscript𝑛1𝑇𝑔n_{1}^{T,g} and γ𝛾\gamma were determined in the fit, and have the following values: cT=0.072±0.006(stat.)c_{T}=0.072\pm 0.006{\rm(stat.)}, cg=0.008±0.001(stat.)c_{g}=0.008\pm 0.001{\rm(stat.)}, n1T,g=0.053±0.014(stat.)n_{1}^{T,g}=0.053\pm 0.014{\rm(stat.)}, γ=12.78±2.08(stat.)\gamma=12.78\pm 2.08{\rm(stat.)}. The main features of the data are broadly reproduced by the fit, as shown in Fig. 7; the description of the Q2superscript𝑄2Q^{2} dependence of the diffractive to the inclusive cross-section ratio is also reasonable, as seen in Fig. 8. This indicates that the framework in which the incoming virtual photon fluctuates into a colour dipole is, in general, adequate to describe diffractive processes in ep𝑒𝑝ep collisions. At the same time, the data suggest the increasing importance of the contribution from qq¯g𝑞¯𝑞𝑔q\bar{q}g states at low Q2superscript𝑄2Q^{2}, as indicated in Fig. 7. The fit gives only a qualitative description of the low-Q2superscript𝑄2Q^{2} sample, which is outside the region of applicability of pQCD; these points were not included in the fit. The fit is also lower than the high-Q2superscript𝑄2Q^{2} data in the high-MXsubscript𝑀𝑋M_{X} bins that have xIP>0.01subscript𝑥𝐼𝑃0.01x_{I\!\!P}>0.01-0.02, suggesting that different mechanisms, such as Reggeon exchange, are at work in the diffractive-peak region and at high xIPsubscript𝑥𝐼𝑃x_{I\!\!P}. In this region the discrepancy between the data and the fit can be taken as an estimate of the contribution to the cross section due to exchanges other than the Pomeron.

10.7.2 Saturation model

In the saturation model by Golec-Biernat and Wüsthoff [63, *gbw2, *gbw3], diffractive DIS is also described in terms of the interaction of the qq¯𝑞¯𝑞q\bar{q} (qq¯g𝑞¯𝑞𝑔q\bar{q}g) fluctuation of the virtual photon with the proton. At high Q2superscript𝑄2Q^{2}, the dipole-proton cross section is obtained from pQCD and is proportional to the square of the transverse size of the dipole, which is in turn proportional to 1/Q21superscript𝑄21/Q^{2}. As Q2superscript𝑄2Q^{2} decreases, the rise of the cross section with the dipole size would violate unitarity and is tamed by requiring that it saturates at a typical value of the hadron-hadron cross section. The value of Q2superscript𝑄2Q^{2} at which saturation occurs is x𝑥x-dependent. The parameters of the model were obtained from a fit to F2subscript𝐹2F_{2} data. The latest modification of the model [59], denoted by BGK in the following, includes the QCD evolution of the gluon distribution.

Figures 1112 and 17 show the comparison of the measured structure function F2D(3)superscriptsubscript𝐹2𝐷3F_{2}^{D(3)} with the BGK prediction [59]. In the region of applicability of the model, xIP< 0.01subscript𝑥𝐼𝑃<0.01x_{I\!\!P}\leavevmode\nobreak\ \raisebox{-2.79857pt}{\hbox to0.0pt{$\sim$\hss}}\raisebox{1.72218pt}{$<$}\leavevmode\nobreak\ 0.01 and Q2superscript𝑄2Q^{2} larger than a few GeV2, the xIPsubscript𝑥𝐼𝑃x_{I\!\!P}, Q2superscript𝑄2Q^{2} and β𝛽\beta dependences of F2D(3)superscriptsubscript𝐹2𝐷3F_{2}^{D(3)} are adequately described, although the data are slightly higher than the model prediction. The extrapolation of the model to large xIPsubscript𝑥𝐼𝑃x_{I\!\!P} values, beyond the Pomeron-dominated region, is significantly lower than the data, and the discrepancy increases with xIPsubscript𝑥𝐼𝑃x_{I\!\!P}; in this region, the β𝛽\beta dependences of the data and the model are also markedly different.

Both the BEKW and the saturation model imply Regge factorisation breaking. The fact that these models describe the data is not in contradiction with the possibility to fit the same data assuming Regge factorisation, as was done in Section 10.6, since the magnitude of the predicted violation is smaller than the precision of the present data.

10.7.3 QCD fit

An NLO QCD fit was performed to the present high-Q2superscript𝑄2Q^{2} data together with the recent ZEUS results on diffractive charm production in DIS [66]. The latter are important to constrain the gluon contribution to the diffractive PDFs. The fit was limited to the data in the region Q2>2superscript𝑄22Q^{2}>2 GeV2 and xIP<0.01subscript𝑥𝐼𝑃0.01x_{I\!\!P}<0.01. Regge factorisation was assumed, F2D(3)(β,Q2,xIP)=fIP(xIP)F2IP(β,Q2)superscriptsubscript𝐹2𝐷3𝛽superscript𝑄2subscript𝑥𝐼𝑃subscript𝑓𝐼𝑃subscript𝑥𝐼𝑃superscriptsubscript𝐹2𝐼𝑃𝛽superscript𝑄2F_{2}^{D(3)}(\beta,Q^{2},x_{I\!\!P})=f_{I\!\!P}(x_{I\!\!P})\cdot F_{2}^{I\!\!P}(\beta,Q^{2}) (see Section 7), and the Pomeron flux was taken to be of the Donnachie-Landshoff form [61]

fIP(xIP,t)=9β024π2xIP2αIP(t)1[F1(t)]2,subscript𝑓𝐼𝑃subscript𝑥𝐼𝑃𝑡9subscriptsuperscript𝛽204superscript𝜋2superscriptsubscript𝑥𝐼𝑃2subscript𝛼𝐼𝑃𝑡1superscriptdelimited-[]subscript𝐹1𝑡2f_{I\!\!P}(x_{I\!\!P},t)=\frac{9\beta^{2}_{0}}{4\pi^{2}x_{I\!\!P}^{2\alpha_{I\!\!P}(t)-1}}[F_{1}(t)]^{2},

where β0=1.8subscript𝛽01.8\beta_{0}=1.8 GeV-1, F1(t)subscript𝐹1𝑡F_{1}(t) is the elastic form factor of the proton, αIP(0)subscript𝛼𝐼𝑃0\alpha_{I\!\!P}(0) was fixed to the result given in Section 10.6 and αIPsuperscriptsubscript𝛼𝐼𝑃\alpha_{I\!\!P}^{\prime} was set to 0.25 GeV-2. The results do not change if Eq. (9) is used.

The diffractive parton distributions (quark flavour singlet and gluon) were parameterised at the starting scale, Q02=2superscriptsubscript𝑄022Q_{0}^{2}=2 GeV2, using the general polynomial form zf(z)=(a1+a2z+a3z2)(1z)a4𝑧𝑓𝑧subscript𝑎1subscript𝑎2𝑧subscript𝑎3superscript𝑧2superscript1𝑧subscript𝑎4zf(z)=(a_{1}+a_{2}z+a_{3}z^{2})\cdot(1-z)^{a_{4}}, where z𝑧z is the parton fractional momentum. For the light quark distribution, it was assumed that u=d=s=u¯=d¯=s¯𝑢𝑑𝑠¯𝑢¯𝑑¯𝑠u=d=s=\bar{u}=\bar{d}=\bar{s}; it was verified that setting the strange quark density to zero at the starting scale produces no appreciable change in the results. Charm quarks were treated in the Thorne-Roberts variable flavour number (TRVFN) scheme [67, *tr1, *tr2, *tr3], with the charm-quark mass, mcsubscript𝑚𝑐m_{c}, set to 1.45 GeV. The NLO evolution package QCDNUM [71] was used to evolve the PDFs from the starting scale to the Q2superscript𝑄2Q^{2} values of each data point. The evolved PDFs were then fitted to the data.

The result of the fit is shown by the lines in Fig. 18. They satisfactorily reproduce the measurements, with χ2/ndf=37.8/36superscript𝜒2𝑛𝑑𝑓37.836\chi^{2}/ndf=37.8/36 (statistical errors only). The resulting fraction of the t𝑡t-channel momentum carried by gluons is (82±8(stat.)16+5(syst.))%(82\pm 8{\rm(stat.)}^{+5}_{-16}{\rm(syst.)})\% at Q2=2superscript𝑄22Q^{2}=2 GeV2, consistent with earlier ZEUS [72] and H1 [15] results, but higher than that found in a recent QCD analysis of the same data by Martin, Ryskin and Watt [73]. The systematic uncertainty includes the contributions listed in Section 9; in addition, the charm quark mass was varied between 1.3 and 1.6 GeV, and the relative normalisation between the charm and the F2D(3)superscriptsubscript𝐹2𝐷3F_{2}^{D(3)} data was changed by %13+11{}^{+11}_{-13}\%, reflecting the uncertainty on the proton-dissociative background and on the luminosity in the charm data, as well as the normalisation uncertainty of the LPS data. The fixed-flavour-number scheme (FFNS) was used instead of TRVFN, without any significant change of the results. Various PDF parameterisations at the starting scale were tried, including the function used by H1 [15]. The shape of the fitted PDFs changes significantly depending on the functional form of the initial parameterisation, a consequence of the relatively large statistical uncertainties of the present sample. Therefore, these data cannot constrain the shapes of the PDFs. However, the integrals over z𝑧z of the fitted PDFs and notably the fraction of the t𝑡t-channel momentum carried by gluons are robust and change only slightly with the parameterisation chosen. This contribution was included in the systematic uncertainties quoted.

Also shown in Fig. 18 is the ratio of the charm contribution to the diffractive structure function, F2D(3),cc¯superscriptsubscript𝐹2𝐷3𝑐¯𝑐F_{2}^{D(3),c\bar{c}} [66], and the present F2D(3)superscriptsubscript𝐹2𝐷3F_{2}^{D(3)} results as a function of β𝛽\beta (see Table 10). The ratio increases with increasing Q2superscript𝑄2Q^{2} and decreasing β𝛽\beta, up to values of 30%percent3030\%. The ratio is well described by the fit.

11 Summary

New measurements have been presented of the reaction e+pe+Xpsuperscript𝑒𝑝superscript𝑒𝑋𝑝e^{+}p\rightarrow e^{+}Xp in the regions 0.03<Q2<0.600.03superscript𝑄20.600.03<Q^{2}<0.60 GeV2 and 2<Q2<1002superscript𝑄21002<Q^{2}<100 GeV2. The scattered proton was measured in the ZEUS leading proton spectrometer, and was required to carry a fraction xLsubscript𝑥𝐿x_{L} of the incoming proton momentum of at least 90%percent9090\%. The data cover the region 0.075<|t|<0.350.075𝑡0.350.075<|t|<0.35 GeV2.

The results can be summarised as follows:

  • the t𝑡t dependence of the cross section is exponential, with a t𝑡t-slope b=7.9±0.5(stat.)0.5+0.8(syst.)b=7.9\pm 0.5{\rm(stat.)}^{+0.8}_{-0.5}{\rm(syst.)} GeV-2 for xIP<0.01subscript𝑥𝐼𝑃0.01x_{I\!\!P}<0.01. The slope is independent of Q2superscript𝑄2Q^{2} but decreases with xIPsubscript𝑥𝐼𝑃x_{I\!\!P};

  • there is no observed ΦΦ\Phi dependence of the cross section, indicating that the interference terms between the longitudinal and transverse amplitudes and between the two transverse amplitudes are consistent with zero in the measured kinematic region;

  • the cross-section dσγpXp/dMX𝑑superscript𝜎superscript𝛾𝑝𝑋𝑝𝑑subscript𝑀𝑋d\sigma^{\gamma^{*}p\rightarrow Xp}/dM_{X} falls rapidly with Q2superscript𝑄2Q^{2} at high Q2superscript𝑄2Q^{2} but approaches a constant as Q20superscript𝑄20Q^{2}\rightarrow 0. This behaviour is similar to that of the total photon-proton cross section, and is a consequence of the conservation of the electromagnetic current. In detail, it was found that the cross-section dσγpXp/dMX𝑑superscript𝜎superscript𝛾𝑝𝑋𝑝𝑑subscript𝑀𝑋d\sigma^{\gamma^{*}p\rightarrow Xp}/dM_{X} falls with Q2superscript𝑄2Q^{2} more slowly than σtotγpsuperscriptsubscript𝜎totsuperscript𝛾𝑝\sigma_{{\rm tot}}^{\gamma^{\star}p} when Q2<MX2superscript𝑄2superscriptsubscript𝑀𝑋2Q^{2}<M_{X}^{2} and faster than σtotγpsuperscriptsubscript𝜎totsuperscript𝛾𝑝\sigma_{{\rm tot}}^{\gamma^{\star}p} when Q2>MX2superscript𝑄2superscriptsubscript𝑀𝑋2Q^{2}>M_{X}^{2};

  • the data were also analysed in terms of the structure function F2D(3)superscriptsubscript𝐹2𝐷3F_{2}^{D(3)}. The xIPsubscript𝑥𝐼𝑃x_{I\!\!P}, Q2superscript𝑄2Q^{2} and β𝛽\beta dependences of F2D(3)superscriptsubscript𝐹2𝐷3F_{2}^{D(3)} were studied;

    • F2D(3)superscriptsubscript𝐹2𝐷3F_{2}^{D(3)} falls with xIPsubscript𝑥𝐼𝑃x_{I\!\!P} faster than 1/xIP1subscript𝑥𝐼𝑃1/x_{I\!\!P} for xIP< 0.01subscript𝑥𝐼𝑃<0.01x_{I\!\!P}\leavevmode\nobreak\ \raisebox{-2.79857pt}{\hbox to0.0pt{$\sim$\hss}}\raisebox{1.72218pt}{$<$}\leavevmode\nobreak\ 0.01 and more slowly at larger values of xIPsubscript𝑥𝐼𝑃x_{I\!\!P}. From the xIPsubscript𝑥𝐼𝑃x_{I\!\!P} dependence of F2D(3)superscriptsubscript𝐹2𝐷3F_{2}^{D(3)} at low xIPsubscript𝑥𝐼𝑃x_{I\!\!P}, the Pomeron intercept αIP(0)subscript𝛼𝐼𝑃0\alpha_{I\!\!P}(0) was measured to be αIP(0)=1.16±0.02(stat.)±0.02(syst.)\alpha_{I\!\!P}(0)=1.16\pm 0.02\leavevmode\nobreak\ (\rm stat.)\pm 0.02(\rm syst.), higher than that of the soft Pomeron, and similar to that measured in the photoproduction of heavy vector mesons. This suggests that, also in the present reaction, the virtual photon probes the proton in a region where the parton density increases quickly with decreasing x𝑥x.

    • F2D(3)superscriptsubscript𝐹2𝐷3F_{2}^{D(3)} rises with Q2superscript𝑄2Q^{2} over the whole measured region. The increase is very significant, about a factor five, between the low-Q2superscript𝑄2Q^{2} and the high-Q2superscript𝑄2Q^{2} region. In the high-Q2superscript𝑄2Q^{2} region, the rise becomes softer, and is reminiscent of the logarithmic scaling violations of the proton structure function. Positive scaling violations reflect a large gluon density. This is confirmed by an NLO QCD analysis of the present data for xIP<0.01subscript𝑥𝐼𝑃0.01x_{I\!\!P}<0.01 in conjunction with the earlier ZEUS results on diffractive charm production [66]. The analysis indicates that the fraction of the t𝑡t-channel momentum carried by gluons is (82±8(stat.)16+5(syst.))%(82\pm 8{\rm(stat.)}^{+5}_{-16}{\rm(syst.)})\% at Q2=2superscript𝑄22Q^{2}=2 GeV2. However, the present data are not precise enough to constrain the shapes of the PDFs.

    • The β𝛽\beta dependence of F2D(3)superscriptsubscript𝐹2𝐷3F_{2}^{D(3)} changes with xIPsubscript𝑥𝐼𝑃x_{I\!\!P}. For xIP< 0.01subscript𝑥𝐼𝑃<0.01x_{I\!\!P}\leavevmode\nobreak\ \raisebox{-2.79857pt}{\hbox to0.0pt{$\sim$\hss}}\raisebox{1.72218pt}{$<$}\leavevmode\nobreak\ 0.01, F2D(3)superscriptsubscript𝐹2𝐷3F_{2}^{D(3)} grows with β𝛽\beta. For values of xIP> 0.01subscript𝑥𝐼𝑃>0.01x_{I\!\!P}\leavevmode\nobreak\ \raisebox{-2.79857pt}{\hbox to0.0pt{$\sim$\hss}}\raisebox{1.72218pt}{$>$}\leavevmode\nobreak\ 0.01-0.02, F2D(3)superscriptsubscript𝐹2𝐷3F_{2}^{D(3)} decreases with β𝛽\beta. The latter behaviour is similar to that of the structure functions of hadrons as a function of x𝑥x, and is consistent with the hypothesis that, at large xIPsubscript𝑥𝐼𝑃x_{I\!\!P}, the t𝑡t-channel exchange mediating the photon-proton interaction is a meson-like object;

  • the results presented are consistent, in the small xIPsubscript𝑥𝐼𝑃x_{I\!\!P} region, with the predictions of pQCD-based models of diffraction. In particular, the data were compared with models in which the virtual photon fluctuates into qq¯𝑞¯𝑞q\bar{q} or qq¯g𝑞¯𝑞𝑔q\bar{q}g colour dipoles which then interact with the proton via the exchange of a gluon pair.

Acknowledgements

We thank the DESY Directorate for their support and encouragement. We are grateful for the support of the DESY computing and network services. We are specially grateful to the HERA machine group: collaboration with them was crucial to the successful installation and operation of the leading proton spectrometer. The design, construction and installation of the ZEUS detector have been made possible by the ingenuity and effort of many people who are not listed as authors. It is also a pleasure to thank M. Diehl, K. Golec-Biernat, O. Nachtmann, N.N. Nikolaev, M.G. Ryskin and G. Watt for many useful discussions. We are grateful to K. Golec-Biernat for providing the prediction of his model for the kinematic range covered by our data.

{mcbibliography}

10

References

  • [1] P.D.B. Collins, An Introduction to Regge Theory and High Energy Physics, Cambridge University Press, Cambridge, 1977
  • [2] H. Abramowicz, Int. J. Mod. Phys. A 15 S1b, 495 (2000)
  • [3] V. Barone and E. Predazzi, High-Energy Particle Diffraction, Springer Verlag, Heidelberg, 2002, and references therein
  • [4] L. Trentadue and G. Veneziano, Phys. Lett. B 323, 201 (1994)
  • [5] J.C. Collins, Phys. Rev. D 57, 3051 (1998)
  • [6] Erratum, ibid. D 61, 019902 (2000)
  • [7] A. Berera and D.E. Soper, Phys. Rev. D 53, 6162 (1996)
  • [8] ZEUS Coll., S. Chekanov et al., Eur. Phys. J. C 25, 169 (2002)
  • [9] ZEUS Coll., S. Chekanov et al., Nucl. Phys. B 658, 3 (2003)
  • [10] ZEUS Coll., J. Breitweg et al., Eur. Phys. J. C 6, 43 (1999)
  • [11] See e.g.: M. McDermott and G. Briskin, Proc. Workshop on Future Physics at HERA, G. Ingelman, A. De Roeck and R. Klanner (eds.), Vol. 2, p. 691. DESY, Hamburg, Germany (1996)
  • [12] ZEUS Coll., J. Breitweg et al., Eur. Phys. J. C 1, 81 (1998)
  • [13] ZEUS Coll., J. Breitweg et al., Eur. Phys. J. C 2, 237 (1998)
  • [14] H1 Coll., C. Adloff et al., Nucl. Phys. B 619, 3 (2001)
  • [15] H1 Coll., C. Adloff et al., Z. Phys. C 76, 613 (1997)
  • [16] ZEUS Coll., U. Holm (ed.), The ZEUS Detector, Status Report (unpublished), DESY (1993), available on http://www-zeus.desy.de/bluebook/bluebook.html
  • [17] N. Harnew et al., Nucl. Inst. Meth. A 279, 290 (1989)
  • [18] B. Foster et al., Nucl. Phys. Proc. Suppl. B 32, 181 (1993)
  • [19] B. Foster et al., Nucl. Inst. Meth. A 338, 254 (1994)
  • [20] M. Derrick et al., Nucl. Inst. Meth. A 309, 77 (1991)
  • [21] A. Andresen et al., Nucl. Inst. Meth. A 309, 101 (1991)
  • [22] A. Caldwell et al., Nucl. Inst. Meth. A 321, 356 (1992)
  • [23] A. Bernstein et al., Nucl. Inst. Meth. A 336, 23 (1993)
  • [24] ZEUS Coll., J. Breitweg et al., Phys. Lett. B 407, 432 (1997)
  • [25] ZEUS Coll., M. Derrick et al., Phys. Lett. B 487, 53 (2000)
  • [26] A. Bamberger et al., Nucl. Inst. Meth. A 382, 419 (1996)
  • [27] A. Dwuraźny et al., Nucl. Inst. Meth. A 277, 176 (1989)
  • [28] ZEUS Coll., M. Derrick et al., Z. Phys. C 73, 253 (1997)
  • [29] J. Andruszków et al., Technical Report DESY-92-066, DESY, 1992
  • [30] ZEUS Coll., M. Derrick et al., Z. Phys. C 63, 391 (1994)
  • [31] J. Andruszków et al., Acta Phys. Pol. B 32, 2025 (2001)
  • [32] H. Abramowicz, A. Caldwell and R. Sinkus, Nucl. Inst. Meth. A 365, 508 (1995)
  • [33] S. Bentvelsen, J. Engelen and P. Kooijman, Proc. Workshop on Physics at HERA, W. Buchmüller and G. Ingelman (eds.), Vol. 1, p. 23. DESY, Hamburg, Germany (1992)
  • [34] G. Briskin, Ph.D. Thesis, Tel Aviv University, DESY-THESIS-1998-036 (1988)
  • [35] F. Jacquet and A. Blondel, Proc. Study of an ep𝑒𝑝ep Facility for Europe, U. Amaldi (ed.), p. 391. DESY, Hamburg, Germany (1979)
  • [36] ZEUS Coll., S. Chekanov et al., Eur. Phys. J. C 21, 443 (2001)
  • [37] M. Kasprzak, Ph.D. Thesis, University of Warsaw, DESY F35D-96-16 (1996)
  • [38] M. Inuzuka, Ph.D. Thesis, University of Tokyo, KEK Report 99-9 (1999)
  • [39] H. Jung, Comput. Phys. Commun. 86, 147 (1995)
  • [40] G. Ingelmann and P.E. Schlein, Phys. Lett. B 152, 256 (1985)
  • [41] J.F. Owens, Phys. Rev. D 30, 943 (1984)
  • [42] B. List and A. Mastroberardino, Proc. Workshop on Monte Carlo Generators for HERA Physics, A.T. Doyle, G. Grindhammer, G. Ingelman and H. Jung (eds.), p. 396. DESY, Hamburg, Germany (1999). Also in preprint DESY-PROC-1999-02, available on http://www.desy.de/~heramc/
  • [43] K. Kwiatkowski, H. Spiesberger and H.-J. Möhring, Comput. Phys. Commun. 69, 155 (1992)
  • [44] R. Brun et al., geant3, Technical Report CERN-DD/EE/84-1, CERN, 1987
  • [45] UA4 Coll., D. Bernard et al., Phys. Lett. B 186, 227 (1987)
  • [46] M. Ruspa, Tesi di Dottorato, University of Torino, unpublished (2000)
  • [47] B. Smalska, Ph.D. Thesis, University of Warsaw, unpublished (2001)
  • [48] A. Mastroberardino, Tesi di Dottorato, University of Calabria, unpublished (2001)
  • [49] N.N. Nikolaev, A.V. Pronyaev and B.G. Zakharov, JETP Lett. 68, 634 (1998)
  • [50] A. Szczurek, N.N. Nikolaev and J. Speth, Phys. Lett. B 428, 383 (1998)
  • [51] ZEUS Coll., J. Breitweg et al., Eur. Phys. J. C 12, 393 (2000)
  • [52] T. Gehrmann and W.J. Stirling, Z. Phys. C 70, 89 (1996)
  • [53] T. Arens et al., Z. Phys. C 74, 651 (1997)
  • [54] M. Diehl, Z. Phys. C 76, 499 (1997)
  • [55] N.N. Nikolaev, A.V. Pronyaev and B.G. Zakharov, Phys. Rev. D 59, 091501 (1999)
  • [56] J. Bartels et al., Eur. Phys. J. C 7, 443 (1999)
  • [57] H. Abramowicz and A. Levy, Preprint DESY-97-251 (hep-ph/9712415), DESY, 1997
  • [58] A. Levy, private communication (2004)
  • [59] J. Bartels, K. Golec-Biernat and H. Kowalski, Phys. Rev. D 66, 014001 (2002)
  • [60] J.-R. Cudell, K. Kang and S.K. Kim, Phys. Lett. B 395, 311 (1997)
  • [61] A. Donnachie and P.V. Landshoff, Nucl. Phys. B 303, 634 (1988)
  • [62] ZEUS Coll., S. Chekanov et al., Eur. Phys. J. C 24, 345 (2002)
  • [63] K. Golec-Biernat and M. Wüsthoff, Phys. Rev. D 59, 014017 (1999)
  • [64] K. Golec-Biernat and M. Wüsthoff, Phys. Rev. D 60, 114023 (1999)
  • [65] K. Golec-Biernat and M. Wüsthoff, Eur. Phys. J. C 20, 313 (2001)
  • [66] ZEUS Coll., S. Chekanov et al., Nucl. Phys. B 672, 3 (2003)
  • [67] R.S. Thorne, J. Phys. G 25, 1307 (1999)
  • [68] R.S. Thorne and R.G. Roberts, Phys. Lett. B 421, 303 (1998)
  • [69] R.S. Thorne and R.G. Roberts, Phys. Rev. D 57, 6871 (1998)
  • [70] R.S. Thorne and R.G. Roberts, Eur. Phys. J. C 19, 339 (2001)
  • [71] M.A.J. Botje, Computer code QCDNUM version 16.12, National Institute for Nuclear and High Energy Physics, Amsterdam, The Netherlands, 1998 (unpublished)
  • [72] ZEUS Coll., S. Breitweg et al., Eur. Phys. J. C 5, 41 (1998)
  • [73] A.D. Martin, M.G. Ryskin and G. Watt, Preprint IPPP/04/09 and DCPT/04/18 (hep-ph/0406224), University of Durham, 2004
Q2delimited-⟨⟩superscript𝑄2\langle Q^{2}\rangle (GeV2) βdelimited-⟨⟩𝛽\langle\beta\rangle xIPdelimited-⟨⟩subscript𝑥𝐼𝑃\langle x_{I\!\!P}\rangle b𝑏b (GeV-2)
7.17.17.1 0.370.370.37 0.0010.0010.001 8.13±0.680.53+0.95plus-or-minus8.13subscriptsuperscript0.680.950.538.13\pm 0.68^{+0.95}_{-0.53}
10.210.210.2 0.240.240.24 0.0060.0060.006 7.87±0.830.66+1.21plus-or-minus7.87subscriptsuperscript0.831.210.667.87\pm 0.83^{+1.21}_{-0.66}
11.511.511.5 0.140.140.14 0.0190.0190.019 6.14±0.820.68+1.73plus-or-minus6.14subscriptsuperscript0.821.730.686.14\pm 0.82^{+1.73}_{-0.68}
11.711.711.7 0.070.070.07 0.040.040.04 4.19±0.620.75+0.83plus-or-minus4.19subscriptsuperscript0.620.830.754.19\pm 0.62^{+0.83}_{-0.75}
12.212.212.2 0.050.050.05 0.060.060.06 4.19±0.400.30+0.42plus-or-minus4.19subscriptsuperscript0.400.420.304.19\pm 0.40^{+0.42}_{-0.30}
Table 1: Fitted values of the t𝑡t-slopes. The first uncertainty is statistical, the second systematic.
Q2delimited-⟨⟩superscript𝑄2\langle Q^{2}\rangle (GeV2) βdelimited-⟨⟩𝛽\langle\beta\rangle xIPdelimited-⟨⟩subscript𝑥𝐼𝑃\langle x_{I\!\!P}\rangle |t|delimited-⟨⟩𝑡\langle|t|\rangle (GeV2) ALTsubscript𝐴𝐿𝑇A_{LT}
13.013.013.0 0.480.480.48 0.00090.00090.0009 0.1450.1450.145 0.06±0.130.08+0.12plus-or-minus0.06subscriptsuperscript0.130.120.08-0.06\pm 0.13^{+0.12}_{-0.08}
17.717.717.7 0.340.340.34 0.00290.00290.0029 0.1450.1450.145 0.06±0.160.17+0.04plus-or-minus0.06subscriptsuperscript0.160.040.17\phantom{+}0.06\pm 0.16^{+0.04}_{-0.17}
20.320.320.3 0.270.270.27 0.00680.00680.0068 0.1450.1450.145 0.02±0.150.04+0.09plus-or-minus0.02subscriptsuperscript0.150.090.04-0.02\pm 0.15^{+0.09}_{-0.04}
21.121.121.1 0.180.180.18 0.01900.01900.0190 0.1470.1470.147 0.02±0.110.04+0.09plus-or-minus0.02subscriptsuperscript0.110.090.04\phantom{+}0.02\pm 0.11^{+0.09}_{-0.04}
22.522.522.5 0.110.110.11 0.0410.0410.041 0.1510.1510.151 0.15±0.130.22+0.05plus-or-minus0.15subscriptsuperscript0.130.050.22-0.15\pm 0.13^{+0.05}_{-0.22}
23.023.023.0 0.080.080.08 0.0610.0610.061 0.1610.1610.161 0.10±0.080.04+0.10plus-or-minus0.10subscriptsuperscript0.080.100.04\phantom{+}0.10\pm 0.08^{+0.10}_{-0.04}
9.69.69.6 0.040.040.04 0.00640.00640.0064 0.1450.1450.145 0.05±0.290.16+0.15plus-or-minus0.05subscriptsuperscript0.290.150.16-0.05\pm 0.29^{+0.15}_{-0.16}
14.414.414.4 0.130.130.13 0.00420.00420.0042 0.1450.1450.145 0.19±0.190.23+0.15plus-or-minus0.19subscriptsuperscript0.190.150.23-0.19\pm 0.19^{+0.15}_{-0.23}
17.717.717.7 0.380.380.38 0.00300.00300.0030 0.1450.1450.145 0.03±0.120.05+0.08plus-or-minus0.03subscriptsuperscript0.120.080.05\phantom{+}0.03\pm 0.12^{+0.08}_{-0.05}
20.120.120.1 0.730.730.73 0.00240.00240.0024 0.1450.1450.145 0.14±0.190.08+0.18plus-or-minus0.14subscriptsuperscript0.190.180.08\phantom{+}0.14\pm 0.19^{+0.18}_{-0.08}
17.017.017.0 0.370.370.37 0.00350.00350.0035 0.0850.0850.085 0.03±0.160.09+0.07plus-or-minus0.03subscriptsuperscript0.160.070.09\phantom{+}0.03\pm 0.16^{+0.07}_{-0.09}
17.017.017.0 0.370.370.37 0.00350.00350.0035 0.110.110.11 0.00±0.170.09+0.11plus-or-minus0.00subscriptsuperscript0.170.110.09\phantom{+}0.00\pm 0.17^{+0.11}_{-0.09}
17.017.017.0 0.370.370.37 0.00350.00350.0035 0.150.150.15 0.02±0.180.07+0.09plus-or-minus0.02subscriptsuperscript0.180.090.07\phantom{+}0.02\pm 0.18^{+0.09}_{-0.07}
17.017.017.0 0.370.370.37 0.00350.00350.0035 0.240.240.24 0.14±0.170.05+0.15plus-or-minus0.14subscriptsuperscript0.170.150.05-0.14\pm 0.17^{+0.15}_{-0.05}
7.87.87.8 0.280.280.28 0.00250.00250.0025 0.1450.1450.145 0.01±0.160.13+0.08plus-or-minus0.01subscriptsuperscript0.160.080.13\phantom{+}0.01\pm 0.16^{+0.08}_{-0.13}
11.811.811.8 0.370.370.37 0.00330.00330.0033 0.1450.1450.145 0.13±0.150.08+0.07plus-or-minus0.13subscriptsuperscript0.150.070.08-0.13\pm 0.15^{+0.07}_{-0.08}
16.916.916.9 0.420.420.42 0.00390.00390.0039 0.1450.1450.145 0.01±0.180.02+0.16plus-or-minus0.01subscriptsuperscript0.180.160.02\phantom{+}0.01\pm 0.18^{+0.16}_{-0.02}
36.036.036.0 0.440.440.44 0.00460.00460.0046 0.1450.1450.145 0.10±0.190.11+0.07plus-or-minus0.10subscriptsuperscript0.190.070.11\phantom{+}0.10\pm 0.19^{+0.07}_{-0.11}
Table 2: Fitted values of the asymmetry parameter ALTsubscript𝐴𝐿𝑇A_{LT}. The first uncertainty is statistical, the second systematic.
Q2delimited-⟨⟩superscript𝑄2\langle Q^{2}\rangle (GeV2) MXdelimited-⟨⟩subscript𝑀𝑋\langle M_{X}\rangle (GeV) Wdelimited-⟨⟩𝑊\langle W\rangle (GeV) dσγpXp/dMX𝑑superscript𝜎superscript𝛾𝑝𝑋𝑝𝑑subscript𝑀𝑋d\sigma^{\gamma^{*}p\rightarrow Xp}/dM_{X} (μ𝜇\mub/GeV)
0.330.330.33 555 100100100 0.4690.469\leavevmode\nobreak\ \leavevmode\nobreak\ \leavevmode\nobreak\ \leavevmode\nobreak\ \leavevmode\nobreak\ \leavevmode\nobreak\ \leavevmode\nobreak\ 0.469±plus-or-minus\pm 0.0950.0950.0950.031+0.037subscriptsuperscriptabsent0.0370.031{}^{+0.037}_{-0.031}
0.290.290.29 555 160160160 0.3550.3550.355±plus-or-minus\pm 0.0750.0750.0750.021+0.035subscriptsuperscriptabsent0.0350.021{}^{+0.035}_{-0.021}
0.240.240.24 555 190190190 0.600.600.60\phantom{0}±plus-or-minus\pm 0.140.140.14\phantom{0}0.04+0.07subscriptsuperscriptabsent0.070.04{}^{+0.07\phantom{0}}_{-0.04\phantom{0}}
0.140.140.14 555 245245245 0.610.610.61\phantom{0}±plus-or-minus\pm 0.220.220.22\phantom{0}0.04+0.05subscriptsuperscriptabsent0.050.04{}^{+0.05\phantom{0}}_{-0.04\phantom{0}}
0.340.340.34 222222 100100100 0.1130.1130.113±plus-or-minus\pm 0.0200.0200.0200.010+0.009subscriptsuperscriptabsent0.0090.010{}^{+0.009}_{-0.010}
0.340.340.34 222222 160160160 0.1150.1150.115±plus-or-minus\pm 0.0290.0290.0290.007+0.011subscriptsuperscriptabsent0.0110.007{}^{+0.011}_{-0.007}
0.270.270.27 222222 190190190 0.0950.0950.095±plus-or-minus\pm 0.0410.0410.0410.004+0.009subscriptsuperscriptabsent0.0090.004{}^{+0.009}_{-0.004}
0.330.330.33 404040 160160160 0.0460.0460.046±plus-or-minus\pm 0.0100.0100.0100.004+0.003subscriptsuperscriptabsent0.0030.004{}^{+0.003}_{-0.004}
0.240.240.24 404040 190190190 0.0550.0550.055±plus-or-minus\pm 0.0120.0120.0120.005+0.004subscriptsuperscriptabsent0.0040.005{}^{+0.004}_{-0.005}
0.130.130.13 404040 245245245 0.0810.0810.081±plus-or-minus\pm 0.0210.0210.0210.005+0.006subscriptsuperscriptabsent0.0060.005{}^{+0.006}_{-0.005}
0.090.090.09 404040 275275275 0.2180.2180.218±plus-or-minus\pm 0.0590.0590.0590.030+0.025subscriptsuperscriptabsent0.0250.030{}^{+0.025}_{-0.030}
Table 3: The diffractive cross section, dσγpXp/dMX𝑑superscript𝜎superscript𝛾𝑝𝑋𝑝𝑑subscript𝑀𝑋d\sigma^{\gamma^{*}p\rightarrow Xp}/dM_{X}, for the low-Q2superscript𝑄2Q^{2} sample. The first uncertainty given is statistical, the second systematic.
Q2superscript𝑄2Q^{2} (GeV2) MXsubscript𝑀𝑋M_{X} (GeV) W𝑊W (GeV) dσγpXp/dMX𝑑superscript𝜎superscript𝛾𝑝𝑋𝑝𝑑subscript𝑀𝑋d\sigma^{\gamma^{\star}p\to Xp}/dM_{X} (μ𝜇\mub/GeV)
2.72.72.7 555 100100100 0.179±0.0220.006+0.030plus-or-minus0.179subscriptsuperscript0.0220.0300.0060.179\pm 0.022^{+0.030}_{-0.006}
4.54.54.5 555 100100100 0.119±0.0130.008+0.013plus-or-minus0.119subscriptsuperscript0.0130.0130.0080.119\pm 0.013^{+0.013}_{-0.008}
10.010.010.0 555 100100100 0.074±0.0060.005+0.009plus-or-minus0.074subscriptsuperscript0.0060.0090.0050.074\pm 0.006^{+0.009}_{-0.005}
35.035.035.0 555 100100100 0.015±0.0020.001+0.002plus-or-minus0.015subscriptsuperscript0.0020.0020.0010.015\pm 0.002^{+0.002}_{-0.001}
2.72.72.7 222222 100100100 0.082±0.0060.004+0.010plus-or-minus0.082subscriptsuperscript0.0060.0100.0040.082\pm 0.006^{+0.010}_{-0.004}
4.54.54.5 222222 100100100 0.052±0.0040.004+0.007plus-or-minus0.052subscriptsuperscript0.0040.0070.0040.052\pm 0.004^{+0.007}_{-0.004}
10.010.010.0 222222 100100100 0.025±0.0010.001+0.003plus-or-minus0.025subscriptsuperscript0.0010.0030.0010.025\pm 0.001^{+0.003}_{-0.001}
35.035.035.0 222222 100100100 0.009±0.0010.001+0.001plus-or-minus0.009subscriptsuperscript0.0010.0010.0010.009\pm 0.001^{+0.001}_{-0.001}
2.72.72.7 555 160160160 0.230±0.0270.019+0.021plus-or-minus0.230subscriptsuperscript0.0270.0210.0190.230\pm 0.027^{+0.021}_{-0.019}
4.54.54.5 555 160160160 0.178±0.0280.011+0.011plus-or-minus0.178subscriptsuperscript0.0280.0110.0110.178\pm 0.028^{+0.011}_{-0.011}
10.010.010.0 555 160160160 0.082±0.0080.005+0.007plus-or-minus0.082subscriptsuperscript0.0080.0070.0050.082\pm 0.008^{+0.007}_{-0.005}
35.035.035.0 555 160160160 0.015±0.0020.001+0.002plus-or-minus0.015subscriptsuperscript0.0020.0020.0010.015\pm 0.002^{+0.002}_{-0.001}
2.72.72.7 222222 160160160 0.048±0.0060.002+0.007plus-or-minus0.048subscriptsuperscript0.0060.0070.0020.048\pm 0.006^{+0.007}_{-0.002}
4.54.54.5 222222 160160160 0.033±0.0050.004+0.003plus-or-minus0.033subscriptsuperscript0.0050.0030.0040.033\pm 0.005^{+0.003}_{-0.004}
10.010.010.0 222222 160160160 0.016±0.0020.001+0.002plus-or-minus0.016subscriptsuperscript0.0020.0020.0010.016\pm 0.002^{+0.002}_{-0.001}
35.035.035.0 222222 160160160 0.007±0.0010.001+0.001plus-or-minus0.007subscriptsuperscript0.0010.0010.0010.007\pm 0.001^{+0.001}_{-0.001}
2.72.72.7 404040 160160160 0.051±0.0070.007+0.010plus-or-minus0.051subscriptsuperscript0.0070.0100.0070.051\pm 0.007^{+0.010}_{-0.007}
4.54.54.5 404040 160160160 0.037±0.0040.002+0.005plus-or-minus0.037subscriptsuperscript0.0040.0050.0020.037\pm 0.004^{+0.005}_{-0.002}
10.010.010.0 404040 160160160 0.020±0.0020.001+0.003plus-or-minus0.020subscriptsuperscript0.0020.0030.0010.020\pm 0.002^{+0.003}_{-0.001}
35.035.035.0 404040 160160160 0.006±0.0010.000+0.001plus-or-minus0.006subscriptsuperscript0.0010.0010.0000.006\pm 0.001^{+0.001}_{-0.000}
2.72.72.7 555 190190190 0.240±0.0350.026+0.021plus-or-minus0.240subscriptsuperscript0.0350.0210.0260.240\pm 0.035^{+0.021}_{-0.026}
4.54.54.5 555 190190190 0.163±0.0240.012+0.016plus-or-minus0.163subscriptsuperscript0.0240.0160.0120.163\pm 0.024^{+0.016}_{-0.012}
10.010.010.0 555 190190190 0.098±0.0120.016+0.009plus-or-minus0.098subscriptsuperscript0.0120.0090.0160.098\pm 0.012^{+0.009}_{-0.016}
35.035.035.0 555 190190190 0.021±0.0040.003+0.002plus-or-minus0.021subscriptsuperscript0.0040.0020.0030.021\pm 0.004^{+0.002}_{-0.003}
2.72.72.7 222222 190190190 0.064±0.0120.008+0.007plus-or-minus0.064subscriptsuperscript0.0120.0070.0080.064\pm 0.012^{+0.007}_{-0.008}
4.54.54.5 222222 190190190 0.041±0.0090.004+0.005plus-or-minus0.041subscriptsuperscript0.0090.0050.0040.041\pm 0.009^{+0.005}_{-0.004}
10.010.010.0 222222 190190190 0.019±0.0030.002+0.002plus-or-minus0.019subscriptsuperscript0.0030.0020.0020.019\pm 0.003^{+0.002}_{-0.002}
35.035.035.0 222222 190190190 0.009±0.0020.001+0.001plus-or-minus0.009subscriptsuperscript0.0020.0010.0010.009\pm 0.002^{+0.001}_{-0.001}
2.72.72.7 404040 190190190 0.046±0.0060.004+0.005plus-or-minus0.046subscriptsuperscript0.0060.0050.0040.046\pm 0.006^{+0.005}_{-0.004}
4.54.54.5 404040 190190190 0.040±0.0050.004+0.004plus-or-minus0.040subscriptsuperscript0.0050.0040.0040.040\pm 0.005^{+0.004}_{-0.004}
10.010.010.0 404040 190190190 0.019±0.0020.001+0.003plus-or-minus0.019subscriptsuperscript0.0020.0030.0010.019\pm 0.002^{+0.003}_{-0.001}
35.035.035.0 404040 190190190 0.007±0.0010.001+0.001plus-or-minus0.007subscriptsuperscript0.0010.0010.0010.007\pm 0.001^{+0.001}_{-0.001}
Table 4: The diffractive cross section, dσγpXp/dMX𝑑superscript𝜎superscript𝛾𝑝𝑋𝑝𝑑subscript𝑀𝑋d\sigma^{\gamma^{*}p\rightarrow Xp}/dM_{X}, for the high-Q2superscript𝑄2Q^{2} sample. The first uncertainty given is statistical, the second systematic.
Q2delimited-⟨⟩superscript𝑄2\langle Q^{2}\rangle (GeV2) βdelimited-⟨⟩𝛽\langle\beta\rangle xIPdelimited-⟨⟩subscript𝑥𝐼𝑃\langle x_{I\!\!P}\rangle xIPF2D(3)subscript𝑥𝐼𝑃superscriptsubscript𝐹2𝐷3x_{I\!\!P}F_{2}^{D(3)}
0.100.100.10 0.00020.00020.0002 0.0230.0230.023 0.001220.001220.00122±plus-or-minus\pm 0.000450.000450.000450.00007+0.00015subscriptsuperscriptabsent0.000150.00007{}^{+0.00015}_{-0.00007}
0.140.140.14 0.00020.00020.0002 0.0660.0660.066 0.003070.003070.00307±plus-or-minus\pm 0.000440.000440.000440.00037+0.00022subscriptsuperscriptabsent0.000220.00037{}^{+0.00022}_{-0.00037}
0.120.120.12 0.00060.00060.0006 0.0110.0110.011 0.001560.001560.00156±plus-or-minus\pm 0.000620.000620.000620.00011+0.00016subscriptsuperscriptabsent0.000160.00011{}^{+0.00016}_{-0.00011}
0.150.150.15 0.00060.00060.0006 0.0500.0500.050 0.003760.003760.00376±plus-or-minus\pm 0.000550.000550.000550.00036+0.00028subscriptsuperscriptabsent0.000280.00036{}^{+0.00028}_{-0.00036}
0.120.120.12 0.00190.00190.0019 0.00330.00330.0033 0.00240.00240.0024\phantom{0}±plus-or-minus\pm 0.00100.00100.0010\phantom{0}0.0001+0.0003subscriptsuperscriptabsent0.00030.0001{}^{+0.0003\phantom{0}}_{-0.0001\phantom{0}}
0.150.150.15 0.00190.00190.0019 0.00770.00770.0077 0.002390.002390.00239±plus-or-minus\pm 0.000920.000920.000920.00011+0.00027subscriptsuperscriptabsent0.000270.00011{}^{+0.00027}_{-0.00011}
0.160.160.16 0.00190.00190.0019 0.0220.0220.022 0.00340.00340.0034\phantom{0}±plus-or-minus\pm 0.00140.00140.0014\phantom{0}0.0005+0.0004subscriptsuperscriptabsent0.00040.0005{}^{+0.0004\phantom{0}}_{-0.0005\phantom{0}}
0.120.120.12 0.0080.0080.008 0.00100.00100.0010 0.002460.002460.00246±plus-or-minus\pm 0.000790.000790.000790.00034+0.00026subscriptsuperscriptabsent0.000260.00034{}^{+0.00026}_{-0.00034}
0.150.150.15 0.0070.0070.007 0.00270.00270.0027 0.001770.001770.00177±plus-or-minus\pm 0.000750.000750.000750.00020+0.00017subscriptsuperscriptabsent0.000170.00020{}^{+0.00017}_{-0.00020}
0.160.160.16 0.0070.0070.007 0.00570.00570.0057 0.00310.00310.0031\phantom{0}±plus-or-minus\pm 0.00140.00140.0014\phantom{0}0.0002+0.0003subscriptsuperscriptabsent0.00030.0002{}^{+0.0003\phantom{0}}_{-0.0002\phantom{0}}
0.190.190.19 0.0060.0060.006 0.0180.0180.018 0.00360.00360.0036\phantom{0}±plus-or-minus\pm 0.00190.00190.0019\phantom{0}0.0003+0.0004subscriptsuperscriptabsent0.00040.0003{}^{+0.0004\phantom{0}}_{-0.0003\phantom{0}}
0.170.170.17 0.030.030.03 0.000210.000210.00021 0.00360.00360.0036\phantom{0}±plus-or-minus\pm 0.00120.00120.0012\phantom{0}0.0002+0.0004subscriptsuperscriptabsent0.00040.0002{}^{+0.0004\phantom{0}}_{-0.0002\phantom{0}}
0.200.200.20 0.030.030.03 0.000460.000460.00046 0.002620.002620.00262±plus-or-minus\pm 0.000940.000940.000940.00012+0.00025subscriptsuperscriptabsent0.000250.00012{}^{+0.00025}_{-0.00012}
0.210.210.21 0.030.030.03 0.00110.00110.0011 0.00320.00320.0032\phantom{0}±plus-or-minus\pm 0.00110.00110.0011\phantom{0}0.0003+0.0002subscriptsuperscriptabsent0.00020.0003{}^{+0.0002\phantom{0}}_{-0.0003\phantom{0}}
0.220.220.22 0.030.030.03 0.00310.00310.0031 0.00320.00320.0032\phantom{0}±plus-or-minus\pm 0.00150.00150.0015\phantom{0}0.0002+0.0003subscriptsuperscriptabsent0.00030.0002{}^{+0.0003\phantom{0}}_{-0.0002\phantom{0}}
Table 5: The diffractive structure function multiplied by xIPsubscript𝑥𝐼𝑃x_{I\!\!P}, xIPF2D(3)(β,Q2,xIP)subscript𝑥𝐼𝑃superscriptsubscript𝐹2𝐷3𝛽superscript𝑄2subscript𝑥𝐼𝑃x_{I\!\!P}F_{2}^{D(3)}(\beta,Q^{2},x_{I\!\!P}), for the low-Q2superscript𝑄2Q^{2} sample. The first uncertainty given is statistical, the second systematic.
Q2delimited-⟨⟩superscript𝑄2\langle Q^{2}\rangle (GeV2) βdelimited-⟨⟩𝛽\langle\beta\rangle xIPdelimited-⟨⟩subscript𝑥𝐼𝑃\langle x_{I\!\!P}\rangle xIPF2D(3)subscript𝑥𝐼𝑃superscriptsubscript𝐹2𝐷3x_{I\!\!P}F_{2}^{D(3)}
0.130.130.13 0.00770.00770.0077 0.00120.00120.0012 0.002570.002570.00257±plus-or-minus\pm 0.000710.000710.000710.00028+0.00029subscriptsuperscriptabsent0.000290.00028{}^{+0.00029}_{-0.00028}
0.160.160.16 0.0230.0230.023 0.00120.00120.0012 0.002840.002840.00284±plus-or-minus\pm 0.000770.000770.000770.00017+0.00025subscriptsuperscriptabsent0.000250.00017{}^{+0.00025}_{-0.00017}
0.110.110.11 0.00160.00160.0016 0.00280.00280.0028 0.001620.001620.00162±plus-or-minus\pm 0.000650.000650.000650.00018+0.00011subscriptsuperscriptabsent0.000110.00018{}^{+0.00011}_{-0.00018}
0.190.190.19 0.0220.0220.022 0.00280.00280.0028 0.00290.00290.0029\phantom{0}±plus-or-minus\pm 0.00100.00100.0010\phantom{0}0.0002+0.0002subscriptsuperscriptabsent0.00020.0002{}^{+0.0002\phantom{0}}_{-0.0002\phantom{0}}
0.130.130.13 0.00120.00120.0012 0.00680.00680.0068 0.002140.002140.00214±plus-or-minus\pm 0.000690.000690.000690.00010+0.00031subscriptsuperscriptabsent0.000310.00010{}^{+0.00031}_{-0.00010}
0.160.160.16 0.00730.00730.0073 0.00680.00680.0068 0.001970.001970.00197±plus-or-minus\pm 0.000670.000670.000670.00013+0.00019subscriptsuperscriptabsent0.000190.00013{}^{+0.00019}_{-0.00013}
0.100.100.10 0.000240.000240.00024 0.0190.0190.019 0.00320.00320.0032\phantom{0}±plus-or-minus\pm 0.00100.00100.0010\phantom{0}0.0002+0.0005subscriptsuperscriptabsent0.00050.0002{}^{+0.0005\phantom{0}}_{-0.0002\phantom{0}}
0.150.150.15 0.00150.00150.0015 0.0190.0190.019 0.00430.00430.0043\phantom{0}±plus-or-minus\pm 0.00130.00130.0013\phantom{0}0.0005+0.0003subscriptsuperscriptabsent0.00030.0005{}^{+0.0003\phantom{0}}_{-0.0005\phantom{0}}
0.100.100.10 0.0000620.0000620.000062 0.0670.0670.067 0.000940.000940.00094±plus-or-minus\pm 0.000180.000180.000180.00005+0.00007subscriptsuperscriptabsent0.000070.00005{}^{+0.00007}_{-0.00005}
0.140.140.14 0.000190.000190.00019 0.0660.0660.066 0.003070.003070.00307±plus-or-minus\pm 0.000440.000440.000440.00037+0.00022subscriptsuperscriptabsent0.000220.00037{}^{+0.00022}_{-0.00037}
Table 6: The diffractive structure function multiplied by xIPsubscript𝑥𝐼𝑃x_{I\!\!P}, xIPF2D(3)(β,Q2,xIP)subscript𝑥𝐼𝑃superscriptsubscript𝐹2𝐷3𝛽superscript𝑄2subscript𝑥𝐼𝑃x_{I\!\!P}F_{2}^{D(3)}(\beta,Q^{2},x_{I\!\!P}), for the low-Q2superscript𝑄2Q^{2} sample. The first uncertainty given is statistical, the second systematic. These are the points plotted in Fig. 12. The data in this table are not independent of those in Table 5.
Q2superscript𝑄2Q^{2} (GeV2) β𝛽\beta xIPsubscript𝑥𝐼𝑃x_{I\!\!P} xIPF2D(3)subscript𝑥𝐼𝑃superscriptsubscript𝐹2𝐷3x_{I\!\!P}F_{2}^{D(3)}
2.42.42.4 0.00700.00700.0070 0.00680.00680.0068 0.01170.01170.0117±plus-or-minus\pm 0.00410.00410.00410.0006+0.0101subscriptsuperscriptabsent0.01010.0006{}^{+0.0101}_{-0.0006}
2.42.42.4 0.00700.00700.0070 0.01900.01900.0190 0.01460.01460.0146±plus-or-minus\pm 0.00230.00230.00230.0000+0.0039subscriptsuperscriptabsent0.00390.0000{}^{+0.0039}_{-0.0000}
2.42.42.4 0.00700.00700.0070 0.04000.04000.0400 0.01660.01660.0166±plus-or-minus\pm 0.00320.00320.00320.0014+0.0021subscriptsuperscriptabsent0.00210.0014{}^{+0.0021}_{-0.0014}
2.42.42.4 0.00700.00700.0070 0.06000.06000.0600 0.02120.02120.0212±plus-or-minus\pm 0.00230.00230.00230.0025+0.0023subscriptsuperscriptabsent0.00230.0025{}^{+0.0023}_{-0.0025}
2.42.42.4 0.03000.03000.0300 0.00280.00280.0028 0.01410.01410.0141±plus-or-minus\pm 0.00380.00380.00380.0022+0.0025subscriptsuperscriptabsent0.00250.0022{}^{+0.0025}_{-0.0022}
2.42.42.4 0.03000.03000.0300 0.00680.00680.0068 0.01390.01390.0139±plus-or-minus\pm 0.00350.00350.00350.0003+0.0038subscriptsuperscriptabsent0.00380.0003{}^{+0.0038}_{-0.0003}
2.42.42.4 0.03000.03000.0300 0.01900.01900.0190 0.01230.01230.0123±plus-or-minus\pm 0.00250.00250.00250.0002+0.0038subscriptsuperscriptabsent0.00380.0002{}^{+0.0038}_{-0.0002}
2.42.42.4 0.03000.03000.0300 0.04000.04000.0400 0.01500.01500.0150±plus-or-minus\pm 0.00230.00230.00230.0040+0.0047subscriptsuperscriptabsent0.00470.0040{}^{+0.0047}_{-0.0040}
2.42.42.4 0.03000.03000.0300 0.06000.06000.0600 0.02180.02180.0218±plus-or-minus\pm 0.00310.00310.00310.0019+0.0030subscriptsuperscriptabsent0.00300.0019{}^{+0.0030}_{-0.0019}
2.42.42.4 0.13000.13000.1300 0.00050.00050.0005 0.01630.01630.0163±plus-or-minus\pm 0.00330.00330.00330.0089+0.0000subscriptsuperscriptabsent0.00000.0089{}^{+0.0000}_{-0.0089}
2.42.42.4 0.13000.13000.1300 0.00120.00120.0012 0.01840.01840.0184±plus-or-minus\pm 0.00350.00350.00350.0034+0.0011subscriptsuperscriptabsent0.00110.0034{}^{+0.0011}_{-0.0034}
2.42.42.4 0.13000.13000.1300 0.00280.00280.0028 0.01310.01310.0131±plus-or-minus\pm 0.00280.00280.00280.0033+0.0029subscriptsuperscriptabsent0.00290.0033{}^{+0.0029}_{-0.0033}
2.42.42.4 0.13000.13000.1300 0.00680.00680.0068 0.01640.01640.0164±plus-or-minus\pm 0.00350.00350.00350.0071+0.0013subscriptsuperscriptabsent0.00130.0071{}^{+0.0013}_{-0.0071}
2.42.42.4 0.13000.13000.1300 0.01900.01900.0190 0.01730.01730.0173±plus-or-minus\pm 0.00330.00330.00330.0007+0.0019subscriptsuperscriptabsent0.00190.0007{}^{+0.0019}_{-0.0007}
2.42.42.4 0.48000.48000.4800 0.00050.00050.0005 0.03310.03310.0331±plus-or-minus\pm 0.00560.00560.00560.0039+0.0019subscriptsuperscriptabsent0.00190.0039{}^{+0.0019}_{-0.0039}
2.42.42.4 0.48000.48000.4800 0.00120.00120.0012 0.02710.02710.0271±plus-or-minus\pm 0.00540.00540.00540.0030+0.0097subscriptsuperscriptabsent0.00970.0030{}^{+0.0097}_{-0.0030}
2.42.42.4 0.48000.48000.4800 0.00280.00280.0028 0.01810.01810.0181±plus-or-minus\pm 0.00400.00400.00400.0051+0.0052subscriptsuperscriptabsent0.00520.0051{}^{+0.0052}_{-0.0051}
3.73.73.7 0.00700.00700.0070 0.01900.01900.0190 0.01340.01340.0134±plus-or-minus\pm 0.00220.00220.00220.0011+0.0017subscriptsuperscriptabsent0.00170.0011{}^{+0.0017}_{-0.0011}
3.73.73.7 0.00700.00700.0070 0.04000.04000.0400 0.01830.01830.0183±plus-or-minus\pm 0.00270.00270.00270.0014+0.0037subscriptsuperscriptabsent0.00370.0014{}^{+0.0037}_{-0.0014}
3.73.73.7 0.00700.00700.0070 0.06000.06000.0600 0.02820.02820.0282±plus-or-minus\pm 0.00390.00390.00390.0017+0.0046subscriptsuperscriptabsent0.00460.0017{}^{+0.0046}_{-0.0017}
3.73.73.7 0.03000.03000.0300 0.00280.00280.0028 0.02060.02060.0206±plus-or-minus\pm 0.00580.00580.00580.0081+0.0008subscriptsuperscriptabsent0.00080.0081{}^{+0.0008}_{-0.0081}
3.73.73.7 0.03000.03000.0300 0.00680.00680.0068 0.01910.01910.0191±plus-or-minus\pm 0.00460.00460.00460.0007+0.0050subscriptsuperscriptabsent0.00500.0007{}^{+0.0050}_{-0.0007}
3.73.73.7 0.03000.03000.0300 0.01900.01900.0190 0.01020.01020.0102±plus-or-minus\pm 0.00320.00320.00320.0001+0.0051subscriptsuperscriptabsent0.00510.0001{}^{+0.0051}_{-0.0001}
3.73.73.7 0.03000.03000.0300 0.04000.04000.0400 0.01340.01340.0134±plus-or-minus\pm 0.00220.00220.00220.0005+0.0031subscriptsuperscriptabsent0.00310.0005{}^{+0.0031}_{-0.0005}
3.73.73.7 0.03000.03000.0300 0.06000.06000.0600 0.02110.02110.0211±plus-or-minus\pm 0.00220.00220.00220.0018+0.0031subscriptsuperscriptabsent0.00310.0018{}^{+0.0031}_{-0.0018}
Table 7: The diffractive structure function multiplied by xIPsubscript𝑥𝐼𝑃x_{I\!\!P}, xIPF2D(3)(β,Q2,xIP)subscript𝑥𝐼𝑃superscriptsubscript𝐹2𝐷3𝛽superscript𝑄2subscript𝑥𝐼𝑃x_{I\!\!P}F_{2}^{D(3)}(\beta,Q^{2},x_{I\!\!P}), for the high-Q2superscript𝑄2Q^{2} sample, part I. The first uncertainty given is statistical, the second systematic.
Q2superscript𝑄2Q^{2} (GeV2) β𝛽\beta xIPsubscript𝑥𝐼𝑃x_{I\!\!P} xIPF2D(3)subscript𝑥𝐼𝑃superscriptsubscript𝐹2𝐷3x_{I\!\!P}F_{2}^{D(3)}
3.73.73.7 0.13000.13000.1300 0.00050.00050.0005 0.02430.02430.0243±plus-or-minus\pm 0.00600.00600.00600.0012+0.0064subscriptsuperscriptabsent0.00640.0012{}^{+0.0064}_{-0.0012}
3.73.73.7 0.13000.13000.1300 0.00120.00120.0012 0.01940.01940.0194±plus-or-minus\pm 0.00370.00370.00370.0024+0.0029subscriptsuperscriptabsent0.00290.0024{}^{+0.0029}_{-0.0024}
3.73.73.7 0.13000.13000.1300 0.00280.00280.0028 0.01420.01420.0142±plus-or-minus\pm 0.00270.00270.00270.0019+0.0022subscriptsuperscriptabsent0.00220.0019{}^{+0.0022}_{-0.0019}
3.73.73.7 0.13000.13000.1300 0.00680.00680.0068 0.00870.00870.0087±plus-or-minus\pm 0.00190.00190.00190.0000+0.0030subscriptsuperscriptabsent0.00300.0000{}^{+0.0030}_{-0.0000}
3.73.73.7 0.13000.13000.1300 0.01900.01900.0190 0.01060.01060.0106±plus-or-minus\pm 0.00160.00160.00160.0016+0.0009subscriptsuperscriptabsent0.00090.0016{}^{+0.0009}_{-0.0016}
3.73.73.7 0.13000.13000.1300 0.04000.04000.0400 0.00890.00890.0089±plus-or-minus\pm 0.00190.00190.00190.0018+0.0007subscriptsuperscriptabsent0.00070.0018{}^{+0.0007}_{-0.0018}
3.73.73.7 0.48000.48000.4800 0.00050.00050.0005 0.04230.04230.0423±plus-or-minus\pm 0.00560.00560.00560.0024+0.0045subscriptsuperscriptabsent0.00450.0024{}^{+0.0045}_{-0.0024}
3.73.73.7 0.48000.48000.4800 0.00120.00120.0012 0.03550.03550.0355±plus-or-minus\pm 0.00580.00580.00580.0033+0.0064subscriptsuperscriptabsent0.00640.0033{}^{+0.0064}_{-0.0033}
3.73.73.7 0.48000.48000.4800 0.00280.00280.0028 0.02770.02770.0277±plus-or-minus\pm 0.00620.00620.00620.0008+0.0074subscriptsuperscriptabsent0.00740.0008{}^{+0.0074}_{-0.0008}
3.73.73.7 0.48000.48000.4800 0.00680.00680.0068 0.02340.02340.0234±plus-or-minus\pm 0.00460.00460.00460.0055+0.0034subscriptsuperscriptabsent0.00340.0055{}^{+0.0034}_{-0.0055}
6.96.96.9 0.00700.00700.0070 0.01900.01900.0190 0.01820.01820.0182±plus-or-minus\pm 0.00310.00310.00310.0027+0.0043subscriptsuperscriptabsent0.00430.0027{}^{+0.0043}_{-0.0027}
6.96.96.9 0.00700.00700.0070 0.04000.04000.0400 0.02500.02500.0250±plus-or-minus\pm 0.00300.00300.00300.0013+0.0040subscriptsuperscriptabsent0.00400.0013{}^{+0.0040}_{-0.0013}
6.96.96.9 0.00700.00700.0070 0.06000.06000.0600 0.02740.02740.0274±plus-or-minus\pm 0.00240.00240.00240.0019+0.0033subscriptsuperscriptabsent0.00330.0019{}^{+0.0033}_{-0.0019}
6.96.96.9 0.03000.03000.0300 0.00680.00680.0068 0.02060.02060.0206±plus-or-minus\pm 0.00380.00380.00380.0017+0.0065subscriptsuperscriptabsent0.00650.0017{}^{+0.0065}_{-0.0017}
6.96.96.9 0.03000.03000.0300 0.01900.01900.0190 0.01380.01380.0138±plus-or-minus\pm 0.00170.00170.00170.0003+0.0020subscriptsuperscriptabsent0.00200.0003{}^{+0.0020}_{-0.0003}
6.96.96.9 0.03000.03000.0300 0.04000.04000.0400 0.01390.01390.0139±plus-or-minus\pm 0.00310.00310.00310.0025+0.0020subscriptsuperscriptabsent0.00200.0025{}^{+0.0020}_{-0.0025}
6.96.96.9 0.03000.03000.0300 0.06000.06000.0600 0.02810.02810.0281±plus-or-minus\pm 0.00320.00320.00320.0013+0.0057subscriptsuperscriptabsent0.00570.0013{}^{+0.0057}_{-0.0013}
6.96.96.9 0.13000.13000.1300 0.00120.00120.0012 0.02370.02370.0237±plus-or-minus\pm 0.00440.00440.00440.0025+0.0058subscriptsuperscriptabsent0.00580.0025{}^{+0.0058}_{-0.0025}
6.96.96.9 0.13000.13000.1300 0.00280.00280.0028 0.01960.01960.0196±plus-or-minus\pm 0.00320.00320.00320.0051+0.0010subscriptsuperscriptabsent0.00100.0051{}^{+0.0010}_{-0.0051}
6.96.96.9 0.13000.13000.1300 0.00680.00680.0068 0.01140.01140.0114±plus-or-minus\pm 0.00200.00200.00200.0014+0.0016subscriptsuperscriptabsent0.00160.0014{}^{+0.0016}_{-0.0014}
6.96.96.9 0.13000.13000.1300 0.01900.01900.0190 0.01360.01360.0136±plus-or-minus\pm 0.00180.00180.00180.0011+0.0031subscriptsuperscriptabsent0.00310.0011{}^{+0.0031}_{-0.0011}
6.96.96.9 0.13000.13000.1300 0.04000.04000.0400 0.01470.01470.0147±plus-or-minus\pm 0.00260.00260.00260.0006+0.0025subscriptsuperscriptabsent0.00250.0006{}^{+0.0025}_{-0.0006}
6.96.96.9 0.13000.13000.1300 0.06000.06000.0600 0.01900.01900.0190±plus-or-minus\pm 0.00330.00330.00330.0012+0.0031subscriptsuperscriptabsent0.00310.0012{}^{+0.0031}_{-0.0012}
6.96.96.9 0.48000.48000.4800 0.00050.00050.0005 0.04360.04360.0436±plus-or-minus\pm 0.00530.00530.00530.0026+0.0060subscriptsuperscriptabsent0.00600.0026{}^{+0.0060}_{-0.0026}
6.96.96.9 0.48000.48000.4800 0.00120.00120.0012 0.03330.03330.0333±plus-or-minus\pm 0.00430.00430.00430.0013+0.0037subscriptsuperscriptabsent0.00370.0013{}^{+0.0037}_{-0.0013}
6.96.96.9 0.48000.48000.4800 0.00280.00280.0028 0.02750.02750.0275±plus-or-minus\pm 0.00420.00420.00420.0014+0.0044subscriptsuperscriptabsent0.00440.0014{}^{+0.0044}_{-0.0014}
6.96.96.9 0.48000.48000.4800 0.00680.00680.0068 0.02600.02600.0260±plus-or-minus\pm 0.00410.00410.00410.0024+0.0042subscriptsuperscriptabsent0.00420.0024{}^{+0.0042}_{-0.0024}
6.96.96.9 0.48000.48000.4800 0.01900.01900.0190 0.01560.01560.0156±plus-or-minus\pm 0.00280.00280.00280.0024+0.0017subscriptsuperscriptabsent0.00170.0024{}^{+0.0017}_{-0.0024}
Table 8: The diffractive structure function multiplied by xIPsubscript𝑥𝐼𝑃x_{I\!\!P}, xIPF2D(3)(β,Q2,xIP)subscript𝑥𝐼𝑃superscriptsubscript𝐹2𝐷3𝛽superscript𝑄2subscript𝑥𝐼𝑃x_{I\!\!P}F_{2}^{D(3)}(\beta,Q^{2},x_{I\!\!P}), for the high-Q2superscript𝑄2Q^{2} sample, part II. The first uncertainty given is statistical, the second systematic.
Q2superscript𝑄2Q^{2} (GeV2) β𝛽\beta xIPsubscript𝑥𝐼𝑃x_{I\!\!P} xIPF2D(3)subscript𝑥𝐼𝑃superscriptsubscript𝐹2𝐷3x_{I\!\!P}F_{2}^{D(3)}
13.513.513.5 0.00700.00700.0070 0.04000.04000.0400 0.04060.04060.0406±plus-or-minus\pm 0.00730.00730.00730.0036+0.0126subscriptsuperscriptabsent0.01260.0036{}^{+0.0126}_{-0.0036}
13.513.513.5 0.00700.00700.0070 0.06000.06000.0600 0.04200.04200.0420±plus-or-minus\pm 0.00460.00460.00460.0028+0.0061subscriptsuperscriptabsent0.00610.0028{}^{+0.0061}_{-0.0028}
13.513.513.5 0.03000.03000.0300 0.01900.01900.0190 0.02070.02070.0207±plus-or-minus\pm 0.00390.00390.00390.0014+0.0025subscriptsuperscriptabsent0.00250.0014{}^{+0.0025}_{-0.0014}
13.513.513.5 0.03000.03000.0300 0.04000.04000.0400 0.02640.02640.0264±plus-or-minus\pm 0.00370.00370.00370.0032+0.0074subscriptsuperscriptabsent0.00740.0032{}^{+0.0074}_{-0.0032}
13.513.513.5 0.03000.03000.0300 0.06000.06000.0600 0.03030.03030.0303±plus-or-minus\pm 0.00320.00320.00320.0030+0.0041subscriptsuperscriptabsent0.00410.0030{}^{+0.0041}_{-0.0030}
13.513.513.5 0.13000.13000.1300 0.00280.00280.0028 0.02100.02100.0210±plus-or-minus\pm 0.00460.00460.00460.0033+0.0043subscriptsuperscriptabsent0.00430.0033{}^{+0.0043}_{-0.0033}
13.513.513.5 0.13000.13000.1300 0.00680.00680.0068 0.01650.01650.0165±plus-or-minus\pm 0.00280.00280.00280.0010+0.0032subscriptsuperscriptabsent0.00320.0010{}^{+0.0032}_{-0.0010}
13.513.513.5 0.13000.13000.1300 0.01900.01900.0190 0.01570.01570.0157±plus-or-minus\pm 0.00210.00210.00210.0008+0.0026subscriptsuperscriptabsent0.00260.0008{}^{+0.0026}_{-0.0008}
13.513.513.5 0.13000.13000.1300 0.04000.04000.0400 0.01750.01750.0175±plus-or-minus\pm 0.00270.00270.00270.0050+0.0010subscriptsuperscriptabsent0.00100.0050{}^{+0.0010}_{-0.0050}
13.513.513.5 0.13000.13000.1300 0.06000.06000.0600 0.02100.02100.0210±plus-or-minus\pm 0.00270.00270.00270.0032+0.0030subscriptsuperscriptabsent0.00300.0032{}^{+0.0030}_{-0.0032}
13.513.513.5 0.48000.48000.4800 0.00050.00050.0005 0.04830.04830.0483±plus-or-minus\pm 0.01080.01080.01080.0011+0.0185subscriptsuperscriptabsent0.01850.0011{}^{+0.0185}_{-0.0011}
13.513.513.5 0.48000.48000.4800 0.00120.00120.0012 0.03260.03260.0326±plus-or-minus\pm 0.00460.00460.00460.0023+0.0032subscriptsuperscriptabsent0.00320.0023{}^{+0.0032}_{-0.0023}
13.513.513.5 0.48000.48000.4800 0.00280.00280.0028 0.02620.02620.0262±plus-or-minus\pm 0.00400.00400.00400.0068+0.0017subscriptsuperscriptabsent0.00170.0068{}^{+0.0017}_{-0.0068}
13.513.513.5 0.48000.48000.4800 0.00680.00680.0068 0.02020.02020.0202±plus-or-minus\pm 0.00310.00310.00310.0009+0.0034subscriptsuperscriptabsent0.00340.0009{}^{+0.0034}_{-0.0009}
13.513.513.5 0.48000.48000.4800 0.01900.01900.0190 0.02360.02360.0236±plus-or-minus\pm 0.00410.00410.00410.0026+0.0040subscriptsuperscriptabsent0.00400.0026{}^{+0.0040}_{-0.0026}
13.513.513.5 0.48000.48000.4800 0.04000.04000.0400 0.01400.01400.0140±plus-or-minus\pm 0.00300.00300.00300.0002+0.0056subscriptsuperscriptabsent0.00560.0002{}^{+0.0056}_{-0.0002}
39.039.039.0 0.03000.03000.0300 0.04000.04000.0400 0.03790.03790.0379±plus-or-minus\pm 0.00660.00660.00660.0038+0.0063subscriptsuperscriptabsent0.00630.0038{}^{+0.0063}_{-0.0038}
39.039.039.0 0.03000.03000.0300 0.06000.06000.0600 0.03940.03940.0394±plus-or-minus\pm 0.00450.00450.00450.0037+0.0057subscriptsuperscriptabsent0.00570.0037{}^{+0.0057}_{-0.0037}
39.039.039.0 0.13000.13000.1300 0.00680.00680.0068 0.03030.03030.0303±plus-or-minus\pm 0.00700.00700.00700.0122+0.0007subscriptsuperscriptabsent0.00070.0122{}^{+0.0007}_{-0.0122}
39.039.039.0 0.13000.13000.1300 0.01900.01900.0190 0.02230.02230.0223±plus-or-minus\pm 0.00330.00330.00330.0005+0.0063subscriptsuperscriptabsent0.00630.0005{}^{+0.0063}_{-0.0005}
39.039.039.0 0.13000.13000.1300 0.04000.04000.0400 0.02030.02030.0203±plus-or-minus\pm 0.00330.00330.00330.0023+0.0031subscriptsuperscriptabsent0.00310.0023{}^{+0.0031}_{-0.0023}
39.039.039.0 0.13000.13000.1300 0.06000.06000.0600 0.02890.02890.0289±plus-or-minus\pm 0.00330.00330.00330.0033+0.0041subscriptsuperscriptabsent0.00410.0033{}^{+0.0041}_{-0.0033}
39.039.039.0 0.48000.48000.4800 0.00280.00280.0028 0.02870.02870.0287±plus-or-minus\pm 0.00560.00560.00560.0032+0.0040subscriptsuperscriptabsent0.00400.0032{}^{+0.0040}_{-0.0032}
39.039.039.0 0.48000.48000.4800 0.00680.00680.0068 0.02120.02120.0212±plus-or-minus\pm 0.00410.00410.00410.0019+0.0028subscriptsuperscriptabsent0.00280.0019{}^{+0.0028}_{-0.0019}
39.039.039.0 0.48000.48000.4800 0.01900.01900.0190 0.01760.01760.0176±plus-or-minus\pm 0.00290.00290.00290.0012+0.0033subscriptsuperscriptabsent0.00330.0012{}^{+0.0033}_{-0.0012}
39.039.039.0 0.48000.48000.4800 0.04000.04000.0400 0.02000.02000.0200±plus-or-minus\pm 0.00420.00420.00420.0017+0.0052subscriptsuperscriptabsent0.00520.0017{}^{+0.0052}_{-0.0017}
39.039.039.0 0.48000.48000.4800 0.06000.06000.0600 0.01900.01900.0190±plus-or-minus\pm 0.00330.00330.00330.0041+0.0033subscriptsuperscriptabsent0.00330.0041{}^{+0.0033}_{-0.0041}
Table 9: The diffractive structure function multiplied by xIPsubscript𝑥𝐼𝑃x_{I\!\!P}, xIPF2D(3)(β,Q2,xIP)subscript𝑥𝐼𝑃superscriptsubscript𝐹2𝐷3𝛽superscript𝑄2subscript𝑥𝐼𝑃x_{I\!\!P}F_{2}^{D(3)}(\beta,Q^{2},x_{I\!\!P}), for the high-Q2superscript𝑄2Q^{2} sample, part III. The first uncertainty given is statistical, the second systematic.
Q2superscript𝑄2Q^{2} (GeV2) β𝛽\beta xIPsubscript𝑥𝐼𝑃x_{I\!\!P} F2D(3),cc¯/F2D(3)superscriptsubscript𝐹2𝐷3𝑐¯𝑐superscriptsubscript𝐹2𝐷3F_{2}^{D(3),c\bar{c}}/F_{2}^{D(3)}
4.04.04.0 0.020.020.02 0.0040.0040.004 0.29±0.120.16+0.10plus-or-minus0.29subscriptsuperscript0.120.100.160.29\pm 0.12^{+0.10}_{-0.16}
4.04.04.0 0.050.050.05 0.0040.0040.004 0.20±0.080.05+0.06plus-or-minus0.20subscriptsuperscript0.080.060.050.20\pm 0.08^{+0.06}_{-0.05}
4.04.04.0 0.20.20.2 0.0040.0040.004 0.06±0.020.02+0.02plus-or-minus0.06subscriptsuperscript0.020.020.020.06\pm 0.02^{+0.02}_{-0.02}
25.025.025.0 0.20.20.2 0.0040.0040.004 0.35±0.100.06+0.09plus-or-minus0.35subscriptsuperscript0.100.090.060.35\pm 0.10^{+0.09}_{-0.06}
25.025.025.0 0.50.50.5 0.0040.0040.004 0.15±0.050.03+0.04plus-or-minus0.15subscriptsuperscript0.050.040.030.15\pm 0.05^{+0.04}_{-0.03}
Table 10: The ratio of F2D(3),cc¯superscriptsubscript𝐹2𝐷3𝑐¯𝑐F_{2}^{D(3),c\bar{c}} [66] and the present F2D(3)superscriptsubscript𝐹2𝐷3F_{2}^{D(3)} measurement. The first uncertainty given is statistical, the second systematic.
Refer to caption
Figure 1: Schematic diagram of the reaction epeXp𝑒𝑝𝑒𝑋𝑝ep\rightarrow eXp.
Refer to caption
Figure 2: Comparison of the measured (points) and Monte-Carlo simulated (histograms) distributions for xLsubscript𝑥𝐿x_{L}, |t|𝑡|t|, Q2superscript𝑄2Q^{2}, W𝑊W, MXsubscript𝑀𝑋M_{X} and xIPsubscript𝑥𝐼𝑃x_{I\!\!P} in the low-Q2superscript𝑄2Q^{2} analysis. The Q2superscript𝑄2Q^{2} and W𝑊W distributions were obtained without the LPS requirement (see text).
Refer to caption
Figure 3: Comparison of the measured (points) and Monte-Carlo simulated (histograms) distributions for xLsubscript𝑥𝐿x_{L}, |t|𝑡|t|, Q2superscript𝑄2Q^{2}, W𝑊W, MXsubscript𝑀𝑋M_{X} and xIPsubscript𝑥𝐼𝑃x_{I\!\!P} in the high-Q2superscript𝑄2Q^{2} analysis.
Refer to caption
Figure 4: Distribution of E+pZ𝐸subscript𝑝𝑍E+p_{Z} for the high-Q2superscript𝑄2Q^{2} events. The hatched histogram represents the beam-halo sample obtained as discussed in the text. The empty histogram is the sum of the RAPGAP Monte Carlo and the beam-halo contribution. The vertical dashed line is at E+pZ=1655𝐸subscript𝑝𝑍1655E+p_{Z}=1655 GeV, the value of the cut used to suppress beam-halo events.
Refer to caption
Figure 5: (a) The differential cross-section dσepeXp/dt𝑑superscript𝜎𝑒𝑝𝑒𝑋𝑝𝑑𝑡d\sigma^{ep\rightarrow eXp}/dt in the region xIP<0.01subscript𝑥𝐼𝑃0.01x_{I\!\!P}<0.01, 2<Q2<1002superscript𝑄21002<Q^{2}<100 GeV2 and MX>1.5subscript𝑀𝑋1.5M_{X}>1.5 GeV. The inner error bars show the statistical uncertainties and the full bars indicate the statistical and the systematic uncertainties added in quadrature. The overall normalisation uncertainty of ±10plus-or-minus10\pm 10% is not shown. The line shows the result of the fit described in the text. (b) The value of the slope parameter b𝑏b of the differential cross-section dσepeXp/dt𝑑superscript𝜎𝑒𝑝𝑒𝑋𝑝𝑑𝑡d\sigma^{ep\rightarrow eXp}/dt as a function of Q2superscript𝑄2Q^{2}. (c) The value of the slope parameter b𝑏b of the differential cross-section dσepeXp/dt𝑑superscript𝜎𝑒𝑝𝑒𝑋𝑝𝑑𝑡d\sigma^{ep\rightarrow eXp}/dt as a function of xIPsubscript𝑥𝐼𝑃x_{I\!\!P}. The mean value of β𝛽\beta in each bin is also given. (d) The value of the slope parameter bpT2subscript𝑏superscriptsubscript𝑝𝑇2b_{p_{T}^{2}} of the differential cross-section dσepeXp/dpT2𝑑superscript𝜎𝑒𝑝𝑒𝑋𝑝𝑑superscriptsubscript𝑝𝑇2d\sigma^{ep\rightarrow eXp}/dp_{T}^{2} as a function of xIPsubscript𝑥𝐼𝑃x_{I\!\!P}. The symbols labelled ZEUS 97 indicate the present results. Earlier ZEUS results are also shown: ZEUS 95 [9], ZEUS 94 [13] (Q2=0superscript𝑄20Q^{2}=0) and ZEUS 94 [12] (Q2>0superscript𝑄20Q^{2}>0).
Refer to caption
Figure 6: The differential cross-section dσepeXp/dΦ𝑑superscript𝜎𝑒𝑝𝑒𝑋𝑝𝑑Φd\sigma^{ep\rightarrow eXp}/d\Phi in the kinematic ranges (a) 0.00025<xIP<0.010.00025subscript𝑥𝐼𝑃0.010.00025<x_{I\!\!P}<0.01 and (b) 0.01<xIP<0.070.01subscript𝑥𝐼𝑃0.070.01<x_{I\!\!P}<0.07. The error bars show the statistical uncertainty. The line shows the result of the fit described in the text. The azimuthal asymmetry ALTsubscript𝐴𝐿𝑇A_{LT} as a function of (c) xIPsubscript𝑥𝐼𝑃x_{I\!\!P}, (d) β𝛽\beta, (e) |t|𝑡|t| and (f) Q2superscript𝑄2Q^{2} for xIP<0.01subscript𝑥𝐼𝑃0.01x_{I\!\!P}<0.01. The inner error bars show the statistical uncertainties and the full bars indicate the statistical and the systematic uncertainties added in quadrature.
Refer to caption
Figure 7: The cross-section dσγpXp/dMX𝑑superscript𝜎superscript𝛾𝑝𝑋𝑝𝑑subscript𝑀𝑋d\sigma^{\gamma^{\star}p\rightarrow Xp}/dM_{X} as a function of Q2superscript𝑄2Q^{2} at different MXsubscript𝑀𝑋M_{X} and W𝑊W values. The inner error bars show the statistical uncertainties and the full bars indicate the statistical and the systematic uncertainties added in quadrature; in several bins the size of the bars is smaller than that of the symbol used for the points. The overall normalisation uncertainty of %10+12{}^{+12}_{-10}\% is not shown. The symbols labelled ZEUS 97 indicate the present results. Earlier ZEUS results are also shown: ZEUS 96-97 MXsubscript𝑀𝑋M_{X} [8], ZEUS 94 MXsubscript𝑀𝑋M_{X} [10]. The solid lines are the result of the BEKW fit to the present high-Q2superscript𝑄2Q^{2} data, described in Section 10.7.1; the dashed lines indicate the extrapolation outside the fit region. The dotted lines indicate the qq¯g𝑞¯𝑞𝑔q{\bar{q}}g contribution. The xIPsubscript𝑥𝐼𝑃x_{I\!\!P} ranges given refer to the coverage of the data.
Refer to caption
Figure 8: The ratio of MX2dσγpXp/dMX2superscriptsubscript𝑀𝑋2𝑑superscript𝜎superscript𝛾𝑝𝑋𝑝𝑑superscriptsubscript𝑀𝑋2M_{X}^{2}d\sigma^{\gamma^{*}p\rightarrow Xp}/dM_{X}^{2} to the total virtual photon proton cross section as a function of Q2superscript𝑄2Q^{2} at different MXsubscript𝑀𝑋M_{X} and W𝑊W values. The inner error bars show the statistical uncertainties and the full bars indicate the statistical and the systematic uncertainties added in quadrature. The overall normalisation uncertainty of %10+12{}^{+12}_{-10}\% is not shown. Earlier ZEUS results are also shown: ZEUS 96-97 MXsubscript𝑀𝑋M_{X} [8], ZEUS 94 MXsubscript𝑀𝑋M_{X} [10]. The solid lines are the result of the BEKW fit divided by the ALLM97 parameterisation, as described in Section 10.7.1. The dashed lines indicate the extrapolation outside the fit region.
Refer to caption
Figure 9: The diffractive structure function multiplied by xIPsubscript𝑥𝐼𝑃x_{I\!\!P}, xIPF2D(3)(β,Q2,xIP)subscript𝑥𝐼𝑃superscriptsubscript𝐹2𝐷3𝛽superscript𝑄2subscript𝑥𝐼𝑃x_{I\!\!P}F_{2}^{D(3)}(\beta,Q^{2},x_{I\!\!P}), as a function of xIPsubscript𝑥𝐼𝑃x_{I\!\!P}, for different values of β𝛽\beta and Q2superscript𝑄2Q^{2}. The inner error bars show the statistical uncertainties and the full bars indicate the statistical and the systematic uncertainties added in quadrature. In some bins the size of the bars is smaller than that of the symbol used for the points. The overall normalisation uncertainty of %10+12{}^{+12}_{-10}\% is not shown. The vertical dotted lines indicate xIP=0.01subscript𝑥𝐼𝑃0.01x_{I\!\!P}=0.01. For the low-Q2superscript𝑄2Q^{2} points, the average value of Q2superscript𝑄2Q^{2} in each β𝛽\beta-xIPsubscript𝑥𝐼𝑃x_{I\!\!P} bin varies between 0.100.100.10 and 0.220.220.22 GeV2 (see Table 5). The solid lines show the result of the Regge fit described in Section 10.6. The dashed curves are the extension of the fit for xIP>0.01subscript𝑥𝐼𝑃0.01x_{I\!\!P}>0.01.
Refer to caption
Figure 10: The diffractive structure function multiplied by xIPsubscript𝑥𝐼𝑃x_{I\!\!P}, xIPF2D(3)(β,Q2,xIP)subscript𝑥𝐼𝑃superscriptsubscript𝐹2𝐷3𝛽superscript𝑄2subscript𝑥𝐼𝑃x_{I\!\!P}F_{2}^{D(3)}(\beta,Q^{2},x_{I\!\!P}), as a function of Q2superscript𝑄2Q^{2}, for the low- and high-Q2superscript𝑄2Q^{2} data, in the β𝛽\beta-xIPsubscript𝑥𝐼𝑃x_{I\!\!P} region in which the two data-sets overlap. The inner error bars show the statistical uncertainties and the full bars indicate the statistical and the systematic uncertainties added in quadrature. The overall normalisation uncertainty of %10+12{}^{+12}_{-10}\% is not shown. The data shown here are those presented in Table 5 rebinned in xLsubscript𝑥𝐿x_{L} slightly for plotting purposes.
Refer to caption
Figure 11: The diffractive structure function multiplied by xIPsubscript𝑥𝐼𝑃x_{I\!\!P}, xIPF2D(3)(β,Q2,xIP)subscript𝑥𝐼𝑃superscriptsubscript𝐹2𝐷3𝛽superscript𝑄2subscript𝑥𝐼𝑃x_{I\!\!P}F_{2}^{D(3)}(\beta,Q^{2},x_{I\!\!P}), as a function of Q2superscript𝑄2Q^{2}, for different values of xIPsubscript𝑥𝐼𝑃x_{I\!\!P} and β𝛽\beta. The inner error bars show the statistical uncertainties and the full bars indicate the statistical and the systematic uncertainties added in quadrature. The overall normalisation uncertainty of %10+12{}^{+12}_{-10}\% is not shown. The solid lines are the prediction of the saturation model of Bartels et al. [59] (BGK) discussed in Section 10.7.2; the dashed lines indicate the extrapolation of the model beyond xIP=0.01subscript𝑥𝐼𝑃0.01x_{I\!\!P}=0.01.
Refer to caption
Figure 12: The diffractive structure function multiplied by xIPsubscript𝑥𝐼𝑃x_{I\!\!P}, xIPF2D(3)(β,Q2,xIP)subscript𝑥𝐼𝑃superscriptsubscript𝐹2𝐷3𝛽superscript𝑄2subscript𝑥𝐼𝑃x_{I\!\!P}F_{2}^{D(3)}(\beta,Q^{2},x_{I\!\!P}), as a function of β𝛽\beta, for different values of xIPsubscript𝑥𝐼𝑃x_{I\!\!P} and Q2superscript𝑄2Q^{2}. The inner error bars show the statistical uncertainties and the full bars indicate the statistical and the systematic uncertainties added in quadrature. The overall normalisation uncertainty of %10+12{}^{+12}_{-10}\% is not shown. The low-Q2superscript𝑄2Q^{2} data in the bin labelled xIP=0.06subscript𝑥𝐼𝑃0.06x_{I\!\!P}=0.06 have xIP=0.067subscript𝑥𝐼𝑃0.067x_{I\!\!P}=0.067 and xIP=0.066subscript𝑥𝐼𝑃0.066x_{I\!\!P}=0.066, respectively (see Table 6). The solid lines are the prediction of the saturation model of Bartels et al. [59] (BGK) discussed in Section 10.7.2; the dashed lines indicate the extrapolation of the model beyond xIP=0.01subscript𝑥𝐼𝑃0.01x_{I\!\!P}=0.01.
Refer to caption
Figure 13: The ratio of the diffractive to the inclusive structure functions, xIPF2D(3)(xIP,x,Q2)/F2(x,Q2)subscript𝑥𝐼𝑃superscriptsubscript𝐹2𝐷3subscript𝑥𝐼𝑃𝑥superscript𝑄2subscript𝐹2𝑥superscript𝑄2x_{I\!\!P}F_{2}^{D(3)}(x_{I\!\!P},x,Q^{2})/F_{2}(x,Q^{2}), as a function of Q2superscript𝑄2Q^{2} at different values of xIPsubscript𝑥𝐼𝑃x_{I\!\!P} and x𝑥x. The values of F2(x,Q2)subscript𝐹2𝑥superscript𝑄2F_{2}(x,Q^{2}) were obtained from the ALLM97 parameterisation. The inner error bars show the statistical uncertainties and the full bars indicate the statistical and the systematic uncertainties added in quadrature. The overall normalisation uncertainty of %10+12{}^{+12}_{-10}\% is not shown. The horizontal lines indicate the average value of the ratio and are only meant to guide the eye.
Refer to caption
Figure 14: The ratio of the diffractive to the inclusive structure functions, xIPF2D(3)(xIP,x,Q2)/F2(x,Q2)subscript𝑥𝐼𝑃superscriptsubscript𝐹2𝐷3subscript𝑥𝐼𝑃𝑥superscript𝑄2subscript𝐹2𝑥superscript𝑄2x_{I\!\!P}F_{2}^{D(3)}(x_{I\!\!P},x,Q^{2})/F_{2}(x,Q^{2}), as a function of x𝑥x at different values of xIPsubscript𝑥𝐼𝑃x_{I\!\!P} and Q2superscript𝑄2Q^{2}. The values of F2(x,Q2)subscript𝐹2𝑥superscript𝑄2F_{2}(x,Q^{2}) were obtained from the ALLM97 parameterisation. The inner error bars show the statistical uncertainties and the full bars indicate the statistical and the systematic uncertainties added in quadrature. The overall normalisation uncertainty of %10+12{}^{+12}_{-10}\% is not shown. The horizontal lines indicate the average value of the ratio and are only meant to guide the eye.
Refer to caption
Figure 15: The diffractive structure function multiplied by xIPsubscript𝑥𝐼𝑃x_{I\!\!P}, xIPF2D(3)(β,Q2,xIP)subscript𝑥𝐼𝑃superscriptsubscript𝐹2𝐷3𝛽superscript𝑄2subscript𝑥𝐼𝑃x_{I\!\!P}F_{2}^{D(3)}(\beta,Q^{2},x_{I\!\!P}) as a function of xIPsubscript𝑥𝐼𝑃x_{I\!\!P}, for different values of β𝛽\beta and Q2superscript𝑄2Q^{2} for the LPS and MXsubscript𝑀𝑋M_{X}-method [10] analyses; the latter points are rescaled by 1/RMX=0.6451subscript𝑅subscript𝑀𝑋0.6451/R_{M_{X}}=0.645, as discussed in the text. The inner error bars show the statistical uncertainties and the full bars indicate the statistical and the systematic uncertainties added in quadrature. The overall normalisation uncertainties of  %10+12{}^{+12}_{-10}\% (LPS data) and 2%percent22\% (MXsubscript𝑀𝑋M_{X}-method data) are not shown.
Refer to caption
Figure 16: The diffractive structure function multiplied by xIPsubscript𝑥𝐼𝑃x_{I\!\!P}, xIPF2D(3)(β,Q2,xIP)subscript𝑥𝐼𝑃superscriptsubscript𝐹2𝐷3𝛽superscript𝑄2subscript𝑥𝐼𝑃x_{I\!\!P}F_{2}^{D(3)}(\beta,Q^{2},x_{I\!\!P}) as a function of xIPsubscript𝑥𝐼𝑃x_{I\!\!P}, for different values of β𝛽\beta and Q2superscript𝑄2Q^{2} for the LPS and the H1 data [15]. The inner error bars show the statistical uncertainties and the full bars are the statistical and the systematic uncertainties added in quadrature. The overall normalisation uncertainties of %10+12{}^{+12}_{-10}\% (LPS data), ±6%plus-or-minuspercent6\pm 6\% (H1 data, Q2<9superscript𝑄29Q^{2}<9 GeV2) and ±4.8%plus-or-minuspercent4.8\pm 4.8\% (H1 data, Q2>9superscript𝑄29Q^{2}>9 GeV2) are not shown.
Refer to caption
Figure 17: The diffractive structure function multiplied by xIPsubscript𝑥𝐼𝑃x_{I\!\!P}, xIPF2D(3)(β,Q2,xIP)subscript𝑥𝐼𝑃superscriptsubscript𝐹2𝐷3𝛽superscript𝑄2subscript𝑥𝐼𝑃x_{I\!\!P}F_{2}^{D(3)}(\beta,Q^{2},x_{I\!\!P}), as a function of xIPsubscript𝑥𝐼𝑃x_{I\!\!P}, for different values of β𝛽\beta and Q2superscript𝑄2Q^{2}. The inner error bars show the statistical uncertainties and the full bars indicate the statistical and the systematic uncertainties added in quadrature. The overall normalisation uncertainty of %10+12{}^{+12}_{-10}\% is not shown. The solid lines are the prediction of the saturation model of Bartels et al. [59] (BGK) and are discussed in Section 10.7.2. The dashed curves are the extrapolation of the model prediction for xIP>0.01subscript𝑥𝐼𝑃0.01x_{I\!\!P}>0.01.
Refer to caption
Figure 18: (a) The diffractive structure function multiplied by xIPsubscript𝑥𝐼𝑃x_{I\!\!P}, xIPF2D(3)(β,Q2,xIP)subscript𝑥𝐼𝑃superscriptsubscript𝐹2𝐷3𝛽superscript𝑄2subscript𝑥𝐼𝑃x_{I\!\!P}F_{2}^{D(3)}(\beta,Q^{2},x_{I\!\!P}), as a function of Q2superscript𝑄2Q^{2}, for different values of xIPsubscript𝑥𝐼𝑃x_{I\!\!P} and β𝛽\beta. The inner error bars show the statistical uncertainties and the full bars are the statistical and the systematic uncertainties added in quadrature. The overall normalisation uncertainty of  %10+12{}^{+12}_{-10}\% is not shown. (b) The measured charm contribution to the diffractive structure function multiplied by xIPsubscript𝑥𝐼𝑃x_{I\!\!P}, xIPF2D(3),cc¯(β,Q2,xIP)subscript𝑥𝐼𝑃superscriptsubscript𝐹2𝐷3𝑐¯𝑐𝛽superscript𝑄2subscript𝑥𝐼𝑃x_{I\!\!P}F_{2}^{D(3),c\bar{c}}(\beta,Q^{2},x_{I\!\!P}), as a function of β𝛽\beta, for different values of Q2superscript𝑄2Q^{2} and xIP=0.004subscript𝑥𝐼𝑃0.004x_{I\!\!P}=0.004 [66]. (c) The ratio of F2D(3),cc¯superscriptsubscript𝐹2𝐷3𝑐¯𝑐F_{2}^{D(3),c\bar{c}} [66] and the present F2D(3)superscriptsubscript𝐹2𝐷3F_{2}^{D(3)} measurement as a function of β𝛽\beta. The solid lines are the result of QCD NLO fit described in the text.