f
CLEO Collaboration
New Measurements of Decays to Charmonium Final States
Abstract
Using data collected by the CLEO III detector at CESR, we report on measurements of decays to charmonium final states. The data sample used for this analysis consists of decays, representing about 35 times more data than previous CLEO data samples. We present substantially improved measurements of the branching fraction using and decays. The branching fractions for these two modes are averaged, thereby obtaining: (stat)0.6(syst)). A greatly improved measurement of the momentum distribution is presented and indicates a spectrum which is much softer than predicted by the color-octet model and somewhat softer than the color-singlet model. First measurements of the polarization and production angle are also presented. In addition, we report on the first observation of and evidence for . Their branching fractions are measured relative to and are found to be: (stat)0.08(syst), = 0.350.08(stat)0.06(syst), = 0.520.12(stat)0.09(syst), and at 90% confidence level. The resulting feed-down contributions to are (246(stat)5(syst))% for , (113(stat)2(syst))% for , (102(stat)2(syst))% for , and at 90% confidence level for . These measurements (apart from ) are about a factor of two larger than expected based on the color-octet model.
pacs:
13.25.GvI Introduction
Charmonium has played a crucial role in the recent history of particle physics. It has been nearly 30 years since its discovery in both interactions jpsi_discovery1 and in collisions of protons on a beryllium target jpsi_discovery2 . Over the last two decades, the charmonium and bottomonium systems have served as a laboratory for testing QCD. In the weak sector, charmonium also serves as a critical tool in extracting CKM ckm phases in -meson decays. However, even after 30 years of studying systems, we still lack a complete understanding of their production mechanisms in glue-rich environments.
About a decade ago, the CDF experiment reported production rates of charmonium in proton-antiproton collisions which exceeded the existing theoretical calculations by a factor of about 10 for and about a factor of 50 for cdf1 . An explanation of this excess was given by the so-called color-octet mechanism color_octet_mech , whereby a gluon fragments into a color-octet pair, which then evolves non-perturbatively into a color-singlet by emission of a soft gluon. The size of this non-perturbative matrix element is not predicted and was determined by a fit to the CDF data. Because of the glue-rich environment and the suppression of the color-singlet process relative to the color-octet process, it was argued color_octet_mech that the latter contribution is likely to be important. While this model can explain the rate and momentum spectrum of and production at the Tevatron it appears that it does not properly describe recent polarization data from CDF cdf2 . Furthermore, when the same matrix elements determined at CDF are applied to photoproduction of at HERA, the color-octet contribution is about a factor of ten too large h1 .
Over the last several years, the role of the color-octet mechanism in production in collisions has been under theoretical study ee_jpsi . The dynamics of the color-octet processes are expected to give rise to significant differences in the momentum spectrum and production angle as compared to color-singlet production. Recently, both BaBaR babar_ee_jpsi and Belle belle_ee_jpsi have reported measurements of the cross section and the momentum spectra of ’s in collisions on the ( decays excluded) or just below the (i.e., in the continuum). BaBaR measures ) pb, whereas Belle measures a number which is 40% lower, (1.470.100.13) pb (about 3 standard deviations below than the BaBaR result). The two experiments both observe similar shapes for the momentum spectrum, which are softer than the predictions of the color-octet model ee_jpsi which predict a peaking of the momentum spectrum near the kinematic endpoint. However, recent theoretical studies of the color-octet subprocesses, fleming1 and lin-zhu , show that the perturbative expansion breaks down near the kinematic endpoint, and the authors appeal to soft-collinear effective theory (SCET) to systematically include the non-perturbative effects. In Ref. fleming1 , it is shown that by using SCET the color-octet model predictions can be sufficiently softened and reasonably good agreement with data can be achieved, although the calculation is not completely predictive because it uses a shape function which is fit to the data belle_ee_jpsi ; babar_ee_jpsi . Belle also reports on production of in collisions, with a measured ratio . belle_ee_jpsi . That is, the production rates for and in collisions are approximately equal. The color-singlet mechanism can yield the final state, but the expected ratio is 10% li-xie-wang . Belle has extended their inclusive analysis to search for associated charmed particles, and they find: belle_ee_jpsi2 . The color-octet contribution is expected to be at the level of 1% cheung_1s of the inclusive rate. The disagreement here indicates that the production mechanisms of charmonium are not well understood, and more theoretical and experimental input is required.
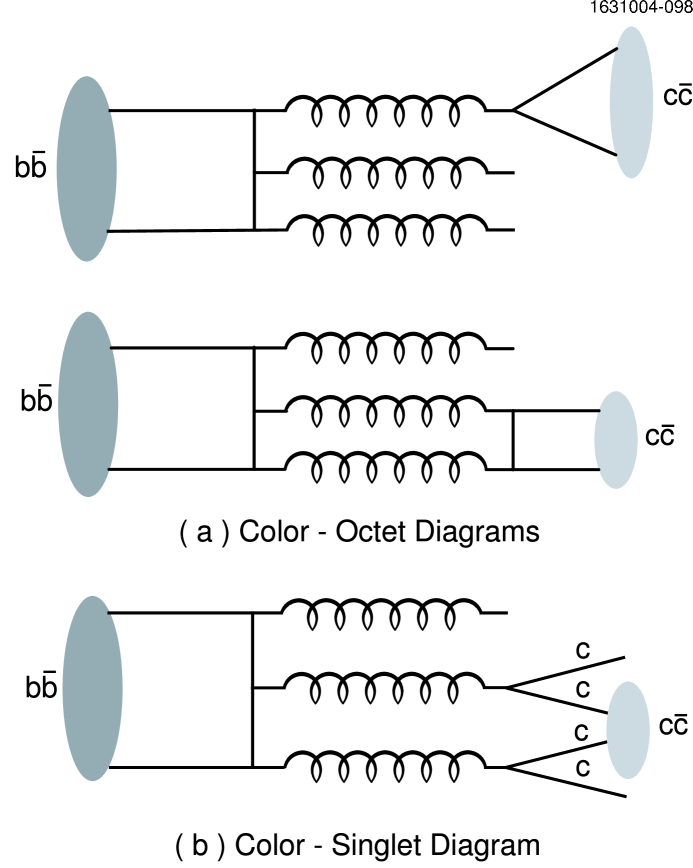
Several theoretical papers cheung_1s ; napsuciale have suggested that the study of production in decays could provide an alternate probe of the charmonium system in that the decay provides a glue-rich environment in which mesons can be produced abundantly through the color-octet mechanism. The kinematics of such ’s are expected to exhibit signatures distinct from other production mechanisms, such as a peak in the momentum spectrum near the kinematic endpoint. The predicted branching fraction from color-octet processes is napsuciale , with approximately 10% feed-down expected from and another 10% from trottier (summed over all ). Color-singlet processes, such as start at , and are therefore suppressed relative to color-octet processes which enter at . However, computations of the color-singlet process li-xie-wang indicate a sizeable branching fraction of , with about 10% coming from feed-down. The enhancement here arises because the non-perturbative color-singlet matrix element for may be 210-360 times larger than the corresponding color-octet matrix element, which is enough to compensate for the perturbative suppression. Moreover, unlike the color-octet processes, this process inherently results in a soft momentum spectrum because of the two additional charm quarks in the final state. As a result, the momentum cannot exceed about 3.3 GeV/ in this process. Therefore, while the color-octet and color-singlet processes give similar predictions for total rate, their momentum distributions are significantly different. Figure 1 shows Feynman diagrams for (a) two of the more important color-octet processes and (b) the color-singlet diagram. It should be noted that color-singlet production would also be signalled by the presence of additional charmed particles (open charm) in association with the . To capitalize on the small yield of ’s in decay, many decay channels, both inclusive and exclusive will need to be explored. We therefore relegate the search for open charm in association with in decay to a future report.
The process has been previously observed by CLEO cleo-upstojpsix , where the branching fraction was measured to be (1.10.40.2) based on 20 observed events. CLEO also reported a soft momentum spectrum for the , albeit with limited statistical precision. The ARGUS Collaboration reported an upper limit of 0.68 argus-upstojpsix at 90% confidence level.
The CLEO Collaboration has collected large data samples on the (n) resonances and currently has the world’s largest samples of , (2) and (3) decays. Consequently, CLEO is in a unique position to help clarify the roles of color-singlet and color-octet models in production.
In this paper, we present vastly improved measurements of the rate, momentum spectrum, and angular distributions in decays. We also present first observations of the decays and evidence for . The paper is organized as follows. In Section II we discuss the data samples used, the backgrounds, event selection and reconstruction. Section III details the measurement of the branching fraction and momentum spectrum in decays. This section also includes a measurement of the cross section using data on and below the resonance, which is used to estimate and subtract the continuum contribution at the . The section concludes with an examination of some event-level distributions. Section IV presents the measurement of the branching fraction. The report then discusses in Section V the measurement . For each of these analyses, we present a cross-check by measuring the corresponding branching fraction in -meson decay. Lastly, we discuss in Section VI the systematic uncertainties in each of these analyses, and the paper is concluded in Section VII.
II Data Samples, Backgrounds, Event Selection, and Reconstruction
The analysis presented here uses data collected using the CLEO III detector cleoiii . The primary data sample includes 1.2 of data collected on the , and amounts to (21.20.2) decays. For background determinations and systematic checks, we also utilize 5.0 of data on the resonance (10.4 million -meson decays) and 2.3 just below (10.56 GeV) the resonance. We also use the on- data for cross-checks on charmonium yields in -meson decays.
The backgrounds to on the are: (a) radiative Bhabha events, (b) fusion producing which subsequently produces , (c) radiative return processes such as or , and (d) continuum production (). Various event selection requirements are targeted at reducing or eliminating these backgrounds. Radiative Bhabha events produce background in the mass region when one of the hard leptons is combined with a soft lepton from the converted photon. Such events are suppressed by requiring that the invariant mass of either electron from the candidate with any other electron in the event have MeV/. Events produced through fusion typically only leave two charged tracks in the CLEO III detector, and these events are therefore easily rejected by a requirement of at least 3 charged tracks. The radiative return backgrounds are suppressed through event selection criteria which take advantage of the special kinematics of these processes, namely a low particle multiplicity coupled with either the detection of a high energy photon (4 GeV) or large missing event momentum. Events are required to have their missing event momentum magnitude, GeV/, or, if the number of charged tracks, , we require GeV/. When the high energy photon is detected (or an pair with invariant mass less than 100 MeV/), the event is vetoed if and the (converted) photon has energy greater than 3.75 GeV. The remaining background from these three sources to the signal is negligible. However, because of the small signal in , the remaining background cannot be neglected. This background is determined using the evtgen MC followed by a GEANT-based detector simulation, and the resulting contribution is subtracted from the observed yields.
Continuum background is reduced by requiring that the second Fox-Wolfram moment fox-wolfram , . The remainder of this background is estimated using data, and is statistically subtracted from the observed yields. The estimate of this background is discussed in Sections III.2 and III.5.
Candidate ’s are formed by pairing oppositely charged electron or muon candidates. These charged track candidates are required to have momentum in the range from 0.1 to 5.3 GeV/ and have at least 50% of the maximum number of expected hits in the tracking system. We also require these tracks to be consistent with coming from the interaction point in three dimensions. Electron candidates are additionally required to have a shower profile which is consistent with expectations for an electron and an energy deposition in the calorimeter, , which is compatible with its measured momentum, , by requiring . For these electron candidates, we correct for radiated photons by adding back the momentum of the highest energy photon which lies within a 5∘ cone of the initial particle direction. Muon candidates are formed using charged tracks which penetrate at least 3 hadronic interaction lengths of iron absorber in the muon chambers cleoiii .
III Measurements of
III.1 Mass Distributions in the Data
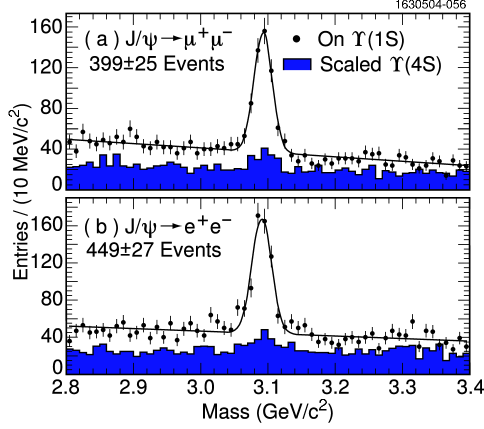
Figure 2 shows the invariant mass distribution of candidates for (a) and (b) in the on-resonance sample satisfying all selection criteria. The shaded histograms show the corresponding distributions for continuum data, scaled by a factor of 0.65, which accounts for the differences in luminosities and center of mass energies. The mass distributions from the data set are fit to the sum of a linear background and a Gaussian signal whose means and widths are allowed to float. The fitted peaks have a resolution of 13.4 MeV/ and 14.2 MeV/ for the and channels, respectively. The fitted yields are 39925 and 44927 signals events.
To study the momentum distribution, we divide the data into bins of scaled momentum, , where . Here, is the maximum momentum assuming the is recoiling against a massless particle, is the square of the center of mass energy, is the momentum of the candidate and is the mass pdg . The data are binned in intervals of . This scaled momentum variable removes the beam-energy dependence which is useful in comparing spectra on the and the . The invariant mass distributions for and for data in bins of are shown in Fig. 3 and Fig. 4, respectively. If the distribution has a sharp peak near the kinematic endpoint, there may be smearing into the region. The absence of any signal in the bin shows that all events are containe within the physically-allowed region. A simulation of the signal (see Section III.3) indicates that the widths of the invariant mass distributions are independent of momentum, and therefore these distributions are fit using a width fixed to the values obtained from the full sample.


III.2 Candidate Mass Distributions in the Data
The continuum contribution to the signal is estimated using data taken on and below the . This measurement is interesting in itself in light of the disagreement in the rates for measured by BaBaR babar_ee_jpsi and Belle belle_ee_jpsi . We employ the same event selection criteria as for the data taken on the , except that for the on- data, we require the to have momentum larger than 2 GeV/, which eliminates contributions from -meson decay.
The measured signal for below the is shown in Fig. 5 for (a) and (b) . The fitted numbers of events are 11217 () and 11619 (). The corresponding distributions for data taken on the resonance are shown in Fig. 6. The fitted yields are 13017 and 19324 events. The yields per unit luminosity are statistically compatible, after correcting the on- yield for the 2 GeV/ momentum requirement. The correction is determined from the momentum spectrum from the below- continuum and is estimated to be .


III.3 Reconstruction Efficiency
The data are corrected for geometric acceptance and analysis requirements using the pythia Monte Carlo pythia and a geant-based detector simulation geant .
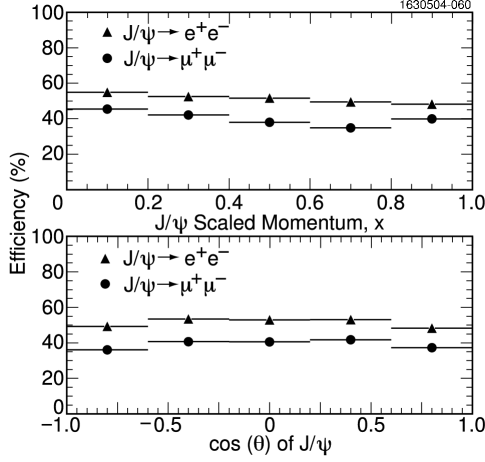
The reconstruction efficiency as a function of and , where is the polar angle of the in the lab frame, is shown in Fig. 7. The circular points are for and the triangles are for . The efficiencies decrease slightly with increasing momentum and and have average values of (402)% for and (502)% for . The small drop in efficiency with momentum is a result of not reconstructing the softer lepton which is emitted backward in the rest frame. The lower reconstruction efficiency is due to the requirement that both muons penetrate at least three layers of iron absorber, which limits the muon momentum to be larger than about 1 GeV/.
The momentum distributions of both the signal as well as the on- and below- yields are corrected using these -dependent efficiencies. This is justified since the reconstruction efficiency is not sensitive to small differences in the event environment (between and ). Continuum-produced ’s have a similar charged-track multiplicity to (7-8) and the data peak at low (see Section III.8, and figures therein) as do measurements in the continuum (see Fig.1 (c),(d) in Ref. babar_ee_jpsi ).
III.4 Corrected Momentum Distributions on and just below the Resonance
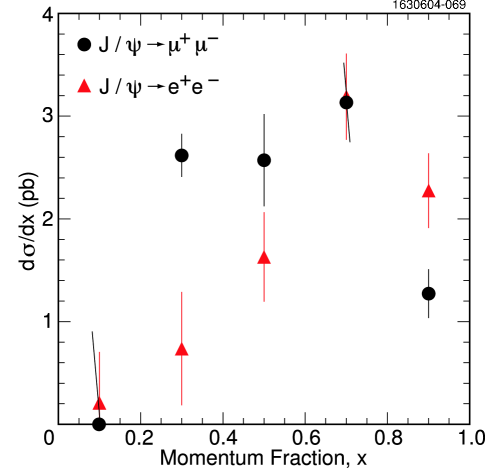
The resulting differential cross sections, , versus , are shown in Fig. 8 using the combined on- and below- data. The circles represent and the triangles are . The distributions clearly peak at large values with a mean of about 0.7. Integrating these distributions, and using =5.9% pdg , we find (stat) pb for and (stat) pb for . Combining these results we obtain (stat) pb. The results using the different lepton species are consistent with one another and lie between the BaBaR and Belle measurements of () pb and (1.470.100.13) pb, respectively. The rates found in the continuum are about a factor of 6-7 lower than on the .
III.5 Extrapolation of the results to the
The extrapolation of the differential cross section for on and below the (see Fig. 8) to the requires that we take into account the differences between these two samples, and includes two factors (other than the luminosity scaling): the ratio of partonic cross sections for and a phase space correction for producing the final state. For the former, we assume scaling, since the process proceeds through a virtual photon, and therefore the parton-level cross section at 9.46 GeV is 1.25 times larger than at 10.58 GeV. For the phase space extrapolation, we bound this factor at unity by assuming the phase space at 9.46 GeV is equal to that at 10.58 GeV. To obtain a lower bound, we assume that the ’s are always produced in association with a pair of mesons, which has a significantly reduced phase space at 9.46 GeV as compared to 10.58 GeV. Using pythia, we determine that the probability, of producing at 9.46 GeV is 55% of the corresponding value at 10.58 GeV. Using these values as extremes, and assuming that the “true” value has a flat probability of lying somewhere in that interval, we estimate the phase space ratio is . Combining the two factors, we determine the continuum extrapolation factor, .
For the momentum spectrum in decays, we are primarily interested in the shape for the gluonic intermediate states. The intermediate state, which proceeds through the coupling of the to a virtual photon, is assumed to have the same shape in as in , and therefore is more closely related to the predictions for production in the continuum. Therefore for the purposes of the momentum spectrum, we subtract the expected contribution. This contribution is included for the branching fraction measurement. Any potential interference between the continuum and the contributions is neglected. We express the rate relative to the corresponding rate for using,
| (1) |
Here, is shorthand for . The measured value for is 0.5550.022 nb shaw . In that same reference, the theoretical value for at 9.46 GeV is estimated to be 1.12 nb shaw . A more recent estimate based on the FPAIR Monte Carlo (MC) simulation kleiss gives a larger cross section of about 1.38 nb. Taking the average of these two cross sections as our central value and half their difference as the uncertainty, we obtain =1.250.13 nb. We therefore estimate that the contribution is of the at =9.46 GeV. Adding this contribution to the continuum extrapolation factor, , we obtain an overall extrapolation factor for the spectrum of .
III.6 Corrected Momentum Distributions and Branching Fractions in Data
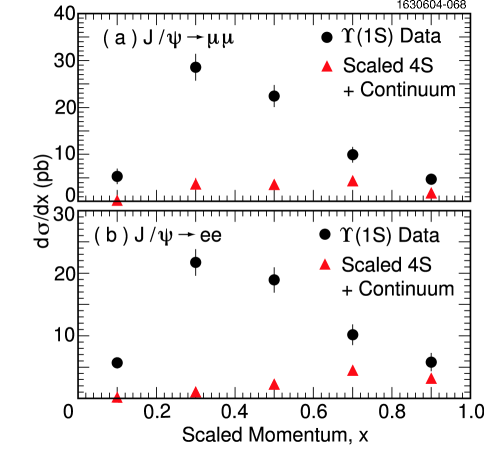
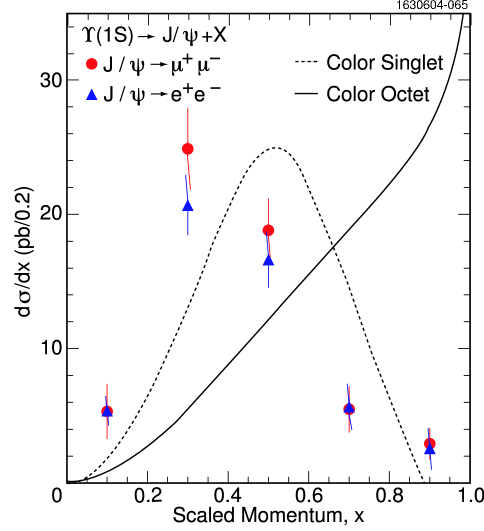
Figure 9 shows the differential cross sections in for (a) and (b) using data taken on the (solid circles) and averaged results from the data taken on and below the (triangles). The latter have been scaled as discussed above to include both the continuum and contributions. The differential cross section (versus ) for is given by the difference of these two distributions, and reflects only the contributions from gluonic intermediate states. The results are shown in Fig. 10 using (circles) and (triangles). The figure also shows the theoretical predictions of the color-octet cheung_1s (solid line) and the color-singlet li-xie-wang (dashed line) model.
The branching fraction for is computed by integrating the differential cross section distribution. We only subtract the expected continuum contribution (we use as our extrapolation factor as opposed to ), so that the branching fraction includes the three intermediate hadronic states: , and . The resulting branching fractions for the and final states are:
| (2) |
Systematic uncertainties are presented in Section VI. Using ) keV pdg , our measurement corresponds to partial widths, of () eV and () eV for the and channels, respectively.
Subtracting the expected contribution, we obtain of () eV and () eV. In other words, about 90% of the rate comes from the and intermediate states. The contribution is only expected to be at the level of about 5% cheung_1s of the rate.
Theoretical estimates of this rate based only on color-octet contributions, which neglect the intermediate state, give a total branching fraction of cheung_1s ; napsuciale . Those predictions are in good agreement with the measurements reported here. On the other hand, our measured momentum spectrum is significantly softer than predicted by the color-octet model, which is expected to peak near the kinematic limit (see Fig. 10). However, it has been recently pointed out fleming1 that in a similar process, , the non-relativistic calculations break down near the kinematic endpoint where there are large perturbative and non-perturbative corrections. These effects may be systematically treated using so-called Soft-Collinear Effecive Theory (SCET) and are expected to soften the momentum spectrum. Using SCET, the shape of the measured momentum spectrum in , which peaks near , was shown to be reproducible fleming1 . It will be interesting to see if these corrections, when applied to , can soften the color-octet predictions sufficiently to bring them into agreement with our data.
Our measured rate is also consistent with the predictions of the color-singlet process , which predicts a branching fraction of and a soft momentum spectrum which peaks at and has a kinematic limit of . While the data is somewhat softer than the color-singlet predictions, it should be noted that this is a parton-level calculation and neglects the hadronization process. Inclusion of the hadronization of the charm quarks to charm hadrons softens the momentum spectrum, with more softenining occuring as the mass of the recoiling system increases. Further softening of the momentum spectrum occurs when including the feed-down of and to . Using a pythia simulation of the color-singlet process, we are able to obtain reasonably good agreement in the region using our measured values for the feed-down from , to along with a reasonable, but arbitrary admixture of recoiling , , and states. This is not necessarily evidence for color-singlet production, but it is suggestive.
III.7 Angular Distributions in Data
Angular distributions have the potential to differentiate the mechanisms for production in collisions. Theoretical predictions for the production and helicity angle distributions for continuum production are available ee_jpsi ; ang_theory1 ; ang_theory2 , but the calculations are yet to be done for decay.
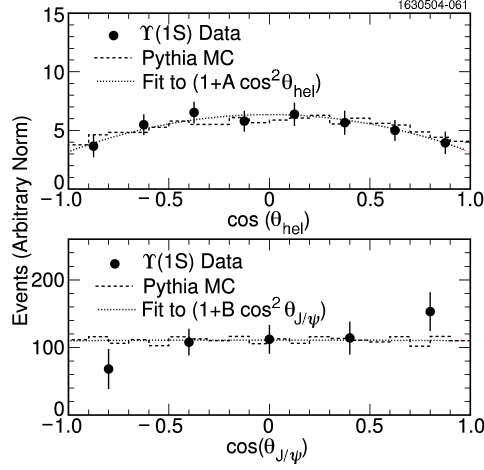
In the same spirit, we present distributions of the (polar) production angle, , of the and the helicity angle, , where is the angle between the positive lepton momentum in the rest frame and the momentum in the lab frame. The efficiency-corrected and channels are combined and shown in Fig. 11. Here, we subtract the expected and continuum contributions to extract the and shapes. The normalizations are arbitrary. The top figure shows the distribution of for data (points), pythia simulation (dashed), and a fit (dotted) to the form , from which we find (/dof=0.50). The bottom figure shows the distribution in for data (points), pythia simulation (dashed) and a fit (dotted) to the form , from which we find (/dof=1.44). The functional forms are the same as those used to describe the angular distributions for continuum production of mesons ee_jpsi ; ang_theory2 . The negative value of indicates that the has a significant longitudinal polarization component (a positive value would indicate transverse polarization). For continuum production of , the color-octet and color-singlet models differ greatly on their expectations for at large values of scaled momentum, with for the color-singlet model ang_theory2 and for the color-octet model ee_jpsi . If a large difference persists for decay, the production angle distribution could be useful in differentiating these two mechanisms. We note that the pythia simulation (using default parameters), which produces via , appears to be in reasonable agreement with data.
III.8 Event-Level Distributions
Additional information on the process can be obtained by studying various event-level distributions. We present distributions of:
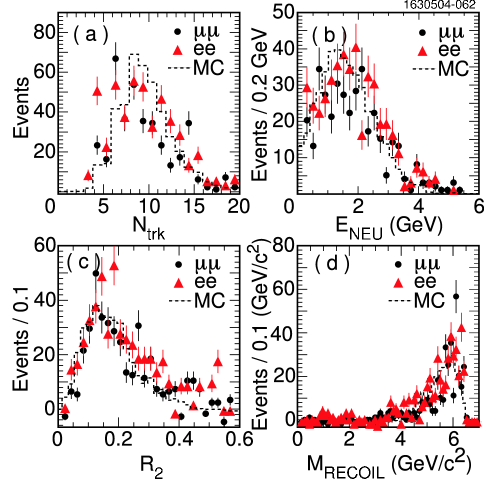
In each case, we have performed a sideband subtraction, where the signal region is defined to be from GeV/ and the sideband region includes the regions from and GeV/. The relatively small continuum contribution has not been subtracted. For each distribution, we also show the corresponding distribution from the pythia MC simulation, which primarily produces a final state which consists of . The data are shown as points ( are circles and are triangles) and the simulation is the histogram. We find that the charged particle multiplicity, which includes all charged particles, has a mean of about nine. The neutral energy, which comprises all energy in the calorimeter which is not associated with charged tracks, has an average of about () GeV, with most of the events having less than about 3.5 GeV. The Fox-Wolfram moment, , peaks at low in data which indicates that these events tend to be more spherical than collimated (jetlike). The recoil mass can be used to discern whether there is another particle recoiling against the . It is defined by:
| (3) |
where is the square of the center-of-mass energy, and and are the momentum and energy of the candidate. We do not observe any significant peaks in the recoil mass spectrum, indicating that the is usually not accompanied only by a second (bound) meson. The color-octet model predicts 1% contribution to the inclusive rate whereas the color-singlet model does not predict the fraction of recoiling charm which is in the form of charmonium.
III.9 Cross-check using
As a cross-check of our detector simulation and analysis procedure, we use the same tools to measure ) in data. The efficiencies for reconstructing in events are about 5% lower than in . In addition to the selection requirements described in Section II, we require the momentum to be less than 2.0 GeV/. The yields are corrected for the expected continuum contribution, which is typically at the level of 1-2% of the yield. The resulting branching fractions are found to be (stat))% and (stat))% for and , respectively. These results are slightly higher than the world average value of % pdg . This difference is included as a systematic uncertainty in the reconstruction efficiency.
IV Measurements of
IV.1 Measurements in Data
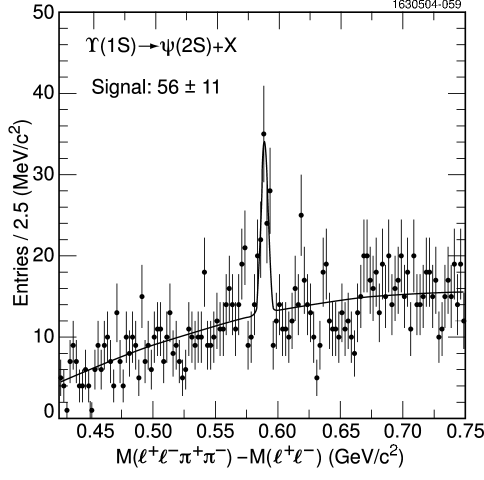
We search for using the decay mode . Pion candidates must pass the previously mentioned track selection criteria and must have a measured energy loss in the tracking chambers within four standard deviations of the expected value. Using all pairs of oppositely charged pion candidates, we compute the invariant mass difference, , a quantity which has better resolution than . We also require to be in the range from 3.00 - 3.14 GeV/. The resulting distribution for is shown in Fig. 13, where we have summed over both lepton species. The distribution is fit to the sum of a Gaussian signal shape and a second-order polynomial background. The width of the Gaussian is fixed to 2.5 MeV/, the value determined from data. The 0.3 MeV intrinsic width pdg of the is negligible compared to the detector resolution, and is therefore ignored. The fitted yield is 5611 events. The significance of the signal, , where is the fitted signal and is the estimated background, varies from , depending on whether is estimated from the sidebands or the background function.
The radiative return background, , is estimated using the evtgen evtgen simulation package and published cross sections in Ref. benayoun . The events are processed using geant and analyzed using the same analysis tools as the data. The efficiency for these events to pass a loose hadronic event selection is (1.40.1)% for decays and (8.40.6)% for decays. For these subsamples, a fraction, of decays also pass the analysis-specific selection criteria discussed in Section II. The corresponding fraction for decays is . The larger efficiency for the electron channel to pass the loose hadronic event selection results from the use of the calorimeter in defining this subsample of events. With the assumption that all data events which fail the analysis requirements are radiative return (discussed below), the expected background contribution in data from radiative return is computed using
| (4) |
where the quantity in parentheses is the ratio of simulated radiative return events which pass the analysis-specific selection to those that are rejected. The quantity is the number of rejected events in data for each lepton species. We find and in the signal region, obtained through sideband subtraction. We therefore estimate radiative return contributions of 2.01.0 events and 5.91.0 events in the and channels, respectively, and therefore a total of 7.91.4 background events from this source.
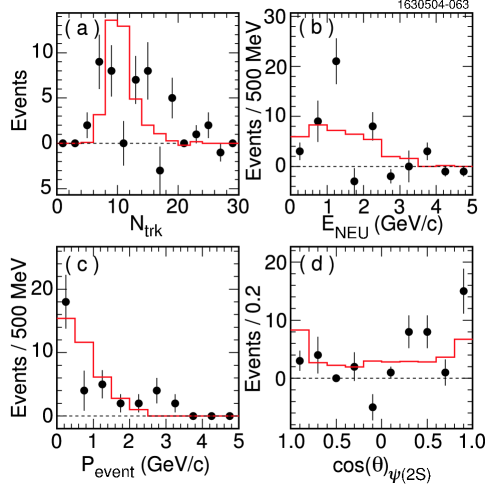
The assumption that the rejected events in data are from radiative return is supported by comparing event-level distributions of these rejected events between data and simulated radiative return events. Figure 14 shows comparisons of (a) number of reconstructed charged tracks, , (b) neutral energy in the calorimeter, , (c) missing event momentum, , and (d) the cosine of the angle between the direction and the beam axis, . In all cases, the radiative return simulation reproduces the rejected events in data, indicating that the rejected data events are mostly from radiative return.
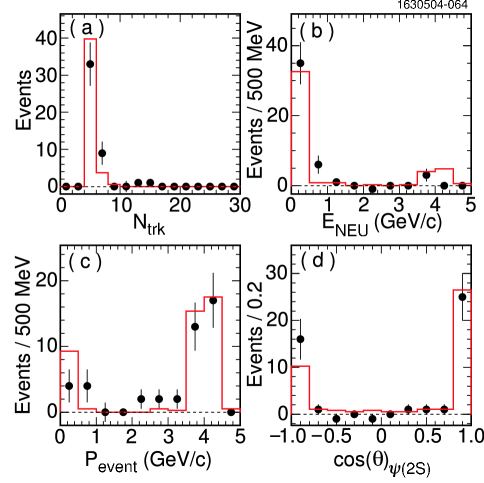
In Fig. 15 we show the analogous distributions for data (points) passing all analysis selection requirements. The corresponding distributions from a MC simulation of are overlaid (histogram). These distributions are clearly quite different than the distributions for rejected events (see Fig. 14).
The continuum background contribution is estimated using the measured cross section, , by Belle belle_ee_jpsi . The expected number of continuum background events is then given by
| (5) |
We use the integrated luminosity , and branching ratios of pdg and . The reconstruction efficiencies are determined using a pythia simulation of which is used to model the continuum as well as the signal, for the same reasons as mentioned previously. The efficiencies for both and final states are nearly independent of momentum with average values, =(171)% for and (% for . For the background extrapolation, we have assumed the same phase space suppression for as , and assign a 50% uncertainty to its value. We therefore expect a continuum background contribution of 2.51.3 and 3.41.8 events, which sum to 5.92.2 events. The error is dominated by the uncertainties in and . As a consistency check, we have searched our 2.3 continuum data sample for , and we find and 124 events in the and channels, respectively. Using the Belle cross section measurement, we would have expected and events, which is consistent with our observations.
Combining the radiative return and continuum backgrounds, we estimate a total background of 13.82.6 events. The uncertainty in the central value is included as a systematic uncertainty (see Section VI).
We now compute . To reduce systematic uncertainty, the branching fraction is computed relative to and is given by
| (6) |
where () is the total number of () signal candidates for lepton species and , () is the expected () background, and () is the average reconstruction efficiency for (). A summary of the inputs used for the branching fraction computation are presented in column 4 of Table 1. The table also shows in columns 2 and 3 the values for the and channels separately. The event yields are consistent with one another.
| Quantity | Combined () | ||
|---|---|---|---|
| 39925 | 44927 | 84837 | |
| 5311 | 6613 | 11917 | |
| (402)% | (502)% | (452)% | |
| 217 | 358 | 5611 | |
| 4.51.6 | 9.32.0 | 13.82.6 | |
| (171)% | (231)% | (201)% | |
| 0.350.15 | 0.460.15 | 0.410.11 | |
| 0.200.09 | 0.270.09 | 0.240.06 |
In Table 1, the number of background events in the data is computed using the average measured cross section for of () pb, the average efficiencies (also shown in Table 1) and the continuum extrapolation factor discussed in Section III.5. The ratio of branching fractions is computed to be:
That is, we find that the rate for is (4111)% of the rate for (systematic uncertainties are discussed in Section VI). It is interesting to note that in the continuum, Belle finds this ratio to be about 0.45 belle_ee_jpsi with about a 20% relative uncertainty. Using =(57.91.9)% pdg , we find the feed-down contribution of to to be:
This ratio is significantly higher than the expectations of either the color-octet model cheung_1s or the color-singlet model in Ref. li-xie-wang , each which predict a feed-down rate to be about 10%.
IV.2 Cross-check by measuring in Data
As a cross-check on our analysis, we measure the yield for using 10.4 million -meson decays from the data sample, and use the same simulation tools to translate this into a branching fraction. The analysis techniques are also identical, except that we additionally require the momentum of the to be less than 1.5 GeV/, which is the kinematic limit for its production in -meson decay. We find 12916 and 14418 signal events in the and channels, respectively, of which 31 and 41 events are expected from continuum background. The efficiencies are determined using generated pythia events followed by a full detector simulation, and they are found to be (182)% for the channel and (242)% for the channel. The branching fractions are measured to be for the channel and for the channel. Thus we obtain good agreement with the world average value of pdg .
V Measurements of in and Data
V.1 Measurement of )
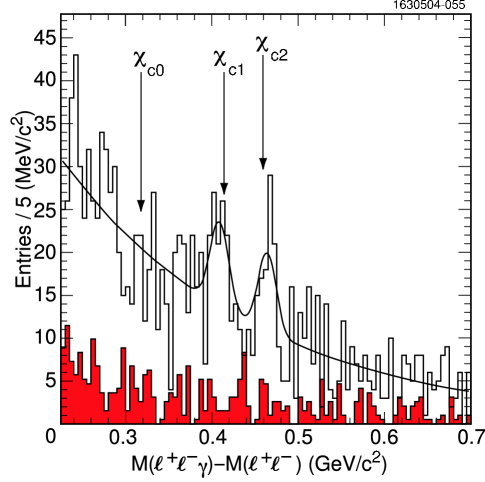
We search for by reconstructing the decay. Photon candidates are required to have energy 100 MeV, not be matched to a charged track and have a shower shape consistent with that of a photon. We also require that the invariant mass of this photon with any other photon in the event is greater than 2.5 standard deviations away from the mass of 135 MeV/ pdg . Photon candidates passing these selection criteria are combined with candidates to form a candidate. As done previously, we compute mass differences, , for candidates which have a mass in the range GeV/. From this distribution, we subtract the analogous distribution obtained from the sidebands, here defined as candidates with GeV/ or GeV/. As was done for the , we combine and average the and channels. The invariant mass difference distribution, , is shown in Fig. 16. The solid histogram is the data and the shaded histogram is the continuum, scaled by the ratio of luminosities. The data is fit using three Gaussians on top of an exponential background. The Gaussian means are restricted to lie within 5 MeV/ of the world average values of the differences between the and masses (see Table 2) pdg and the widths are constrained to the values found from simulation: 12.5 MeV/, 10.5 MeV/ and 10.3 MeV/ for . The larger width for is a result of the 16.2 MeV intrinsic width which is included in the simulation. The fitted yields are 013, 5212, and 4711 events for = 0, 1, 2, respectively. The significance of each signal is given by , where is the signal yield, and is the estimated background within 3 standard deviations of the fitted mean using the exponential background function. The significances are found to be 3.9 and 4.1 for the =1 and =2 states, respectively. The averaged efficiencies for the and channels are (271)%, (301)% and (281)% for = 0, 1, 2 states, respectively. The efficiency for reconstructing the state includes a 2% loss of signal events due to events in the tails of the Breit-Wigner. Branching fractions for are computed relative to and are tabulated in Table 2. The last column shows the measured fraction of ’s which come from feed-down, which is (113)% for the state and (102)% for the state. We only obtain upper limits on the state. Theoretical estimates of this ratio are at the level of 10% for the sum of all three states cheung_1s ; trottier . The rates we report here are higher than those expectations.
| Mode | ) | Eff.(%) | Feed-down | |||
|---|---|---|---|---|---|---|
| (MeV/) | (%) | (+) | (+) | (+) | to | |
| 318 | 1.110.15 | 013 | (271)% | 0.065 | ||
| 414 | 31.62.7 | 5212 | (301)% | 0.350.08 | 0.110.03 | |
| 459 | 20.22.0 | 4711 | (281)% | 0.520.12 | 0.100.02 |
V.2 Cross-check using in Data
As a consistency check, we measure the branching fraction for using 10.4 million decays from the data sample. We restrict the to have momentum less than 1.6 GeV/, which is the kinematic limit from -meson decay. A clear signal is found only for the state, for which the fitted yield is 34735 events. The continuum background is negligible, and is therefore neglected. The reconstruction efficiency is determined using a MC simulation, and is found to be (281)%. The branching fraction for is thus found to be , which is consistent with the PDG value of pdg . The 90% confidence level upper limit on is 1.5, which does not conflict with the measured branching fraction of (1.30.4) pdg ; chic2 .
VI Estimates of Systematic Uncertainty
VI.1 Uncertainties in
The branching fractions for using and were shown in Section III.I to be higher than the world average values by 7% for and 5% for , which is taken as the systematic uncertainty in reconstructing these decays. We ascribe an additional uncertainty due to our limited knowledge of the final state in and its modeling. This additional uncertainty is taken to be half the difference in the reconstruction efficiency obtained from our simulation and that obtained using the simulation. This results in additional contributions of 4% for and 6% for . We also include an additional 5% uncertainty in each due to limited MC statistics. We therefore estimate 9% systematic uncertainty in the reconstruction efficiency and 8% for .
The uncertainty in the signal yield is estimated by floating the Gaussian widths used in fitting each bin. We find that the signal yield changes by 3% for both the and analyses. The systematic error due to uncertainty in the shape of the background was estimated by comparing a linear background shape with an exponential. The difference is found to be 2% for and 1% for .
Systematic uncertainty in the background subtraction comes from lack of precise knowledge of the continuum cross section () and the error in the extrapolation from the energy to the energy. The latter includes uncertainties in the ratio of luminosities and the branching fraction . Our measurement of the rate for is uncertain at the level of 10% (statistical uncertainty only) and the extrapolation factor of 1.410.18 is uncertain at the level of 13%. We therefore estimate that the overall background rate is uncertain at the level of 16%. This uncertainty is propagated to an error in the branching fraction by shifting the central value for the background (see Fig. 8) up and then down by one standard deviation, and in each case, computing the change in the branching fraction from the nominal value. The corresponding shift in the branching fraction for is found to be 6% for both and , which is taken as the systematic uncertainty due to the background subtraction. The uncertainty on the background subtraction does not have a significant effect on the general shape of the momentum distribution since its contribution is only about 10% of the total.
We also include the uncertainty in the number of decays, which is estimated to be 1% based on the number of events and the uncertainty in the off-to-on luminosity ratio. We also include a 2% relative uncertainty in . The total uncertainty is therefore found to be 12% for the channel and 11% for channel.
The systematics are itemized and shown in columns 2 and 3 in Table 3.
VI.2 Uncertainties in Analysis
For the (as well as the ) analysis, many of the systematic uncertainties cancel since these measurements are reported as a ratio with respect to the branching fraction. The uncertainty in the reconstruction efficiency comes from limited MC statistics (5%) and an imperfect understanding of events. The uncertainty from the latter is taken to be the half the difference between the efficiency obtained using our default simulation and the simulation. The two simulations agree to within 1% in absolute value, which translates into an additional 5% relative systematic uncertainty in the reconstruction efficiency for each channel. We also include a systematic uncertainty of 1% per track for each of the two pions in the decay (2%). We therefore estimate that the non-cancelling systematic uncertainty in the reconstruction efficiency is 7%.
Uncertainty in the signal yield is estimated by shifting the Gaussian width up and down by 20% about the central value (2.5 MeV/) and taking half of the average deviation, which results in a 7% systematic uncertainty. Uncertainty in signal yield due to the assumed background shape was estimated by fitting the background to the alternate functional form: (the default is a second-order polynomial). The yield differs by 6%, which is taken as the associated uncertainty.
Uncertainty due to the background subtraction is estimated by considering a 50% change in the expected background contribution, which is about two standard deviations. The resulting systematic uncertainty in the branching ratio is 15%. Uncertainty in the branching fraction contributes 5%. We therefore estimate a total systematic uncertainty of 20% in the branching fraction ratio.
VI.3 Uncertainties in Analyses
The uncertainty in the efficiencies for reconstructing is taken to be half the difference in the efficiencies for reconstructing in decays at the versus in decays (8%). We include an additional uncertainty of 8% to reflect the lower value we obtain for as compared to the world average. This also accounts for any possible systematic uncertainty in the photon reconstruction efficiency. We attribute a 3% uncertainty for each due to limited MC statistics. We therefore estimate an overall systematic uncertainty in the reconstruction efficiency of the final state of 12%.
The uncertainty in the signal yield is obtained by allowing the Gaussian widths to float, from which we obtain differences of 6% and 1% for the and states. The uncertainty from the background determination is estimated by using different ranges over which to fit the background. We find maximum variations of 12%, of which we take half as the associated systematic uncertainty (6%). Since there is no evidence of any signal in the continuum, we do not consider this as a source of systematic uncertainty. Lastly, we include uncertainties in the branching fractions pdg of 20%, 10% and 11% for = 0, 1 and 2 states, respectively. We therefore estimate total systematic uncertainties of 18% for and 17% for . The uncertainty on the limits for are estimated to be 25%, and the upper limits are increased by this amount to reflect this systematic uncertainty.
Systematics uncertainties are listed and summarized in Table 3.
| Source | Value (%) | |||||
| Reconstruction efficiency | 9% | 8% | 7% | 12% | 12% | 12% |
| Signal Yield | 3% | 3% | 7% | - | 6 | 1 |
| Background Shape | 2% | 1% | 6% | - | 6 | 6 |
| Background subtraction | 6% | 6% | 15% | - | - | - |
| # decays | 1% | 1% | - | - | - | - |
| Error in | 2% | 2% | - | - | - | - |
| Error in | - | - | 5% | - | - | - |
| Error in | - | - | - | 20% | 10% | 11% |
| Total | 12 | 11 | 20 | 25 | 18 | 17 |
VII Summary
We present vastly improved measurements of the rates for production of charmonium in decays over previous measurements. We have measured both the branching fraction for and the scaled momentum distribution, as well as distributions in the polar angle and helicity in decay. We also report on first observations of the decays and evidence for .
The branching fractions for are measured in both the and channels. Their braching fractions, are measured to be and , respectively. The two are averaged to obtain:
We also measure the branching fraction relative to , and find
This report also presents the first evidence of the decay . The branching fractions for all measured modes are summarized in Table 4.
| Final state, | Feed-down to | |
| - | ||
| / | ||
| 7.4 | 0.082 | |
The branching fraction is consistent with predictions of both the color-octet mechanism for production in decays cheung_1s ; napsuciale and color-singlet production via li-xie-wang , each which predict a branching fraction at the level of 6. The observed scaled momentum spectrum is relatively soft, peaking around , in contrast to ’s produced in the continuum, which peak at about 0.7. The peaking at low momentum is in sharp contrast to the prediction of the color-octet model which predicts a peaking of near 1. It is possible that incorporation of final state interactions could improve this agreement as was shown for fleming1 . The observed spectrum is closer to, although softer than, the expectation of the color-singlet process li-xie-wang , , which peaks near 0.5. When this parton-level calculation is simulated using pythia we are able to achieve satisfactory agreement in the region when hadronization of the recoiling charm quarks into charm hadrons is included, and our measured feed-downs of and to are incorporated.
The observation of is the first to a final state other than . The feed-down to constitutes (2465)% of the inclusive rate for , which is significantly larger than expected in either the color-octet cheung_1s or color-singlet model li-xie-wang , each which predict a feed-down to at the level of 10%. Our measured rates for yield feed-down contributions of (1132)% for the =1 state and (1022)% for the =2 state, which is also larger than the expected contribution of about 10%, summed over =0, 1, and 2 cheung_1s ; trottier ; li-xie-wang .
These measurements can shed additional light on the role of the color-octet and color-singlet mechanisms in producing charmonium, not only in decays but also in and collisions. In this regard, it would be of great interest to determine whether the same softening mechanism applied to the color-octet prediction for fleming1 can account for the momentum spectrum in . Moreover, computation of the angular distributions for the color-octet and color-singlet mechanisms may provide additional discrimination between these two processes. From an experimental perspective, the additional information on the roles of color-singlet versus color-octet mechanisms may be obtained by measuring the ratio at the Tevatron. The unexpectedly large value for reported by Belle belle_ee_jpsi2 may point to a large rate in collisions as well.
We gratefully acknowledge the effort of the CESR staff in providing us with excellent luminosity and running conditions. This work was supported by the National Science Foundation, and the U.S. Department of Energy. We also thank Kingman Cheung and Wai-Yee Keung for their assistance with the color-octet predictions and Shi-yuan Li for providing color-singlet predictions.
References
- (1) J. E. Augustin et al., Phys. Rev. Lett. 33, 1406 (1974).
- (2) J. J. Aubert et al., Phys. Rev. Lett. 33, 1404 (1974).
- (3) N. Cabibbo, Phys. Rev. Lett. 10, 531 (1963); M. Kobayashi and K. Maskawa, Prog. Theor. Phys. 49, 652 (1973).
- (4) F. Abe et al. [CDF Collaboration], Phys. Rev. Lett 69, 3704 (1992); 71, 2537 (1993); 75, 1451 (1995).
- (5) E. Braaten and S. Fleming, Phys. Rev. Lett. 74, 3327 (1995) [hep-ph/9411365].
- (6) T. Affolder et al. [CDF Collaboration], Phys. Rev. Lett. 85, 2886 (2000) [hep-ex/0004027].
- (7) M. Cacciari and M. Kramer, Phys. Rev. Lett. 76, 4128 (1996) [hep-ph/9601276], and references therein.
- (8) E. Braaten and Y. Chen, Phys. Rev. Lett. 76, 730 (1996) [hep-ph/9508373].
- (9) B. Aubert et al. [BaBaR Collaboration], Phys. Rev. Lett. 87, 162002 (2001) [hep-ex/0106044].
- (10) K. Abe et al. [Belle Collaboration], Phys. Rev. Lett. 88, 052001 (2002) [hep-ex/0110012].
- (11) S. Fleming, A. Leibovich, and T. Mehen, Phys. Rev. D 68, 094011 (2003) [hep-ph/0306139].
- (12) Z. H. Lin and G. Zhu, [hep-ph/0406121].
- (13) K. Abe et al. [Belle Collaboration], Phys. Rev. Lett. 89, 142001 (2002) [hep-ex/0205104].
- (14) K. Cheung, W. Keung, and T. Yuan, Phys. Rev. D 54, 929 (1996) [hep-ph/9602423].
- (15) M. Napsuciale, Phys. Rev. D 57, 5711 (1998) [hep-ph/9710488].
- (16) H. Trottier, Phys. Rev. Lett. B 320, 145 (1994) [hep-ph/9307315].
- (17) S. Li, Q. Xie, and Q. Wang, Phys. Lett. B 482, 65 (2000) [hep-ph/9912328].
- (18) R. Fulton et al. [CLEO Collaboration], Phys. Lett. B 224, 445 (1989).
- (19) H. Albrecht et al. [ARGUS Collaboration], Z. Phys. C 55, 25 (1992).
- (20) S. Kopp et al. [CLEO Collaboration], Nucl. Instrum. Meth. A 384, 61 (1996); A. Wolf et al. [CLEO Collaboration], Nucl. Instrum. Meth. A 408, 58 (1998); G. Viehhauser et al. [CLEO Collaboration], Nucl. Instrum. Meth. A 462, 146 (2001); Y. Kubota et al. [CLEO Collaboration], Nucl. Instrum. Meth. A 320, 66 (1992).
- (21) G. C. Fox and S. Wolfram, Phys. Rev. Lett. 41, 1581 (1978).
- (22) K. Hagiwara et al., Phys. Rev. D 66, 010001 (2002) and 2003 off-year partial update for the 2004 edition available on the PDG WWW pages (URL: http://pdg.lbl.gov/).
- (23) T. Sjstrand et al., Comp. Phys. Commun. 135, 238 (2001) [hep-ph/0010017].
- (24) R. Brun et al., CERN Report Number CERN-DD/EE84-1, 1987 (unpublished).
- (25) W. Y. Chen et al. [CLEO Collaboration], Phys. Rev. D 39, 3528 (1989).
- (26) R. Kleiss and S. van der Marck, Nucl. Phys. B 342, 61 (1990).
- (27) S. Baek, P. Cho, J. Lee, and H.S. Song, J. Kor. Phys. Soc. 33, 97 (1998) [hep-ph/9804455];
- (28) P. Cho and A. K. Leibovich, Phys. Rev. D 54, 6690 (1996);
- (29) D. J. Lange, Nucl. Instrum. Meth. A 462, 152-155 (2001).
- (30) M. Benayoun et al., Mod. Phys. Lett. A 14, 2605 (1999) [hep-ph/9910523].
- (31) B. Aubert et al. [BaBaR Collaboration], Phys. Rev. D 67, 032002 (2003) [hep-ex/0207097]; K. Abe et al. [Belle Collaboration], Phys. Rev. Lett. 89, 011803 (2002) [hep-ex/0202028]; S. Chen et al. [CLEO Collaboration], Phys. Rev. D 63, 031102 (2001) [hep-ex/0010036].