Observation of
Final States from Decays and Annihilation
N. E. Adam
J. P. Alexander
K. Berkelman
D. G. Cassel
J. E. Duboscq
K. M. Ecklund
R. Ehrlich
L. Fields
R. S. Galik
L. Gibbons
B. Gittelman
R. Gray
S. W. Gray
D. L. Hartill
B. K. Heltsley
D. Hertz
L. Hsu
C. D. Jones
J. Kandaswamy
D. L. Kreinick
V. E. Kuznetsov
H. Mahlke-Krüger
T. O. Meyer
P. U. E. Onyisi
J. R. Patterson
D. Peterson
J. Pivarski
D. Riley
J. L. Rosner
On leave of absence from University of Chicago.
A. Ryd
A. J. Sadoff
H. Schwarthoff
M. R. Shepherd
W. M. Sun
J. G. Thayer
D. Urner
T. Wilksen
M. Weinberger
Cornell University, Ithaca, New York 14853
S. B. Athar
P. Avery
L. Breva-Newell
R. Patel
V. Potlia
H. Stoeck
J. Yelton
University of Florida, Gainesville, Florida 32611
P. Rubin
George Mason University, Fairfax, Virginia 22030
C. Cawlfield
B. I. Eisenstein
G. D. Gollin
I. Karliner
D. Kim
N. Lowrey
P. Naik
C. Sedlack
M. Selen
J. J. Thaler
J. Williams
J. Wiss
University of Illinois, Urbana-Champaign, Illinois 61801
K. W. Edwards
Carleton University, Ottawa, Ontario, Canada K1S 5B6
and the Institute of Particle Physics, Canada
D. Besson
University of Kansas, Lawrence, Kansas 66045
K. Y. Gao
D. T. Gong
Y. Kubota
S. Z. Li
R. Poling
A. W. Scott
A. Smith
C. J. Stepaniak
University of Minnesota, Minneapolis, Minnesota 55455
Z. Metreveli
K. K. Seth
A. Tomaradze
P. Zweber
Northwestern University, Evanston, Illinois 60208
J. Ernst
A. H. Mahmood
State University of New York at Albany, Albany, New York 12222
H. Severini
University of Oklahoma, Norman, Oklahoma 73019
D. M. Asner
S. A. Dytman
S. Mehrabyan
J. A. Mueller
V. Savinov
University of Pittsburgh, Pittsburgh, Pennsylvania 15260
Z. Li
A. Lopez
H. Mendez
J. Ramirez
University of Puerto Rico, Mayaguez, Puerto Rico 00681
G. S. Huang
D. H. Miller
V. Pavlunin
B. Sanghi
E. I. Shibata
I. P. J. Shipsey
Purdue University, West Lafayette, Indiana 47907
G. S. Adams
M. Chasse
J. P. Cummings
I. Danko
J. Napolitano
Rensselaer Polytechnic Institute, Troy, New York 12180
D. Cronin-Hennessy
C. S. Park
W. Park
J. B. Thayer
E. H. Thorndike
University of Rochester, Rochester, New York 14627
T. E. Coan
Y. S. Gao
F. Liu
Southern Methodist University, Dallas, Texas 75275
M. Artuso
C. Boulahouache
S. Blusk
J. Butt
E. Dambasuren
O. Dorjkhaidav
N. Menaa
R. Mountain
H. Muramatsu
R. Nandakumar
R. Redjimi
R. Sia
T. Skwarnicki
S. Stone
J. C. Wang
K. Zhang
Syracuse University, Syracuse, New York 13244
S. E. Csorna
Vanderbilt University, Nashville, Tennessee 37235
G. Bonvicini
D. Cinabro
M. Dubrovin
Wayne State University, Detroit, Michigan 48202
R. A. Briere
G. P. Chen
T. Ferguson
G. Tatishvili
H. Vogel
M. E. Watkins
Carnegie Mellon University, Pittsburgh, Pennsylvania 15213
(July 14, 2004)
Abstract
Using CLEO data collected from CESR collisions at the
resonance and nearby continuum at =3.67 GeV,
we report the first significantly non-zero measurements of light
vector-pseudoscalar hadron pair production (including , ,
, and ) and the
final state,
both from decays and direct annihilation.
pacs:
13.25.Gv,13.66.Bc,12.38.Qk
††preprint: CLNS 04/1884††preprint: CLEO 04-09
The puzzle poses one of the most enduring questions
in strong interaction physics: why is the branching fraction
for at least twenty PDG times smaller
than expected from scaling the rate by the ratio
of dilepton branching fractions? The “12% rule”, a scaling
conjecture generalizing this question for any
decay mode,
has as its underlying assumption that since charmonium decay
to light hadrons must proceed
through annihilation of the constituent into a photon or three
gluons, the decay width should be proportional to the square of the
wave function overlap at the origin.
The rule’s figure of merit is
(1)
where denotes a branching fraction and a particular final
state. Decays to dileptons also proceed via annihilation, and
their branching fractions are well-measured PDG ,
so their ratio makes a suitable denominator
in Eq. (1). Several channels have PDG , although some deviations
from unity are expected GULI . The mode is not alone: significant
suppressions also exist for at least one other vector-pseudoscalar
(VP) channel () and three vector-tensor
channels (, , and
) PDG ; BESVT .
The continuing struggle to understand the pattern of -values
has provoked many theoretical explanations.
For isospin-violating (IV) modes such as and
, three-gluon mediated decay is
suppressed, allowing
the electromagnetic process of annihilation into a virtual photon to dominate.
Whether remains
a crucial open question.
A recent review GULI of relevant theory and experiment
concludes that none of the proffered
theoretical explanations is satisfactory and also finds the
underpinnings of the 12% rule overly simplistic.
A major impediment to addressing the puzzle in a systematic manner
is the dearth of
branching fraction measurements.
Experimental progress on key VP final states has remained dormant
for many years. Continuum production,
, which is of interest in its own
right CONTIN ; BRODLEP ,
is expected at levels that may affect backgrounds
and will interfere WMYINTER with decay,
but has not yet been
measured. Using collision data acquired with
the CLEO detector operating at the Cornell Electron Storage Ring (CESR),
this Letter presents
branching fractions and continuum cross sections for
;
, , , , , ,
, ; .
Where applicable, the inclusion of charge conjugate states is implied.
We use , ,
, ,
and ,
,
and , and .
The CLEO III detector cleoiiidetector
features a solid angle
coverage of 93% for charged and neutral particles.
For the data presented here, the charged particle tracking system operates in a
1.0 T magnetic field along the beam axis and achieves
a momentum resolution of 0.6% at
GeV/. The cesium iodide (CsI) calorimeter attains photon
energy resolutions of 2.2% at GeV and 5% at 100 MeV.
Two particle identification systems, one based on ionization energy loss () in
the drift chamber and the other a ring-imaging Cherenkov (RICH)
detector, are used together to separate from .
The combined -RICH particle identification has
efficiencies 90% and misdentification rates 5%
for both and .
Half of the data and all
the =3.67 GeV data were taken after
a transition to CLEO-c YELLOWBOOK , in which
CLEO III’s silicon-strip vertex detector was replaced with a six-layer
all-stereo drift chamber.
The two detector configurations correspond
to different accelerator lattices: the former with
a single wiggler magnet and a center-of-mass
energy spread =1.5 MeV, the latter
(CESR-c YELLOWBOOK ) with the first
half of its full complement (12) of wiggler magnets and =2.3 MeV.
The integrated luminosity () of the datasets was measured
using
events LUMINS . Event counts were normalized with
a Monte Carlo (MC) simulation based on the Babayaga BBY event
generator combined with GEANT-based GEANT detector modeling.
The datasets have =5.63 pb-1 on the
peak of the (2.74 pb-1 for CLEO III,
2.89 pb-1 for CLEO-c) and 20.46 pb-1 at =3.67 GeV
(all CLEO-c). The scale factor applicable to continuum yields
in order to normalize them to data, , includes a
2.6% correction to the ratio
to scale it by 1/ BRODLEP ; the error includes both the
relative luminosity and form factor -dependence uncertainties.
We also correct each final state’s for small
efficiency differences between the and continuum
samples caused by detector configuration.
We base our event selection on charged particles
reconstructed in the tracking system and photon candidates in the
CsI calorimeter.
Energy and momentum conservation is
required of the reconstructed hadrons, which have momenta and
total energy .
We demand
and
(for , and ),
which together suppress
backgrounds with missing energy
or incorrect mass assignments.
The experimental resolutions are
smaller than 1% in scaled energy and 2% in scaled momentum
difference. In order to suppress hadronic transitions to , we reject
events in which any of the following fall within 3.05-3.15 GeV: the invariant mass of
the two highest momentum tracks; or the recoil mass from the lowest
momentum single , pair, or pair.
Feeddown from ,
into , , or is additionally
suppressed by requiring GeV for those channels.
MC studies were used to determine invariant mass windows for
intermediate particle decay products.
To reduce contamination from BESVT
and BESOMEGAPIPI in , we exclude
1.5 GeV. Similarly, candidates with low mass states
are avoided with GeV.
For ,
, and candidates
we use kinematically constrained fits of the decay products to the
parent masses.
Fake and mesons are suppressed with lateral shower profile
restrictions and by requiring that
their decays to not be too asymmetric.
For , , and () with ,
one of the two final state charged particles must be positively identified
as a (), but neither can be positively identified as a
(). Charged kaons in must be
identified as such, and any candidate must not be identified
as . Charged particles
must not be identified as electrons using criteria based on
momentum, calorimeter energy deposition, and
.
The softer charged particle in two-track modes
must have to suppress potential background
from in which a fake is found.
Both tracks in two-track modes must satisfy
, where is the polar
angle with respect to the direction.
The efficiency for each final state is the average obtained from MC
simulations GEANT of both detector configurations.
The VP modes are generated EVTGEN ; PHOTOS with
angular distribution BRODLEP , flat
in , and
as in decay. We assume =100%.
Background contamination from other decays is determined
from sidebands neighboring the signal windows in ,
, , , , , and
candidate mass distributions.
The sideband yields from the sample
are decremented by the corresponding number of scaled continuum events (because
scaled continuum events inside the signal window are subtracted separately)
and by the small residual signal contributions expected, and then
scaled to match the signal window size.
We normalize the branching fractions to the
total number of produced events.
The technique described in Ref. ATHAR is applied to
the datasets used here, resulting in a total number of
decays of 3.08.
Kinematic distributions are shown
in Figs. 1-4 and the event totals and efficiencies
in Table I. We observe signals for several modes
in both and continuum datasets. The
significances in the last column of Table I
reflect the likelihood that the yields
cannot be attributed to backgrounds alone.
is computed from trials in which Poisson fluctuations of the
, continuum, and cross-feed contributions are all
simulated to obtain a confidence level (CL) that a given mean
signal combined with
backgrounds would exceed or equal the observed event count.
is obtained from this procedure with =0.
Table II shows the final results. We compute branching fractions with
a straightforward subtraction of luminosity-scaled continuum yields;
the value of the true branching fraction depends on the unknown
three-gluon decay amplitudes and corresponding unknown phases.
Statistical errors shown correspond to 68% CL
and upper limits to 90% CL, and are obtained through
simulated trials as described above.
Values of are computed for each mode based on
branching fractions from Ref. PDG , except for
BESRHOPI .
Born-level cross sections at =3.67 GeV are also given
and include
an upward adjustment of 20% to account for
initial state radiation BBY .
The systematic errors on branching fractions
share common contributions from the number of
produced events (3%),
uncertainty in
(1.5%), trigger efficiency (1%), electron veto (0.5% per veto), and MC statistics (2%).
Other sources of uncertainty vary by channel; listed with their
contribution to the systematic error, they stem from cross-feed subtractions
(the change induced by 50% cross-feed variation),
accuracy of MC-generated polar angle and mass distributions
(10% for , 14% for ),
and imperfect modeling of charged particle
tracking (1% per track),
, and finding (2% per or , 5% per ),
identification (3% per identified ), and mass resolutions (2%).
Cross section systematic errors include the above contributions, substituting
an uncertainty in (3%) for the normalization error,
and accounting for uncertainties in the effects of initial and final state
radiation (7%).
Except for and , statistical errors dominate.
The results in Table II are consistent with
previous measurements PDG , where available. Unlike other VP channels,
the isospin-violating modes and are not strongly suppressed
with respect to the 12% rule, an important new
piece of the puzzle.
The ratio is found to be much smaller than
the equivalent ratio for decays, PDG .
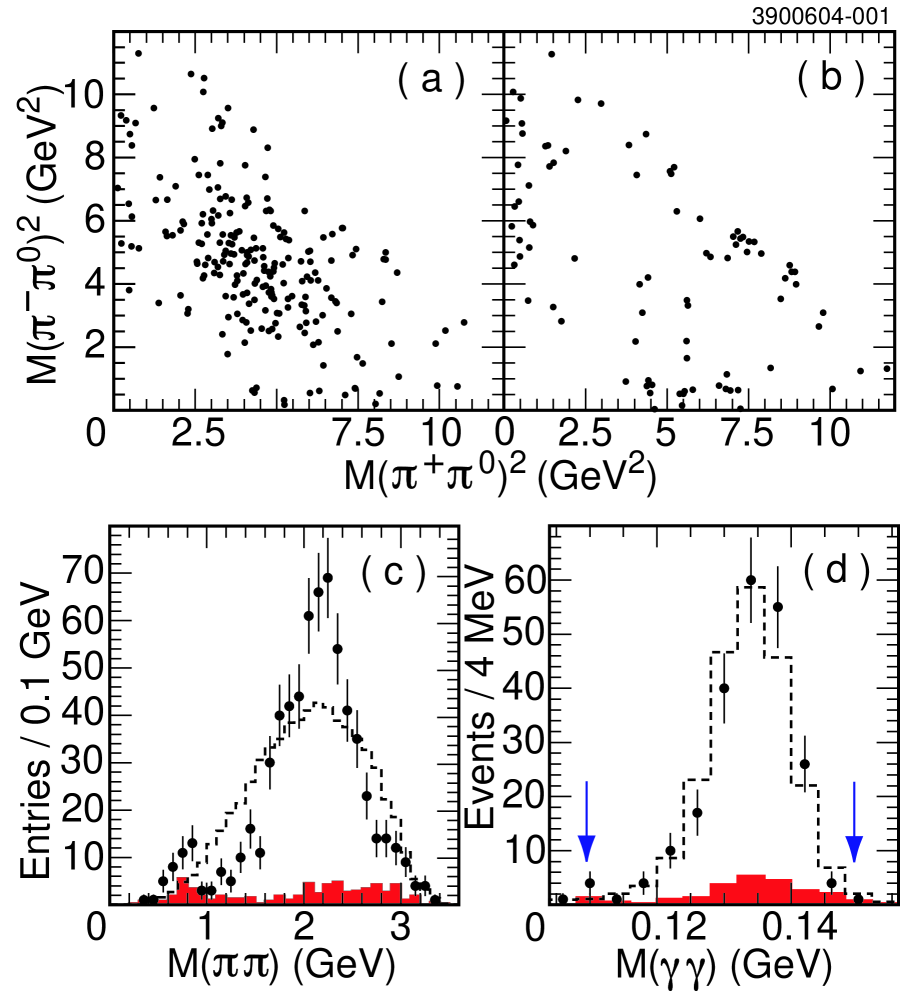
Fig. 4 shows that
decays have not only a distinct
component above the continuum contribution, but,
unlike BESRHOPI , which is dominated
by , also feature a much larger cluster of events
near the center of the Dalitz plot.
The results reported here do not account for
any cross-feed from this non- component due to
its uncertain source and shape.
If five events inside the
mass window were attributed to the higher mass structure,
the branching
fraction would decrease by a quarter and its significance by one unit.
The SU(3) expectation RATIOS for continuum cross sections is
,
in which a mixing angle satisfying
, is chosen to
describe – mixing.
With the striking exception of ,
the measured VP continuum cross sections are consistent with Born-level
calculations WMYINTER ; WMYFORM and the above ratio predictions
from SU(3). A least-squares fit for the common unit of cross
section (corresponding to ), excluding
, yields pb with
for 6 d.o.f.; exceeds
by 3.0 standard deviations.
Variations in of
induce changes of pb in .
In summary, we have presented first evidence for
decays to , , , and . Measurements for several other VP channels are also given.
The results suggest that, for VP final states, decays
through three gluons are severely suppressed with respect to the 12%
rule and the corresponding electromagnetic processes are not.
The decay exhibits a signal
but has a much larger component at higher mass.
Continuum cross sections for these final states are
presented for the first time.
We gratefully acknowledge the effort of the CESR staff
in providing us with
excellent luminosity and running conditions.
This work was supported by
the National Science Foundation and
the U.S. Department of Energy.
Note added in proof. Subsequent to the submission of
this Letter, similar results from BES BESVP
became available. After correction for
relative efficiencies and normalizations, the yields of events from and
continuum datasets in the BES analyses
are statistically consistent (within )
with those presented here.
References
(1) Particle Data Group, S. Eidelman et al.,
Phys. Lett. B 592, 1 (2004).
(2) Y.F. Gu and X.H. Li, Phys. Rev. D 63, 114019 (2001).
(3) BES Collaboration, J.Z. Bai et al., Phys. Rev. D
69 072001 (2004).
(4) P. Wang, C.Z. Yuan, and X.H. Mo, Phys. Rev. D 69,
057502 (2004).
(5) S.J. Brodsky and G.P. Lepage, Phys. Rev. D 24, 2848 (1981).
(6) P. Wang, C.Z. Yuan, and X.H. Mo, Phys. Lett. B574, 41 (2003).
(7) CLEO Collaboration,
Y. Kubota et al., Nucl. Instrum. Methods Phys. Res., Sect. A 320, 66 (1992);
D. Peterson et al., Nucl. Instrum. Methods Phys. Res., Sect. A 478, 142 (2002);
M. Artuso et al., Nucl. Instrum. Methods Phys. Res., Sect. A 502, 91 (2003).
(9) CLEO Collaboration, G. Crawford et al.,
Nucl. Instrum. Methods Phys. Res., Sect. A 345,
429 (1992).
(10) C.M. Carloni Calame et al., hep-ph/0312014 [in
Proceedings of the Workshop on Hadronic Cross Section at Low Energy
(SIGHAD03), Pisa, Italy, 2003 (to be published)].
(11) R. Brun et al., GEANT 3.21, CERN Program Library
Long Writeup W5013 (1993), unpublished.
(12) BES Collaboration, M. Ablikim et al.,
Phys. Lett. B598, 149 (2004).
(14) E. Barberio and Z. Was, Comput. Phys. Commun. 79,
291 (1994).
(15) CLEO Collaboration, S.B. Athar et al.,
Phys. Rev. D 70, 112002 (2004).
(16) BES Collaboration, J.Z. Bai et al.,
Phys. Rev. D 70, 012005 (2004).
(17) H.E. Haber and J. Perrier, Phys. Rev. D 32, 2961
(1985); L. Kopke and N. Wermes, Phys. Rep. 174, 67 (1989).
(18) P. Wang, X.H. Mo, and C.Z. Yuan, Phys. Lett. B557, 192 (2003).
(19) BES Collaboration, M. Ablikim et al.,
hep-ex/0407037; hep-ex/0408047; Phys. Rev. D 70, 112003 (2004);
70, 112007 (2004);
Table 1:
For each mode: the efficiency, ;
for =3.67 GeV data, the number of events, ,
and background from sidebands, ;
for (2S) data, the number of events, ,
the estimated continuum background, , and
background from other decays, ; and
the statistical significance of the signal in units of a Gaussian
standard deviation.
Mode
(%)
33.5
85
14
219
23.0
2.3
6
28.8
47
7
36
12.8
1.6
4.0
31.0
21
4
15
5.6
0.6
2.7
27.7
26
3
21
7.1
1.0
3.3
19.1
55
9
31
14.7
1.9
2.9
15.8
3
2
1
0.8
1.5
1
19.5
38
2
29
10.2
0.9
3.9
10.2
3
0
1
0.8
1.5
1
9.4
3
0
9
0.8
2.4
2.1
8.7
36
2
35
9.7
0.5
5.1
16.7
4
2
11
1.1
3.3
2.2
10.9
22
4
288
5.8
70.0
6
6.2
5
2
55
1.3
9.0
6
13.2
17
2
233
4.5
58.0
6
Table 2:
For each final state : the branching fraction
, with
statistical (68% CL) and systematic errors;
the upper limit (90% CL), UL, for ; from Eq. (1);
and , the Born-level cross section at =3.67 GeV.
UL
Mode
()
(pb)
239
7.01.3
38
1.50.5
17
1.71.1
27
1.40.7
44
4624
7
48
12249
11
6.1
49
2419
141
176
31
2.01.6
874
9526
346
8030
579
10933
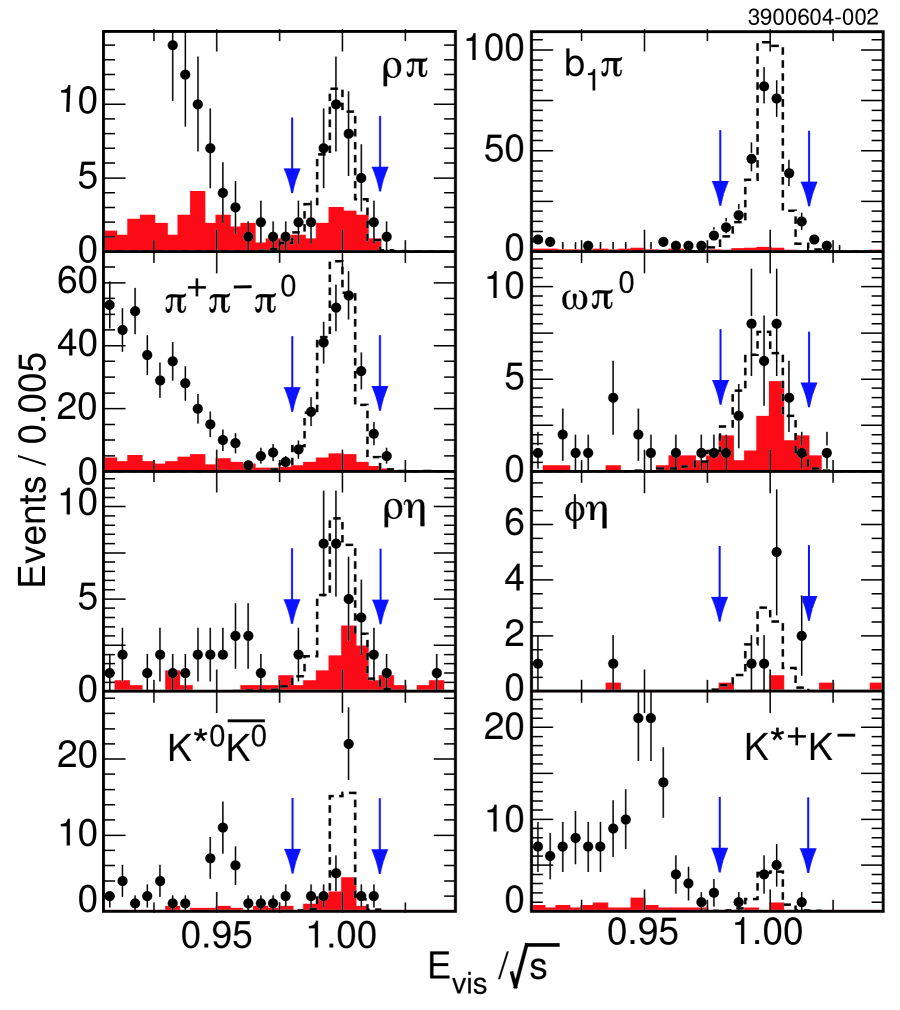
Figure 1: Distributions of scaled visible energy, , for
labeled final states.
Plots for and sum over the charged and neutral states.
Histogram entries are shown for data (points with
error bars), scaled continuum (shaded histogram), and
MC (dashed) with arbitrary normalization.
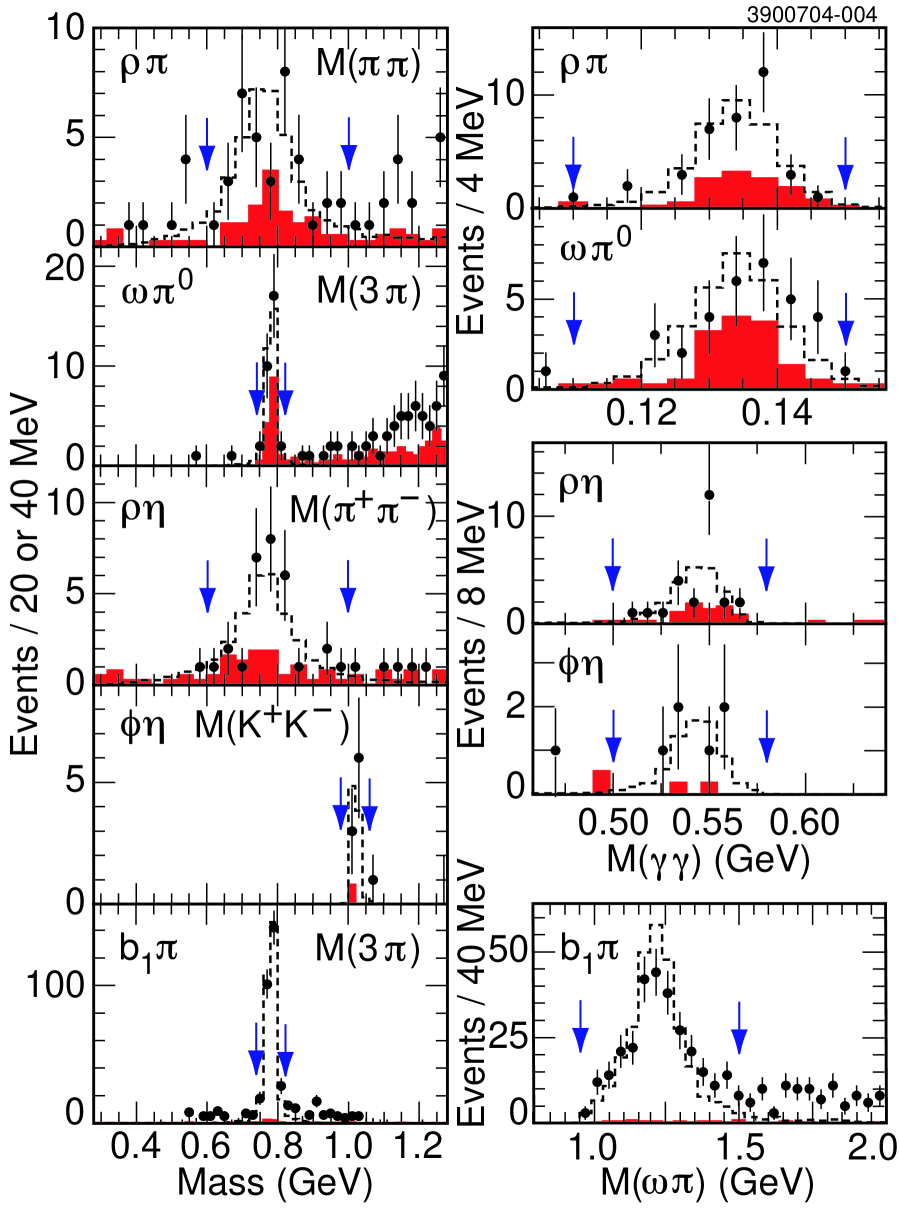
The vertical arrows mark ends of signal selection ranges.Figure 2: Invariant mass distributions relevant to the final states
indicated, one entry per event.
Symbols are defined in Fig. 1.
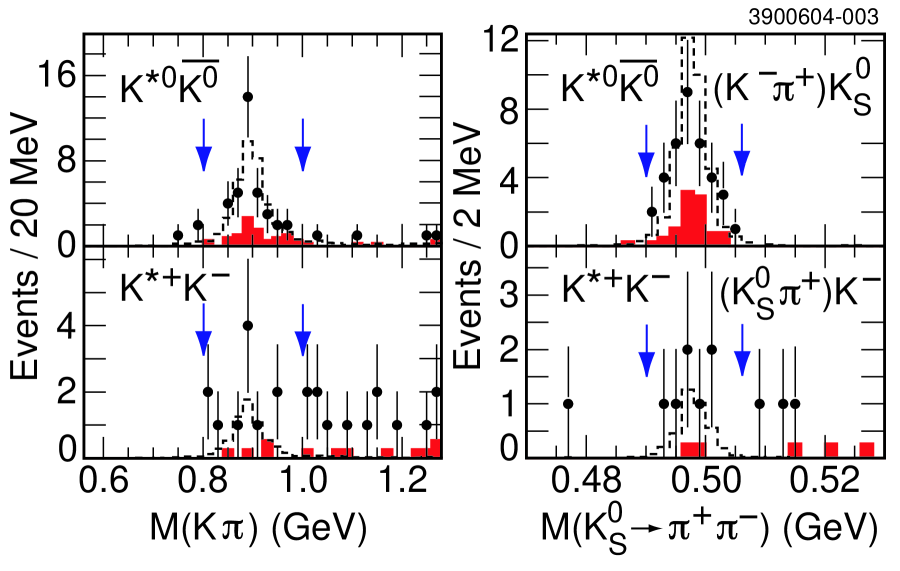
Figure 3: Invariant masses
for the (left) and (right) candidates,
one entry per event, for the final states indicated. Symbols are defined in Fig. 1.
Figure 4: Distributions for the final state:
the Dalitz plots for and continuum data;
the , , and mass combinations
(3 entries/event),
and the mass.
Symbols are defined in Fig. 1.