Observation of a threshold enhancement
in the invariant mass spectrum
M. Ablikim1, J. Z. Bai1, Y. Ban10, J. G. Bian1,
X. Cai1, J. F. Chang1, H. F. Chen16, H. S. Chen1,
H. X. Chen1, J. C. Chen1, Jin Chen1, Jun Chen6,
M. L. Chen1, Y. B. Chen1, S. P. Chi2, Y. P. Chu1,
X. Z. Cui1, H. L. Dai1, Y. S. Dai18, Z. Y. Deng1,
L. Y. Dong1, S. X. Du1, Z. Z. Du1, J. Fang1,
S. S. Fang2, C. D. Fu1, H. Y. Fu1, C. S. Gao1,
Y. N. Gao14, M. Y. Gong1, W. X. Gong1, S. D. Gu1,
Y. N. Guo1, Y. Q. Guo1, Z. J. Guo15, F. A. Harris15,
K. L. He1, M. He11, X. He1, Y. K. Heng1, H. M. Hu1,
T. Hu1, G. S. Huang1† , L. Huang6, X. P. Huang1,
X. B. Ji1, Q. Y. Jia10, C. H. Jiang1, X. S. Jiang1,
D. P. Jin1, S. Jin1, Y. Jin1, Y. F. Lai1, F. Li1,
G. Li1, H. H. Li1, J. Li1,
J. C. Li1, Q. J. Li1, R. B. Li1, R. Y. Li1,
S. M. Li1, W. G. Li1, X. L. Li7, X. Q. Li9,
X. S. Li14, Y. F. Liang13, H. B. Liao5, C. X. Liu1,
F. Liu5, Fang Liu16, H. M. Liu1, J. B. Liu1,
J. P. Liu17, R. G. Liu1, Z. A. Liu1, Z. X. Liu1,
F. Lu1, G. R. Lu4, J. G. Lu1, C. L. Luo8, X. L. Luo1,
F. C. Ma7, J. M. Ma1, L. L. Ma11, Q. M. Ma1,
X. Y. Ma1, Z. P. Mao1, X. H. Mo1, J. Nie1,
Z. D. Nie1, S. L. Olsen15, H. P. Peng16, N. D. Qi1,
C. D. Qian12, H. Qin8, J. F. Qiu1, Z. Y. Ren1,
G. Rong1, L. Y. Shan1, L. Shang1, D. L. Shen1,
X. Y. Shen1, H. Y. Sheng1, F. Shi1, X. Shi10,
H. S. Sun1, S. S. Sun16, Y. Z. Sun1, Z. J. Sun1,
X. Tang1, N. Tao16, Y. R. Tian14, G. L. Tong1,
G. S. Varner15, D. Y. Wang1, J. X. Wang1, J. Z. Wang1,
K. Wang16, L. Wang1, L. S. Wang1, M. Wang1, P. Wang1,
P. L. Wang1, S. Z. Wang1, W. F. Wang1, Y. F. Wang1,
Zhe Wang1, Z. Wang1, Zheng Wang1, Z. Y. Wang1,
C. L. Wei1, D. H. Wei3, N. Wu1, Y. M. Wu1,
X. M. Xia1, X. X. Xie1, B. Xin7, G. F. Xu1,
H. Xu1, Y. Xu1, S. T. Xue1, M. L. Yan16, F. Yang9,
H. X. Yang1, J. Yang16, S. D. Yang1, Y. X. Yang3,
M. Ye1, M. H. Ye2, Y. X. Ye16, L. H. Yi6, Z. Y. Yi1,
C. S. Yu1, G. W. Yu1, C. Z. Yuan1, J. M. Yuan1,
Y. Yuan1, Q. Yue1, S. L. Zang1, Yu. Zeng1,Y. Zeng6,
B. X. Zhang1, B. Y. Zhang1, C. C. Zhang1, D. H. Zhang1,
H. Y. Zhang1, J. Zhang1, J. Y. Zhang1, J. W. Zhang1,
L. S. Zhang1, Q. J. Zhang1, S. Q. Zhang1, X. M. Zhang1,
X. Y. Zhang11, Y. J. Zhang10, Y. Y. Zhang1, Yiyun Zhang13,
Z. P. Zhang16, Z. Q. Zhang4, D. X. Zhao1, J. B. Zhao1,
J. W. Zhao1, M. G. Zhao9, P. P. Zhao1, W. R. Zhao1,
X. J. Zhao1, Y. B. Zhao1, Z. G. Zhao1∗,
H. Q. Zheng10, J. P. Zheng1, L. S. Zheng1, Z. P. Zheng1,
X. C. Zhong1, B. Q. Zhou1, G. M. Zhou1, L. Zhou1,
N. F. Zhou1, K. J. Zhu1, Q. M. Zhu1, Y. C. Zhu1,
Y. S. Zhu1, Yingchun Zhu1, Z. A. Zhu1, B. A. Zhuang1,
B. S. Zou1.
(BES Collaboration)
1 Institute of High Energy Physics, Beijing 100039, People’s Republic of China
2 China Center for Advanced Science and Technology(CCAST), Beijing 100080,
People’s Republic of China
3 Guangxi Normal University, Guilin 541004, People’s Republic of China
4 Henan Normal University, Xinxiang 453002, People’s Republic of China
5 Huazhong Normal University, Wuhan 430079, People’s Republic of China
6 Hunan University, Changsha 410082, People’s Republic of China
7 Liaoning University, Shenyang 110036, People’s Republic of China
8 Nanjing Normal University, Nanjing 210097, People’s Republic of China
9 Nankai University, Tianjin 300071, People’s Republic of China
10 Peking University, Beijing 100871, People’s Republic of China
11 Shandong University, Jinan 250100, People’s Republic of China
12 Shanghai Jiaotong University, Shanghai 200030, People’s Republic of China
13 Sichuan University, Chengdu 610064, People’s Republic of China
14 Tsinghua University, Beijing 100084, People’s Republic of China
15 University of Hawaii, Honolulu, Hawaii 96822
16 University of Science and Technology of China, Hefei 230026, People’s Republic of China
17 Wuhan University, Wuhan 430072, People’s Republic of China
18 Zhejiang University, Hangzhou 310028, People’s Republic of China
∗ Visiting professor at the University of Michigan, Ann Arbor, MI
48109 USA
† Current address: Purdue University, West Lafayette, Indiana 47907, USA
Abstract
An enhancement near the mass threshold is observed in
the combined and invariant mass spectrum
from decays. It can be fit
with an S-wave Breit-Wigner resonance with a mass
MeV and a width of
MeV; it can also be
fit with a P-wave Breit-Wigner resonance. Evidence for a similar enhancement
is also observed in decays.
The analysis is based on samples of and
decays accumulated in the BES II detector at
the Beijing Electron-Positron Collider.
pacs:
12.39.Mk, 13.75.Ev, 12.40.Yx, 13.20.Gd
††preprint: Draft-PRL
An anomalous enhancement near the mass threshold in the
invariant mass spectrum was observed by the BES II experiment in
decays gpp . This enhancement
can be fit with an S-wave Breit-Wigner resonance function with a mass
around 1860 MeV and a width MeV, and has been interpreted
as a possible baryonium state baryonium . Similar
mass-threshold enhancements have been observed in the decays
and
by the Belle Collaboration belle_pp1 ; belle_pp2 . These somewhat
surprising experimental observations have stimulated a number of theoretical
speculations baryonium ; theory . It is, therefore, of special interest
to search for possible resonant structures in other baryon-antibaryon final
states. The Belle Collaboration recently observed a near-threshold enhancement
in the mass spectrum from
decays belle_pL . In this letter, we report the observation of
an enhancement near threshold in the invariant mass spectrum in
and in
decays. (In this letter the inclusion of charge conjugate modes is always
implied). The results are based on an analysis of
and decays detected in the upgraded Beijing
Spectrometer (BESII) at the Beijing Electron-Positron Collider (BEPC).
BESII is a large solid-angle magnetic spectrometer that is described
in detail in Ref.BESII . Charged particle momenta are determined with a
resolution of in a
40-layer cylindrical main drift chamber (MDC). Particle identification is
accomplished by specific ionization () measurements in the MDC and
time-of-flight (TOF) measurements in a barrel-like array of 48 scintillation
counters. The resolution is ; the TOF
resolution is measured to be ps for Bhabha events.
Outside of the time-of-flight counters is a 12-radiation-length barrel shower
counter (BSC) comprised of gas tubes interleaved with lead sheets.
The BSC measures the energies and directions of photons with resolutions of
, mrad,
and = 2.3 cm. The iron flux return of the magnet is instrumented
with three double layers of counters that are used to identify muons. In this
analysis, a GEANT3-based Monte Carlo (MC) package with detailed consideration
of the detector performance (such as dead electronic channels) is used. The
consistency between data and MC has been carefully checked in many high purity
physics channels, and the agreement is reasonable.
The candidate events are required to
have four charged tracks, each of which is well fitted to a helix within the
polar angle region and with a transverse momentum larger
than MeV. The total charge of the four tracks is required to be zero.
For each track, the TOF and information are combined to form particle
identification confidence levels for the and hypotheses; the
particle type of a track is assigned to be that of the hypothesis with the
largest confidence level. In this analysis, reliable identification of the
is important. To have high efficiency, it is only required that one
track be positively identified as a proton or antiproton. Events where the
and tracks are all unambiguously identified
are subjected to a four-constraint (4C) kinematic fit with the corresponding
mass assignments for each track. For events with ambiguous particle
identification, all possible 4C combinations are formed, and the combination
with the smallest is chosen. The final is required to be
less than 20. Further, the and tracks are required to originate
near the interaction point, and the invariant mass of the
combination is required to be less than GeV. To suppress background
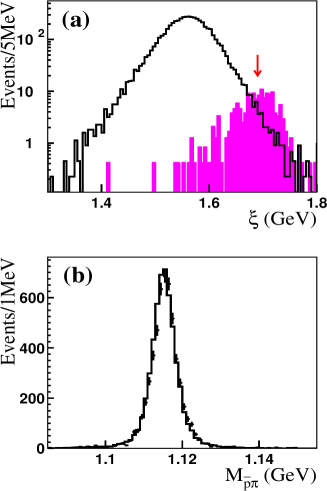
events from , we require
GeV (see Fig. 1(a)),
where denotes the difference between the center-of-mass energy
(3.097 GeV) and the total energy of the four charged tracks, and
denotes the mass recoiling against the proton-kaon system. This selection
criterion is determined by optimizing the signal to background ratio based on
Monte Carlo simulations. A sample of
candidates survive the final selection. The invariant mass
spectrum for these events, where a clear
signal is evident, is shown in Fig. 1(b).
The events are experimentally quite distinct:
they contain only charged tracks, three of which are heavy particles
(i.e., and ), and the kinematics strongly constrains the event
selection and mass assignments. In order to maintain a high selection
efficiency and reduce systematic uncertainties, positive identification of
only the proton or antiproton is required, and no requirement is placed on the
’s secondary vertex. The clean signal in the
invariant mass spectrum and good agreement with the signal from a
MC sample of events (Fig. 1(b))
indicate that the purity of the selected events is very high.
The level of background in the selected event sample was determined with two
different MC studies. One used a specific set of background processes:
; ; ;
; ; and , all
produced according to branching ratios from Particle Data Group (PDG) Tables
pdg . The fraction of these events that survive the
selection criteria corresponds to about 18
events in the selected data sample. The second study used an inclusive MC
sample of 30 million events generated according to the LUND model
chenjc . This study predicts that there are 56 background events
in the data sample. These studies indicate that the background in the
selected event sample is at the level.
Figure 1:
(a) The distribution (see text). The solid
histogram denotes
events, and the shaded histogram
events, where both histograms
are normalized to events.
Events with values below the arrow are selected.
(b) The invariant mass distribution for selected
events; points with error bars denote the data and
the histogram the MC (normalized to data).
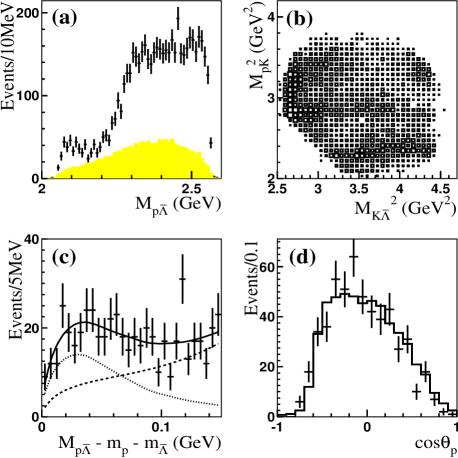
The invariant mass spectrum for the selected events is shown
in Fig. 2(a), where an enhancement is evident near the mass
threshold. No corresponding structure is seen in a sample of
MC events generated with a uniform
phase space distribution. The Dalitz plot is shown in
Fig. 2(b). In addition to bands for the well established
and , there is a significant band
near the mass threshold, and a mass
enhancement, isolated from the and bands, in the
right-upper part of the Dalitz plot.
This enhancement can be fit with an acceptance weighted S-wave Breit-Wigner
function bw , together with a function describing
the phase space contribution, as shown in Fig. 2(c),
where ,
, and the parameters and are
determined from a fit to the MC sample events generated
with a uniform phase-space distribution. The fit is confined to the
MeV mass region and
gives a peak mass of MeV and a width MeV.
The fit confidence level is ( ), and
. The no resonance hypothesis is also tested, and the fit is
much poorer: the confidence level is
(), and . This indicates that the
enhancement deviates from the shape of the phase space contribution with a
statistical significance of about .
The fit yields signal events, corresponding to
a branching ratio
where is taken from
the PDG, is the total number of
events ssfang , and is the
MC-determined signal acceptance.
Figure 2:
(a) The points with error bars indicate the measured
mass spectrum; the shaded histogram indicates
phase space MC events (arbitrary normalization).
(b) The Dalitz plot for the selected event sample.
(c) A fit (solid line) to the data. The
dotted curve indicates the Breit-Wigner signal and the
dashed curve the phase space ‘background’.
(d) The distribution under the enhancement,
the points are data and the histogram is the MC
(normalized to data)
The signal acceptance and the phase space shape are corrected
for differences between the low momentum and tracking
efficiencies for MC and data. The and tracking efficiencies
are measured with the data using a sample of
events.
A P-wave Breit-Wigner signal function (angular momentum ) also gives an
adequate fit to the data; here with a mass
MeV and a width MeV, which is consistent
with zero. Fits with higher angular momentum hypotheses fail;
such states are expected to be strongly suppressed near threshold.
The low acceptance for low momentum protons and anti-protons produces
a non-uniform acceptance across the MeV band in
the Dalitz plot (Fig. 2(b)). This is reflected in the non-uniform
distribution, where is the decay angle of p in the
CM frame, for the events in the enhancement region
( MeV), as shown in
Fig. 2(d). The distribution agrees well with that of a MC sample of
with MeV
and MeV. Since the MC distribution is
generated as a uniform S-wave distribution, but the detected MC distribution
agrees with data in Fig. 2(d), the observed distribution for the
enhancement is consistent with S-wave decays to .
Evidence of a similar enhancement is observed in
, shown in Fig. 3 (a),
when the same analysis is performed on the data sample.
A fit is applied on the data sample with the
parameters fixed at the values obtained from the data, i.e.,
MeV and MeV. The fit shows that the threshold
enhancement in data deviates from the shape of the phase space
contribution with a statistical significance of about , where the
significance is estimated from a comparison of log-likelihood values of the
fits with and without the X(2075) signal function.
Figure 3: Results for
events: (a) A fit (solid line) to the data sample (histogram);
the dashed line indicates the
phase space ‘background’ contribution.
(b)The Dalitz plot.
The possibility that the enhancement in the data sample is due
to interference between ’s and ’s has been investigated with
a partial wave analysis (PWA). The PWA results show that if the enhancement
were from a pure interference effect, many large branching ratio
decays to ’s and ’s near the kinematic threshold are required,
along with large mutual destructive interferences that cancel these large
production rates pwa . Also, the similar enhancements seen in the
data sample and in observed by the
Belle experiment cannot be due to and interference effects
since in these cases, contributions of the signal are far from the and
bands in the Dalitz plot (See Fig. 3 (b)).
Systematic uncertainties from different sources are studied. In the above fit,
the phase space contribution is treated as the ‘background’ under the
enhancement. Alternative ‘background’ shape parameters, including ’s and
’s contribution obtained from PWA fits, are used to estimate
systematic uncertainties from the ‘background’ shape. The fitting bias near
threshold is checked by MC studies. A set of MC samples combining a signal
(resonance near threshold) process with a uniform phase space process are
generated. In each MC sample, the mass, width and number of signal events are
obtained from a fit using the same procedure as that done on the data. The
averaged offsets between the fit output values and their input values are
taken as one source of systematic uncertainty (fitting bias). The systematic
uncertainty from the tracking efficiencies, especially from the low momentum
and tracks, are checked from data and MC comparisons, where the
tracking efficiencies of and are determined from a data sample of
events, and the tracking efficiencies
of charged pions is obtained from ,
events. The systematic uncertainty from the kinematic fit is
estimated by using a different MDC wire resolution simulation model.
Systematic uncertainties from other sources (such as mass resolution) are
negligible. The systematic uncertainties determined from the above studies
are listed in Table 1, and the total systematic errors on the mass,
width and branching ratios are 5 MeV, 9 MeV and respectively.
Table 1: Systematic Errors
mass(MeV)
width(MeV)
BR ()
‘Background’ shape
4
8
27.3
Fitting bias
3
3
12.6
Particle identification
3.5
Tracking efficiency
0.3
1.2
5.3
4.7
Total
5
9
33.5
In summary, an anomalous enhancement near threshold is observed in the
invariant mass spectrum of in the
and processes.
Both S-wave and P-wave Breit-Wigner resonance functions can fit the
enhancement. If it is fitted with an S-wave Breit-Wigner resonance function,
the mass is MeV, the width is
MeV, and the branching ratio is
= , where the first errors are
statistical and the second are systematic. To understand the nature of this
anomalous enhancement, searching for the same enhancement in and
modes in the processes
would help to distinguish whether it is from a conventional meson or
from a possible multi-quark state.
The BES collaboration acknowledges the staff of BEPC for their hard efforts.
This work is supported in part by the National Natural Science Foundation
of China under contracts Nos. 19991480, 10225524, 10225525, the Chinese
Academy of Sciences under contract No. KJ 95T-03, the 100 Talents Program of
CAS under Contract Nos. U-11, U-24, U-25, and the Knowledge Innovation Project
of CAS under Contract Nos. KJCX2-SW-N10, U-602, U-34 (IHEP); by the National
Natural Science Foundation of China under Contract No. 10175060 (USTC); and by
the Department of Energy under Contract No. DE-FG03-94ER40833 (U Hawaii).
References
(1) BES Collaboration, J.Z. Bai et al.,
Phys. Rev. Lett. 91, 022001 (2003).
(2)Alakabha Datta, Patrick J. O’Donnell,
Phys. Lett. B567, 273(2003).
(3) Belle Collaboration, K. Abe et al.,
Phys. Rev. Lett. 88, 181803 (2002).
(4) Belle Collaboration, K. Abe et al.,
Phys. Rev. Lett. 89, 151802 (2002).
(5) See, for example, J. Ellis, Y. Frishman and M. Karlinner,
Phys. Lett. B566, 201(2003);
J.L. Rosner, Phys. Rev. D 68, 014004 (2003);
B.S. Zou and H.C. Chiang, Phys. Rev. D 69, 034004 (2003).
(6) Belle Collaboration, M.Z. Wang et al.,
Phys. Rev. Lett. 90, 201802 (2003).
(7)BES Collaboration, J.Z. Bai et al.,
Nucl. Instr. Meth. A 458, 627 (2001).
(8)Particle Data Group, K. Hagiwara et al.,
Phys. Rev. D 66, 010001 (2002).
(9) J.C. Chen et al.,
Phys. Rev. D 62, 034003 (2000).
(10) For the Breit-Wigner function, we use the form
,
where is a constant (determined from the fit), is the
proton momentum in the frame, is the orbital
angular momentum, and is the kaon momentum.
(11) S.S. Fang et al.,
HEP & Nucl. Phys. 27, 277 (2003).
(12)
For example, from the PWA fit without X(2075), we can obtain the following
estimation (using an acceptance about ):
,
,
, where
is a new resonance and the other two are listed in the PDG.
The above production of is via P-wave decays,
and other two excited baryons can be produced via S-wave decays.