CLEO Collaboration
First Observation of a State
Abstract
We present the first evidence for the production of states in the four-photon cascade, , , , , followed by the annihilation into or . The signal has a significance of standard deviations. The measured product branching ratio for these five decays, , is consistent with the theoretical estimates. The data are dominated by the production of one state consistent with the assignment. Its mass is determined to be MeV, which is consistent with the predictions from potential models and lattice QCD calculations.
We also searched for , , followed by either or . We find no evidence for such decays and set upper limits on the product branching ratios.
pacs:
14.40.Gx, 13.20.GdLong-lived states are especially well suited for testing lattice QCD calculations LatticeQCD and effective theories of strong interactions, such as potential models PotentialModels or NRQCD NRQCD . The narrow triplet- states, , and , were discovered in 1977 in proton-nucleus collisions at Fermilab UpsilonDiscovery . Later, they were better resolved and studied at various storage rings. Six triplet- states, and with , were discovered in radiative decays of the and in 1982 chib2pdiscovery and 1983 chib1pdiscovery , respectively. There have been no observations of new narrow states since then, despite the large number of such states predicted below the open flavor threshold.
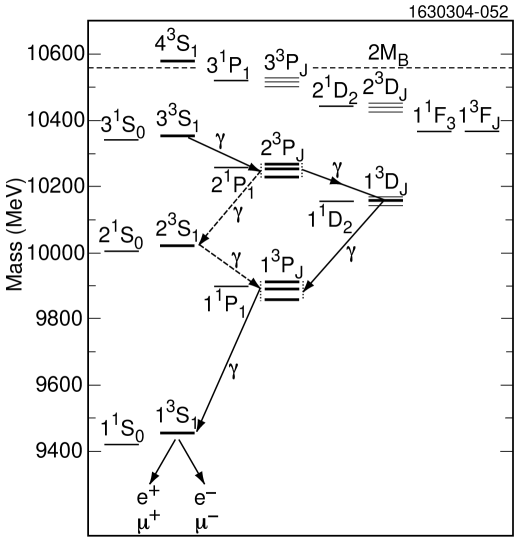
In this paper, we present the first observation of the states. They are produced in a two-photon cascade starting from the resonance: , . To suppress photon backgrounds from s, which are copiously produced in gluonic annihilation of the states, we select events with two more subsequent photon transitions, , , followed by the annihilation into either or (see Fig. 1). The product branching ratio for these five decays summing over contributions was predicted by Godfrey and Rosner GodfreyRosner to be .
The data set consists of decays observed with the CLEO III detector at the Cornell Electron Storage Ring (CESR). Charged particle tracking is done by a 47-layer drift chamber and a four-layer silicon tracker which reside in a 1.5T solenoidal magnetic field CLEOIIIDR . Photons are detected using an electromagnetic calorimeter consisting of about 8000 CsI(Tl) crystals CLEOII . The particle-identification capabilities of the CLEO III detector RICH are not used in the present analysis.
We select events with exactly four photons and two oppositely charged leptons. The leptons must have momenta of at least 3.75 GeV. We distinguish between electrons and muons by their energy deposition in the calorimeter. Electrons must have a high ratio of energy observed in the calorimeter to the momentum measured in the tracking system (). Muons are identified as minimum ionizing particles, and required to leave MeV of energy in the calorimeter. Stricter muon identification does not reduce background in the final sample, since all significant background sources contain muons. Each photon must have at least 60 MeV of energy. We also ignore all photons below 180 MeV in the calorimeter region closest to the beam because of the spurious photons generated by beam-related backgrounds. The total momentum of all photons and leptons in each event must be balanced to within 300 MeV. The invariant mass of the two leptons must be consistent with the mass within MeV.
Much better identification of the resonance is obtained by measuring the mass of the system recoiling against the four photons. The average resolution of the recoil mass is 17 MeV. The measured recoil mass is required to be within and standard deviations from the mass. The mass resolution of the produced state depends on the measurement of the energies of the two lowest energy photons in the event. Thus, we require that at least one of them is detected in the barrel part of the calorimeter, where the energy resolution is best. The selected events are dominated at this point by transitions, which have a branching ratio an order of magnitude higher than the expected signal rate. In fact, the branching ratio measured for a subsample of events in which two candidates can be formed is consistent with the previous measurements PDG . To suppress this background, we require the invariant mass for any photon pair to be at least 2 standard deviations away from the nominal mass. The sum of such two mass deviations squared must be larger than 6 for any pairing scheme.
To look for events, we constrain events to be consistent with a photon cascade from the to the via one of the and one of the states. Only or are used since the states have small decay fractions for electromagnetic transitions. For each , combination we calculate a chi-squared:
where are the measured photon energies; are the expected photon energies calculated from the known masses of the states and the measured photon directions in each event. The masses of the states are not known. Therefore, we minimize the above chi-squared with respect to which is allowed to vary for each event. The above formalism requires that we know how to order the four photons in the cascade. While the highest energy photon must be due to the fourth transition, and the second highest energy photon must be due to the third transition, there is sometimes an ambiguity in the assignment of the two lower energy photons from the first two transitions, since the range of photon energies in the decay overlaps the similar energy range in the transition. We choose the combination that minimizes the above chi-squared. There are four possible combinations of , values. We try all of them and choose the one that produces the smallest chi-squared, .
In addition to the four-photon cascade via the states, our data contain events with the four-photon cascade via the state: , , , , (see Fig. 1). The product branching ratio for this entire decay sequence (including ) is predicted by Godfrey and Rosner GodfreyRosner to be , thus comparable to the predicted production rate. In these events, the second highest energy photon is due to the second photon transition (see Fig. 1). Unfortunately, these events can sometimes be confused with the events due to our limited experimental energy resolution. The second and third photon transitions in the cascade sequence can be mistaken for the third and second transitions in the cascade sequence, respectively. Therefore, it is important to suppress the cascades. We achieve this by finding the , ( or ) combination that minimizes the associated chi-squared for the hypothesis, , where is exactly analogous to with the replaced with . We then require . Notice that the masses of all intermediate states are known for the cascade, thus this variable is more constraining than .
To further suppress the cascade events, we construct a quasi-chi-squared variable, , that sums in quadrature only positive deviations of the measured photon energies from their expected values. This variable is less sensitive than to fluctuations in the longitudinal and transverse energy leakage in photon showers that sometimes produce large negative energy deviations and correspondingly a large value. With the additional criteria and , the cross-feed efficiency for events is reduced to 0.3%, while the signal efficiency is 12%. The background cross-feed efficiency is 0.02%. Monte Carlo simulation of the signal events is based on the photon transition rate predicted for the state by Godfrey and Rosner GodfreyRosner . We use the assumption to estimate the model dependence of the signal efficiency. The proper angular distribution of the first photon in the cascade, , is taken into account, resulting in a 4% relative change of the efficiency compared to the uniform distribution. Angular correlations in the subsequent photon transitions are neglected.
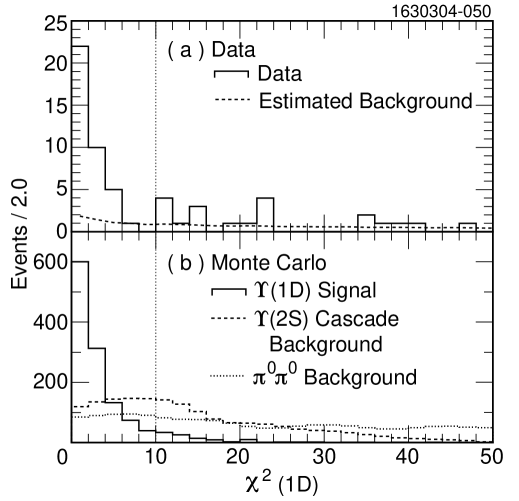
The data distribution after all these cuts is shown by the solid histogram in Fig. 2a. A narrow peak near zero is observed, just as expected for events. The signal Monte Carlo distribution for events is shown by the solid histogram in Fig. 2b. The background Monte Carlo distribution for the cascades, after a factor of 10 enhancement relative to the normalization, is also shown for comparison. The Monte Carlo distribution is shown without the veto cuts to increase the statistics. We conclude that the backgrounds cannot produce as narrow a peak as observed in the data.
After all the selection cuts, we observe 38 events in the data with . The background estimates are and and events, respectively. The errors on the background estimates include systematic effects. Feed-across from the other photon and hadronic transitions is found to be negligible. Continuum backgrounds, for example due to radiative Bhabha scattering events, were estimated to contribute events, using data taken at the resonance. After the background subtractions, the estimated signal yield is events.
An alternative background subtraction method is obtained by fitting the distribution in the range between 0 and 100 to the Monte Carlo predicted signal and background contributions. In this method the background normalization is effectively determined by the event yield observed in the tail of the distribution. The background shape is assumed to follow the Monte Carlo distribution with the veto cuts removed to increase the Monte Carlo statistics (see Fig. 2b). A linear background fit was also tried and yielded similar results. The background is fixed in this fit to the Monte Carlo simulation, normalized to the rate predicted by Godfrey and Rosner, since unlike all other backgrounds it tends to peak near the signal region. This method yields signal events with a signal efficiency of in the extended range.
The significance of the signal is evaluated from the change of likelihood between the nominal fit and when fitting the data with the background shapes alone and corresponds to 10.2 standard deviations ( for and for ). The signal product branching ratio obtained with both methods of background subtraction is the same, . Throughout this paper we quote branching ratios averaged over the and channels. The first error is statistical, while the second error is systematic. The systematic error includes uncertainty in the background subtraction (8%), model dependence of the efficiency (8%), uncertainty in the detector simulation (8%) and the number of decays (2%). This branching ratio is consistent with the theoretically estimated rate GodfreyRosner .
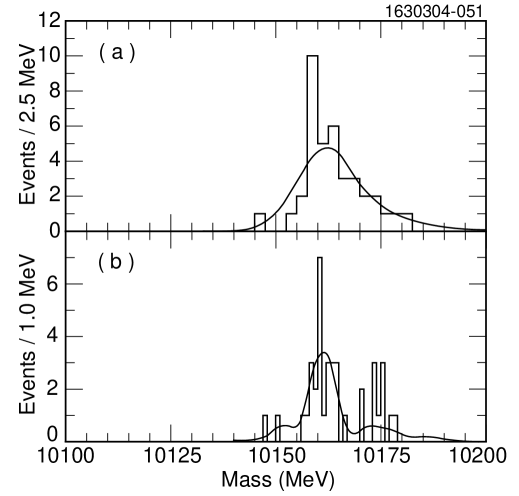
A straightforward way to measure the mass of the produced state is to calculate the mass of the system recoiling against the two lower energy photons in the event. This distribution is shown in Fig. 3a. The width of the observed peak is consistent with the detector resolution, implying the data are dominated by production of just one state. We use the signal line shape obtained from the Monte Carlo simulations to fit the data and determine the mass of this state.
Another estimate of the true mass is given by the mass value that minimizes . This distribution is shown in Fig. 3b. The data are again consistent with the single-peak hypothesis. The fit to the expected signal shape from Monte Carlo simulations is superimposed in the figure. While this method has a mass resolution of about 3 MeV, compared to a value of about 7 MeV for the missing-mass technique, the signal shape here has a complicated tail structure originating from photon energy fluctuations which can make a wrong , combination produce the smallest chi-squared value. This produces small satellite peaks on both sides of the main peak. Both methods of mass determination give consistent results. The mass of the observed state is determined to be MeV, where the first error is statistical and the second systematic. The systematic error includes the measurement method dependence ( MeV) and the mass calibration error ( MeV). The significance of a possible second peak around MeV is only 1.9 standard deviations. The recoil mass distribution discussed in the previous paragraph and shown in Fig. 3a favors no events in any second peak. Thus, we cannot claim observation of more than one state based on our data.
The minimization favors the , cascade path for most of the observed events, indicating that the observed state is either or . Theoretically, the production rate of the state is expected to be 6 times larger than for the state GodfreyRosner . Therefore, we interpret our signal as coming predominantly from the production of the . Small contributions of the and with masses close to the observed mass cannot be ruled out. However, they are impossible to quantify from our data alone without prior knowledge of the fine-structure mass splitting.
The measured mass is in good agreement with the mass of the state predicted by lattice QCD calculations LatticeQCD and those potential models which also give a good fit to the other known states lp03-skwa . All potential model calculations predict the mass to be between and MeV lower than the center-of-gravity (c.o.g.) mass for this triplet. Adding this theoretical input to our results, we obtain MeV for the c.o.g. mass, where we assigned an additional uncertainty of 1 MeV to the correction for the c.o.g. mass difference.
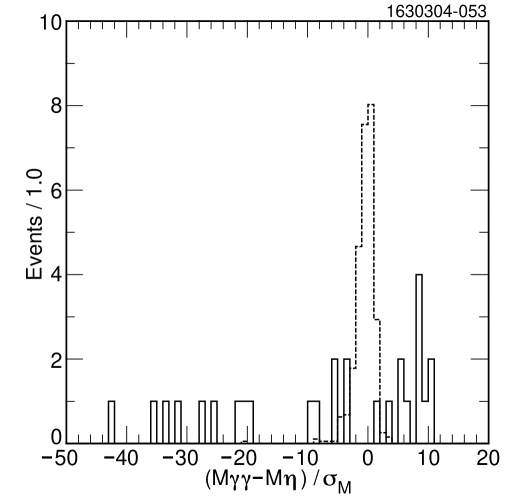
Voloshin recently suggested that the transition could be enhanced in decays VoloshinEta . Since the often decays to two photons, we can look for it in the same sample preselected for the four-photon cascade analysis. We reverse the cut () to suppress the four-photon cascades via the states. Otherwise they would contribute a smooth background to our search variable (defined below). Since we still want the two-photon cascade to produce a state via , , we require that one of the two lowest energy photons fits the transition ( MeV). Because the backgrounds are small, we did not constrain the second photon energy and therefore we did not restrict the sample to any particular value of mass. The signal efficiency is 13% (not including ). To search for the eta we analyze the invariant mass distribution for the two most energetic photons. The distribution of for the data is shown in Fig. 4, where is the expected mass resolution. No signal is observed. To estimate the upper limit we fit this distribution with the eta line shape and a smooth approximation for the background obtained from the Monte Carlo simulations. The corresponding 90% C.L. upper limit on the product branching ratio is: or if we use the world average value for PDG . A systematic error of 8.3% is included by scaling up the upper limit by one unit of the systematic error. Dividing the estimated upper limit by the measured product branching ratio for the four-photon cascade, we obtain: (at 90% C.L.). Common systematic errors were taken out in this calculation.
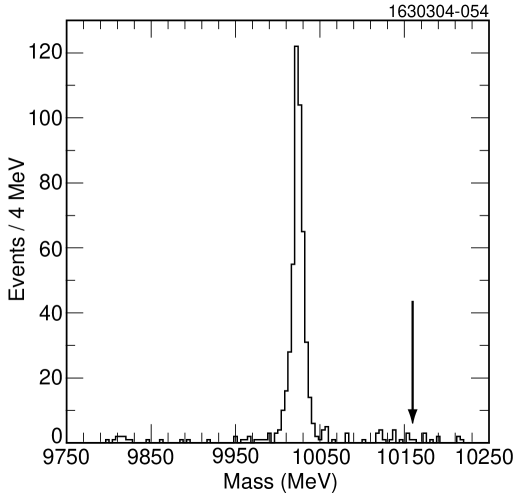
Predictions for the branching ratio of vary by orders of magnitude among various theoretical predictions (from to ) 1dpipi . To look for these transitions, we selected events using similar selection cuts to our analysis. After requiring the di-lepton mass and the recoil mass against the to be consistent with the mass, and checking that the total momentum of the event is consistent with zero, we require at least one photon to have an energy in the MeV range, corresponding to the transition. We then measure the mass of the intermediate state, assuming that it is produced by the two-photon cascade. This mass can be estimated by using either the photons or the pions. To get the best estimate, we average the two mass estimates by giving them weights inversely proportional to the mass resolution squared, as determined by Monte Carlo simulations. The weights are 40% for the recoil mass, and 60% for the mass obtained using . The signal efficiency is 19%. The resulting mass distribution is shown in Fig. 5. The prominent peak observed in the data is due to , , . From a fit to this peak, we determine the product branching ratio for this decay signal to be times the value derived from the individually measured transition rates PDG . This provides a good check for our detection efficiency.
There is no indication of any excess of events at the mass value observed in our four-photon cascade analysis. To estimate an upper limit on the signal rate, we fit the data with a signal fixed at our observed mass and a smooth background parameterized by a cubic polynomial. The following limits (90% C.L.) are obtained: or . Dividing our upper limit by the measured rate for the four-photon cascade we obtain: (at 90% C.L.). We also set an upper limit for the production of any state (followed by decay) with a mass in the MeV range, which comfortably covers the predicted size of fine-structure splitting for the triplet GodfreyRosner . Here, we do not try to subtract backgrounds and accept all 9 events observed in this mass range as signal candidates. This results in the following upper limits: or for a sum over all different values.
These upper limits are inconsistent (lower by a factor of about 7) with the rate estimated by Rosner 1dpipi using the Kuang-Yan model for 1dpipi-KY and a factor of about 3 higher than the predicted rate based on the model by Ko 1dpipi-K . Our upper limits are about 30 times higher than those predicted by Moxhay’s model 1dpipi-M .
In summary, we present the first significant evidence for the production of the states in the four-photon cascade . The data are dominated by the production of one state, consistent with the assignment. Its mass is determined to be MeV, in agreement with the potential models and lattice QCD calculations. The measured product branching ratio, , is consistent with the theoretical estimate, especially when comparing with the predicted rate for the state alone, GodfreyRosner .
We have also searched for , followed by either or . We find no evidence for such decays and set upper limits on the product branching ratios. The latter are inconsistent with the Kuang-Yan model which predicts a large width.
We gratefully acknowledge the effort of the CESR staff in providing us with excellent luminosity and running conditions. This work was supported by the National Science Foundation, the U.S. Department of Energy, the Research Corporation, and the Texas Advanced Research Program.
References
- (1) P. Lepage and C. Davies, Proceedings of the International Lepton-Photon Conference 2003; S. Gottlieb, Proceedings of the Lattice Conference 2003, arXiv:hep-lat/0310041 and references therein.
- (2) For reviews see e.g. D. Besson and T. Skwarnicki, Annu. Rev. Nucl. Part. Sci. 43, 333 (1993); E. Eichten and C. Quigg, Phys. Rev. D49, 5845 (1994).
- (3) W.E. Caswell and G.P. Lepage, Phys. Lett. B167, 437 (1986); B.A. Thacker and G.P. Lepage, Phys. Rev. D43, 196 (1991); G.T. Bodwin, E. Braaten and G.P. Lepage, Phys. Rev. D51, 1125 (1995); erratum D55, 5853 (1997); N. Brambilla, A. Pineda, J. Soto and A. Vairo, Nucl. Phys. B566, 275 (2000).
- (4) S.W. Herb et al., Phys. Rev. Lett. 39 (1977) 252; W.R. Innes et al., Phys. Rev. Lett. 39, 1240 (1977); erratum 39, 1640 (1977).
- (5) K. Han et al. (CUSB Collaboration), Phys. Rev. Lett. 49, 1612 (1982); G. Eigen et al. (CUSB Collaboration), Phys. Rev. Lett. 49, 1616 (1982).
- (6) C. Klopfenstein et al. (CUSB Collaboration), Phys. Rev. Lett. 51, 160 (1983); F. Pauss et al. (CUSB Collaboration), Phys. Lett. B 130, 439 (1983).
- (7) S. Godfrey and J.L. Rosner, Phys. Rev. D64, 097501 (2001); erratum D66 059902 (2002); see also W. Kwong and J.L. Rosner, Phys. Rev. D38, 279 (1988).
- (8) D. Peterson et al. Nucl. Instr. Meth. A 478, 142 (2002).
- (9) Y. Kubota et al. (CLEO Collaboration) Nucl. Instr. Meth. A 320, 66 (1992).
- (10) M. Artuso et al. Nucl. Instr. Meth. A 502, 91 (2003).
- (11) K. Hagiwara et al. (PDG), Phys. Rev. D66, 010001 (2002).
- (12) For a summary see T. Skwarnicki, Proceedings of the International Lepton-Photon Conference 2003; arXiv:hep-ph/0311243.
- (13) M.B. Voloshin, Phys. Lett. B562, 68 (2003); arXiv:hep-ph/0302261.
- (14) J.L. Rosner, Phys. Rev. D67, 097504 (2003).
- (15) Y.-P. Kuang and T.-M. Yan, Phys. Rev. D24, 2874 (1981).
- (16) P. Ko, Phys. Rev. D47, 208 (1993).
- (17) P. Moxhay, Phys. Rev. D37, 2557 (1988).