EUROPEAN ORGANIZATION FOR NUCLEAR RESEARCH
CERN-PH-EP/2004-008
24th March 2004
Study of Bose-Einstein Correlations in Events at LEP
The OPAL Collaboration
Bose-Einstein correlations between like-sign charged-particle pairs in events recorded with the OPAL detector at LEP at centre-of-mass energies between 183 GeV and 209 GeV are studied. Recently proposed methods which allow direct searches for correlations in the data via distributions of test variables are used to investigate the presence of correlations between hadrons originating from different W bosons in events. Within the statistics of the data sample no evidence for inter–WW Bose-Einstein correlations is obtained. The data are also compared with predictions of a recent implementation of Bose-Einstein correlation effects in the Monte Carlo model Pythia.
Submitted to European Physical Journal C
G. Abbiendi2, C. Ainsley5, P.F. Åkesson3,y, G. Alexander22, J. Allison16, P. Amaral9, G. Anagnostou1, K.J. Anderson9, S. Asai23, D. Axen27, G. Azuelos18,a, I. Bailey26, E. Barberio8,p, T. Barillari32, R.J. Barlow16, R.J. Batley5, P. Bechtle25, T. Behnke25, K.W. Bell20, P.J. Bell1, G. Bella22, A. Bellerive6, G. Benelli4, S. Bethke32, O. Biebel31, O. Boeriu10, P. Bock11, M. Boutemeur31, S. Braibant8, L. Brigliadori2, R.M. Brown20, K. Buesser25, H.J. Burckhart8, S. Campana4, R.K. Carnegie6, A.A. Carter13, J.R. Carter5, C.Y. Chang17, D.G. Charlton1, C. Ciocca2, A. Csilling29, M. Cuffiani2, S. Dado21, A. De Roeck8, E.A. De Wolf8,s, K. Desch25, B. Dienes30, M. Donkers6, J. Dubbert31, E. Duchovni24, G. Duckeck31, I.P. Duerdoth16, E. Etzion22, F. Fabbri2, L. Feld10, P. Ferrari8, F. Fiedler31, I. Fleck10, M. Ford5, A. Frey8, P. Gagnon12, J.W. Gary4, G. Gaycken25, C. Geich-Gimbel3, G. Giacomelli2, P. Giacomelli2, M. Giunta4, J. Goldberg21, E. Gross24, J. Grunhaus22, M. Gruwé8, P.O. Günther3, A. Gupta9, C. Hajdu29, M. Hamann25, G.G. Hanson4, A. Harel21, M. Hauschild8, C.M. Hawkes1, R. Hawkings8, R.J. Hemingway6, G. Herten10, R.D. Heuer25, J.C. Hill5, K. Hoffman9, D. Horváth29,c, P. Igo-Kemenes11, K. Ishii23, H. Jeremie18, P. Jovanovic1, T.R. Junk6,i, N. Kanaya26, J. Kanzaki23,u, D. Karlen26, K. Kawagoe23, T. Kawamoto23, R.K. Keeler26, R.G. Kellogg17, B.W. Kennedy20, S. Kluth32, K. Klein11,a1, T. Kobayashi23, M. Kobel3, S. Komamiya23, T. Krämer25, T. Kress14, P. Krieger6,l, J. von Krogh11, K. Kruger8, T. Kuhl25, M. Kupper24, G.D. Lafferty16, H. Landsman21, D. Lanske14, J.G. Layter4, D. Lellouch24, J. Lettso, L. Levinson24, J. Lillich10, S.L. Lloyd13, F.K. Loebinger16, J. Lu27,w, A. Ludwig3, J. Ludwig10, W. Mader3, S. Marcellini2, A.J. Martin13, G. Masetti2, T. Mashimo23, P. Mättigm, J. McKenna27, R.A. McPherson26, F. Meijers8, W. Menges25, F.S. Merritt9, H. Mes6,a, N. Meyer25, A. Michelini2, S. Mihara23, G. Mikenberg24, D.J. Miller15, S. Moed21, W. Mohr10, T. Mori23, A. Mutter10, K. Nagai13, I. Nakamura23,v, H. Nanjo23, H.A. Neal33, R. Nisius32, S.W. O’Neale1,∗, A. Oh8, M.J. Oreglia9, S. Orito23,∗, C. Pahl32, G. Pásztor4,g, J.R. Pater16, J.E. Pilcher9, J. Pinfold28, D.E. Plane8, B. Poli2, O. Pooth14, M. Przybycień8,n, A. Quadt3, K. Rabbertz8,r, C. Rembser8, P. Renkel24, J.M. Roney26, Y. Rozen21, K. Runge10, K. Sachs6, T. Saeki23, E.K.G. Sarkisyan8,j, A.D. Schaile31, O. Schaile31, P. Scharff-Hansen8, J. Schieck32, T. Schörner-Sadenius8,z, M. Schröder8, M. Schumacher3, W.G. Scott20, R. Seuster14,f, T.G. Shears8,h, B.C. Shen4, P. Sherwood15, A. Skuja17, A.M. Smith8, R. Sobie26, S. Söldner-Rembold15, F. Spano9, A. Stahl3,x, D. Strom19, R. Ströhmer31, S. Tarem21, M. Tasevsky8,s, R. Teuscher9, M.A. Thomson5, E. Torrence19, D. Toya23, P. Tran4, I. Trigger8, Z. Trócsányi30,e, E. Tsur22, M.F. Turner-Watson1, I. Ueda23, B. Ujvári30,e, C.F. Vollmer31, P. Vannerem10, R. Vértesi30,e, M. Verzocchi17, H. Voss8,q, J. Vossebeld8,h, C.P. Ward5, D.R. Ward5, P.M. Watkins1, A.T. Watson1, N.K. Watson1, P.S. Wells8, T. Wengler8, N. Wermes3, G.W. Wilson16,k, J.A. Wilson1, G. Wolf24, T.R. Wyatt16, S. Yamashita23, D. Zer-Zion4, L. Zivkovic24
1School of Physics and Astronomy, University of Birmingham,
Birmingham B15 2TT, UK
2Dipartimento di Fisica dell’ Università di Bologna and INFN,
I-40126 Bologna, Italy
3Physikalisches Institut, Universität Bonn,
D-53115 Bonn, Germany
4Department of Physics, University of California,
Riverside CA 92521, USA
5Cavendish Laboratory, Cambridge CB3 0HE, UK
6Ottawa-Carleton Institute for Physics,
Department of Physics, Carleton University,
Ottawa, Ontario K1S 5B6, Canada
8CERN, European Organisation for Nuclear Research,
CH-1211 Geneva 23, Switzerland
9Enrico Fermi Institute and Department of Physics,
University of Chicago, Chicago IL 60637, USA
10Fakultät für Physik, Albert-Ludwigs-Universität
Freiburg, D-79104 Freiburg, Germany
11Physikalisches Institut, Universität
Heidelberg, D-69120 Heidelberg, Germany
12Indiana University, Department of Physics,
Bloomington IN 47405, USA
13Queen Mary and Westfield College, University of London,
London E1 4NS, UK
14Technische Hochschule Aachen, III Physikalisches Institut,
Sommerfeldstrasse 26-28, D-52056 Aachen, Germany
15University College London, London WC1E 6BT, UK
16Department of Physics, Schuster Laboratory, The University,
Manchester M13 9PL, UK
17Department of Physics, University of Maryland,
College Park, MD 20742, USA
18Laboratoire de Physique Nucléaire, Université de Montréal,
Montréal, Québec H3C 3J7, Canada
19University of Oregon, Department of Physics, Eugene
OR 97403, USA
20CCLRC Rutherford Appleton Laboratory, Chilton,
Didcot, Oxfordshire OX11 0QX, UK
21Department of Physics, Technion-Israel Institute of
Technology, Haifa 32000, Israel
22Department of Physics and Astronomy, Tel Aviv University,
Tel Aviv 69978, Israel
23International Centre for Elementary Particle Physics and
Department of Physics, University of Tokyo, Tokyo 113-0033, and
Kobe University, Kobe 657-8501, Japan
24Particle Physics Department, Weizmann Institute of Science,
Rehovot 76100, Israel
25Universität Hamburg/DESY, Institut für Experimentalphysik,
Notkestrasse 85, D-22607 Hamburg, Germany
26University of Victoria, Department of Physics, P O Box 3055,
Victoria BC V8W 3P6, Canada
27University of British Columbia, Department of Physics,
Vancouver BC V6T 1Z1, Canada
28University of Alberta, Department of Physics,
Edmonton AB T6G 2J1, Canada
29Research Institute for Particle and Nuclear Physics,
H-1525 Budapest, P O Box 49, Hungary
30Institute of Nuclear Research,
H-4001 Debrecen, P O Box 51, Hungary
31Ludwig-Maximilians-Universität München,
Sektion Physik, Am Coulombwall 1, D-85748 Garching, Germany
32Max-Planck-Institute für Physik, Föhringer Ring 6,
D-80805 München, Germany
33Yale University, Department of Physics, New Haven,
CT 06520, USA
a and at TRIUMF, Vancouver, Canada V6T 2A3
c and Institute of Nuclear Research, Debrecen, Hungary
e and Department of Experimental Physics, University of Debrecen,
Hungary
f and MPI München
g and Research Institute for Particle and Nuclear Physics,
Budapest, Hungary
h now at University of Liverpool, Dept of Physics,
Liverpool L69 3BX, U.K.
i now at Dept. Physics, University of Illinois at Urbana-Champaign,
U.S.A.
j and Manchester University
k now at University of Kansas, Dept of Physics and Astronomy,
Lawrence, KS 66045, U.S.A.
l now at University of Toronto, Dept of Physics, Toronto, Canada
m current address Bergische Universität, Wuppertal, Germany
n now at University of Mining and Metallurgy, Cracow, Poland
o now at University of California, San Diego, U.S.A.
p now at The University of Melbourne, Victoria, Australia
q now at IPHE Université de Lausanne, CH-1015 Lausanne, Switzerland
r now at IEKP Universität Karlsruhe, Germany
s now at University of Antwerpen, Physics Department,B-2610 Antwerpen,
Belgium; supported by Interuniversity Attraction Poles Programme – Belgian
Science Policy
u and High Energy Accelerator Research Organisation (KEK), Tsukuba,
Ibaraki, Japan
v now at University of Pennsylvania, Philadelphia, Pennsylvania, USA
w now at TRIUMF, Vancouver, Canada
x now at DESY Zeuthen
y now at CERN
z now at DESY
a1 now at RWTH Aachen, Germany
∗ Deceased
1 Introduction
Bose-Einstein correlations (BEC) between identical bosons are a well-known phenomenon in high energy physics [1]. BEC are often considered to be the analogue of the Hanbury Brown and Twiss effect [2] in astronomy, describing the interference of identical bosons emitted incoherently. However, alternative models exist such as that proposed by B. Andersson et al. [3], which includes a coherent particle production mechanism in the framework of the Lund string model [4].
BEC lead to an enhancement of the production of identical bosons close in phase space. First reported for pairs of charged pions produced in hadron-hadron collisions [5], BEC have been studied for systems of two or more identical bosons produced in various types of collisions, and in particular in hadronic decays from annihilation at LEP (see [6, 7, 8, 9] and references therein).
At LEP, BEC have been unambiguously established between the particles originating from one hadronically decaying W, representing so-called intra–W BEC [10, 11]. The aim of this paper is to search for evidence of BEC between the particles originating from different W bosons, i.e. for inter–WW BEC in events. A recent L3 study [11] using the same method [12] as we use here shows no evidence for inter–WW BEC.
Two hadronically decaying W bosons provide a unique opportunity to study two partially overlapping hadronic systems allowing this important aspect of BEC to be explored [13]. The typical separation of the two W decay vertices in events is of the order of 0.1 fm, while the hadronization scale is of the order of a few fm. In incoherent scenarios, the difference between the correlations inside the hadronic system of one W and the correlations between the two hadronic systems depends on the overlap region of these two systems. In a coherent scenario, the correlations between the two systems may not exist at all, and the two systems would then decay independently provided there is no colour flow between them.
Inter–WW BEC effects (along with colour reconnection effects) are among the largest uncertainties in the determination of the W mass in the channel at LEP [14, 15]. If inter–WW BEC affect particles from different W bosons, this can disturb the W mass determination from the invariant masses. Initial predictions of various Monte Carlo (MC) models gave an uncertainty of up to 100 MeV on the W mass arising from BEC. Excluding some of the more extreme models, the most recent LEP estimate for the uncertainty is now 35 MeV [15].
2 Analysis method
BEC are usually presented in terms of two-particle densities, , measured as
| (1) |
for the number of pairs of identical bosons with four-momenta and and in the number of events under study. The correlations can be expressed in terms of the normalised inclusive two-particle density,
| (2) |
i.e. the ratio of the two-particle density , usually measured as a function of , (Eq. (1)), to the product of the two single-particle densities and . The single-particle density is measured as , where is the multiplicity of charged particles.
In this paper we use the method proposed in [12] to study inter–WW BEC. This method allows a direct search for inter–WW correlations from the data, with no need of MC models. If the two W bosons decay independently, then the two-particle density in events can be written as the sum of the two-particle densities of the individual and an additional part consisting of the product of single-particle densities, and , from different W bosons:
| (3) |
For pairs of charged hadrons, symmetry arguments imply that the two-particle density of W+, constructed from pairs of negatively charged particles added to that constructed from pairs of positively charged particles, is identical to that of W-; thus Eq. (3) becomes
| (4) |
The two-particle densities and are determined from events and events respectively. For the latter the lepton or its decay products are removed from the event.
The product of single-particle densities, , is determined by constructing artificially “mixed” events from the hadronic decay products of two events, as described in Sect. 5. The charge of the lepton is used to determine the charge of the hadronically decaying W system when constructing these events. Pairs of particles originating from different W bosons in the mixed events are uncorrelated by construction; the two-particle density formed from such pairs is termed . After integration over all momenta, but keeping fixed, Eq. (4) reads
| (5) |
The presence or absence of BEC between particles from different W bosons in events can be tested by verifying the equality between the two sides of Eq. (5) using distributions of different test variables to be defined below. This allows a variety of possibilities to be explored in an experimental search for inter–WW BEC. Selecting the variables which are most sensitive to inter–WW BEC, a method can then be devised which is best suited to evaluate the systematic error on the measurement of the W mass at LEP caused by possible inter–WW BEC.
We start by studying the distribution , which probes the independent hadronic decay of the two W bosons by comparing the two-particle densities from fully hadronic events (where all possible correlations are present) with the two-particle densities of artificially constructed events containing only intra–W correlations,
| (6) |
We also consider the integral of the distribution, integrated from to :
| (7) |
where bin-to-bin statistical fluctuations in the distributions are reduced.
In addition, we study, as a direct measure of genuine inter–WW correlations [13], the inter-source correlation function,
| (8) |
and the -ratio [11],
| (9) |
in which contamination from semileptonic events and artificial effects due to the mixing procedure are expected to be reduced.
To disentangle the BEC effects from other possible correlation sources (such as energy-momentum conservation or colour reconnection), which are supposed to be the same for like-sign () and unlike-sign charge pairs, we analyse the double difference,
| (10) |
its corresponding integral according to Eq. (7), as well as the inter-source correlation functions difference,
| (11) |
and the double ratio,
| (12) |
In Eqs. (10), (11) and (12), contributions from correlations other than BEC are expected to cancel, thus only BEC effects will affect these distributions. Moreover, any potential bias introduced by imperfections in the event mixing procedure should be strongly reduced. The distributions , and have the advantage of giving access to inter–WW BEC directly from data and do not rely on Monte Carlo modelling.
Another distribution which corrects for detector effects and possible imperfections in the event mixing procedure, but which introduces a MC model dependence, has been advocated in [11]. The double ratio is defined as
| (13) |
where is obtained from a Monte Carlo simulation without BEC but which includes other possible correlations.
If there are no correlations between particles originating from different W bosons, the variables defined above will, by construction, have the values: and for all . The inter–WW function , Eq. (8), can have arbitrary (positive or negative) values in the case where the W bosons decay products overlap only partially in momentum space. For fully overlapping and uncorrelated WW decays [13].
3 Experimental details
3.1 The OPAL detector
The OPAL detector has been described in detail elsewhere [16]. The analysis presented here relies mainly on the charged particle trajectories reconstructed using a set of cylindrical central tracking detectors within a solenoid that provides an axial magnetic field of 0.435 T. Electromagnetic energy is measured by a lead-glass calorimeter located outside the magnet coil. The innermost tracking detector is a silicon microvertex detector, which consists of two layers of silicon strip detectors, allowing at least one hit per charged particle track to be measured in the angular region 111The OPAL right-handed coordinate system is defined such that the origin is at the geometric centre of the jet chamber, is parallel to, and has positive sense along, the e- beam direction, is the coordinate normal to , is the polar angle with respect to + and is the azimuthal angle around . It is surrounded by the vertex drift chamber and the jet chamber, which is about 400 cm in length and 185 cm in radius, and provides up to 159 space points per track and also measures the ionization energy loss of charged particles. The -chambers, which considerably improve the measurement of the trajectories in , complement the tracking system. The combination of these chambers leads to a transverse momentum resolution of . Track finding is nearly 100% efficient within the angular region . The experimental resolution, , is directly related to that of , the invariant mass of the particle pair: . For pairs from decays, the mass resolution is found to be MeV [17], implying that, at GeV which is typical of the region of affected by BEC, MeV. For all distributions presented here, a bin size of 40 MeV is used, much larger than the experimental resolution in the region of interest.
3.2 Track and event selections
This study is carried out using data taken at centre-of-mass energies between 183 and 209 GeV with an integrated luminosity of approximately 680 pb-1. For the charged particles used in the BEC analysis the number of recorded hits in the jet chamber is required to be at least 40 and larger than 50% of the expected number at the given . Tracks must have a momentum component in the plane perpendicular to the beam axis of greater than 0.15 GeV, and a measured momentum of less than 100 GeV. In addition, they are required to have a good per degree-of-freedom for the track fits in the planes perpendicular and parallel to the beam direction. The extrapolated point of closest approach of each track to the collision axis is required to be less than 2 cm in the -plane and less than 25 cm in . The selected particles are assumed to be charged pions.
Two mutually exclusive event samples are selected: the fully hadronic event sample, , where both W bosons decay hadronically and the semileptonic event sample, , where one W decays hadronically and the other leptonically. Both selections are described in detail in [18]. The fully hadronic selection uses a likelihood weight based on a set of variables which characterize the decays. To suppress / jets background, in this analysis the requirement on this likelihood weight is tightened from the standard value of to . This reduces the residual / background from 15% to 8% of selected events, whilst reducing the signal efficiency e.g. at GeV from 86% to 71%.
The numbers of events selected in the data are 1721 for 183–192 GeV, 1290 for 196–200 GeV and 1459 for 202 GeV. The corresponding numbers in the channel are 1720, 1300 and 1513. This channel includes the and events, and those events where the lepton decays to e, or one charged hadron. The fraction of selected background of / jets in the channel is almost independent of the centre-of-mass energy. Events of the type jets are not considered as background since the ZZ system should be affected by BEC effects in a similar way to the WW signal. Although no correction is made for a few percent background contribution in the channel, this background was taken into account in assessing the systematic uncertainties.
The treatment of the / four jets background in the channel requires special attention, because these background events could mimic the signal of inter–WW BEC. This will be further discussed below.
All data and Monte Carlo distributions presented in this paper are at the detector level, i.e. they are not corrected for effects of detector acceptance and resolution. Background contributions have been subtracted from the data.
4 Monte Carlo modeling of BEC
Throughout this analysis the Pythia 6.1 Monte Carlo program [19] is used to demonstrate the sensitivity of the analysis to BEC effects for several different scenarios. Monte Carlo samples of about 30 times the number of data events are generated at energies of 189 GeV, 200 GeV and 206 GeV, and processed through a full simulation of the detector [20].
In Pythia, BEC effects are implemented via the PYBOEI [21] model (the option BE32 was used here). In the model, the particle momenta are adjusted to produce a BE enhancement of the form
| (14) |
where, in the so-called static incoherent picture, represents the source radius and the BEC “strength”. Global energy-momentum conservation is achieved by also adjusting the momenta of particles in unlike-sign pairs. Various implementations of the model can be tested, among them the full (intra–W plus inter–WW) BEC, the intra–W BEC (no inter–WW BEC), and the no–BEC options.
In the present analysis, a Gaussian parameterisation with the PYBOEI parameters PARJ(92) () = 2.15 and PARJ(93) = 0.25 GeV (which leads to fm) is used for the full–BEC and intra–W BEC only cases. The Pythia QCD and fragmentation parameters, based on a previous OPAL tune [22], along with the PYBOEI BEC model parameters have been retuned together to the data.222Only the main QCD/fragmentation parameters change with respect to the OPAL standard parameters: PARJ(81) GeV, PARJ(82) GeV, PARJ(42) (Lund parameter) GeV, PARJ(21) GeV. With these parameters, the two-particle distribution of the data, with both data and MC normalised to a MC without BEC, is described to better than 2% in the range between 0.05 and 0.6 GeV, as shown in Fig. 1. For MeV, the MC fails to describe the data as a result of artificial effects of the implementation of the correlations in the model. For intermediate values of , up to about 0.5 GeV, which is the region of interest for the study of BEC, the agreement between data and MC is very good. A small discrepancy for higher values is seen. This can be explained from the fact that the full integral over is related to the mean number of particle pairs. Since the PYBOEI model does not change the event multiplicity distribution, any difference in the -distributions at small has to be compensated elsewhere.
The MC tuned on inclusive decays at LEP1 overestimates BEC in events with jet topologies similar to the topology. The two-particle density of the BEC Monte Carlo used to subtract the / background in the events is therefore corrected bin-by-bin by applying a scaling factor of the ratio of the two-particle densities of data and MC for multi-jet events at 91 GeV. Because the selection [18] is mainly based on variables scaled to the centre-of-mass energy, it is also suitable for the selection of events.
5 Event mixing technique
To measure the quantities defined in Eqs. (6)–(13), the two-particle density needs to be determined. This is achieved by mixing the hadronic parts of two semileptonic data events, after removing the leptonic parts of the events. By combining two hadronic W decays recorded in different events, an artificial event can be constructed which is guaranteed to have no inter–WW correlations. The particles originating from one hadronically decaying W are fixed, while the particles from the second W are rotated in azimuth such that the two W bosons are back-to-back in . The mixed event has a topology similar to that of a real event. The two decaying W bosons are selected to have opposite charge, and the centre-of-mass energies of the two semileptonic events are required to be similar, such that
| (15) |
The direction of the hadronically decaying W is determined to a precision of 80 mrad in the polar angle using the sum of momenta of all charged particles and clusters of energy in the electromagnetic calorimeter which are not associated with tracks. The difference in the reconstructed angle between the two hadronic W bosons is required to be
| (16) |
This ensures that both W bosons were originally oriented towards detector regions which have the same track detection properties, either in the same hemisphere or in opposite ones. In the former case all charged particle momenta of one W are reflected into the opposite hemisphere. The mixed events are then passed through the regular event selection, which rejects 26% of all mixed events.
To check that the mixed events resemble closely real events, the event shape variables and single-particle spectra are compared. Good agreement of the latter is essential, since the mixing term in Eq. (4) depends directly on these spectra. Fig. 2 shows the distributions of rapidity, transverse momentum and , the angle between the particle direction and a plane determined by the incoming beam direction and the thrust axis, for real and mixed events after the event selection. The thrust axis of the mixed events is used as the reference axis for the single-particle spectra. Good agreement is observed between the distributions for mixed WW events and those of real WW events. As a further check, thrust, oblateness and aplanarity [22] distributions are compared in Fig. 3. The distributions of mixed events agree reasonably well with those for real WW events. The thrust distributions show some differences which, however, are due to event selection effects and are unimportant for studies of BEC.
The two-particle distributions for the events are scaled by a small factor () to correct for the slightly different track selection efficiencies for the , and the constructed mixed events.
6 Systematic uncertainties
The data discussed in the next section will be shown with statistical and systematic uncertainties added in quadrature. All systematic errors are dealt with on a bin-by-bin basis by calculating the effect of each systematic on each bin separately, and summing all the variations for a bin in quadrature. Several sources of systematic effects have been studied.
-
•
Track selection: We have repeated the study requiring the measured distance of closest approach of each track to the collision axis to be less than 1 cm (rather than 2 cm) in the -plane. Alternatively, an additional requirement that the mean energy loss value is compatible with the pion hypothesis at 99% confidence level was imposed. These two changes, giving a systematic uncertainty in the test distributions of less than 2% and 6%, respectively, have been summed in quadrature to give the total systematic uncertainty due to charged track quality selection criteria.
-
•
Background in the channel: We have repeated our analysis using only and semileptonic events which are selected with a high purity. Final states selected as events were removed from the semileptonic two-particle densities and were not used for the event mixing. This gives a systematic uncertainty of less than 3% on the test distributions.
-
•
Event selection for : We have repeated the analysis with the OPAL standard likelihood weight requirement of 0.23 instead of 0.55 used here. This change introduces a systematic uncertainty of less than 5% on the variables studied.
-
•
Monte Carlo correction of the / four jets background: We have repeated the analysis subtracting background which was not scaled due to the topology difference as explained in Sect. 4. This introduces a systematic uncertainty of less than 4% on the test distributions.
-
•
Event mixing procedure: We have repeated the analysis modifying the main event mixing criteria. We varied the requirement on the reconstructed angle in the range between 50 and 100 mrad. This gives a systematic uncertainty of less than 1% in both cases. Changing the requirement on the energy difference of the mixed W bosons, Eq. (15), from 5 to 8 GeV results in a difference of less than 3% for the distributions under study.
In addition, the effect of colour reconnection was studied. Using the implementation of this effect in the Ariadne model AR2 and AR3 [23], no significant influence on the results presented here was found after the two-particle distributions are scaled to have the same mean particle pair multiplicity as that of the mixed events.
7 Results
Figure 4 shows Pythia MC predictions for the two-particle density, defined in Eq. (1), of like-sign and unlike-sign particle pairs for , and mixed events, and for the / four jets background sample, calculated for the three BEC scenarios: the full–BEC scenario where a low- Bose-Einstein enhancement is simulated for all like-sign particle pairs, including those where the two hadrons originate from different W bosons; the intra–W BEC scenario where the BEC effect acts only on particles originating from the same W, and the no–BEC scenario, where the BEC effect is not simulated.
Background events from / jets decays which satisfy the WW selection criteria have a higher multiplicity than events. As Fig. 4 shows, for such events is large compared to that of real events. Although the fraction of background is low, a careful subtraction is necessary. In the present analysis, the / jets contribution is subtracted bin-by-bin from the data using the MC predictions. Note that this is the only instance where a MC model-dependence enters the analysis; all other information needed is derived directly from the data themselves.
To determine the statistical errors on the distributions shown in the following, a statistical sampling technique has been used instead of the conventional method of error propagation. For each individual distribution, the effect of statistical fluctuations is simulated by randomly sampling the content of each bin, using the full covariance matrix to account for bin-to-bin correlations. The means of the distributions are set equal to the observed bin contents. The statistical errors on , Eq. (7), and of each bin of the distributions studied, are then estimated from the dispersion of the results, after repeated sampling of the input distributions. A re-sampling frequency of 1000 was used for this analysis.
The data results presented hereafter are compared to the predictions of the three BEC MC scenarios described above. This allows the assessment of the experimental sensitivity of the various test distributions, defined in Sect. 2, to inter–WW correlations of the type and strength considered in Pythia.
Figs. 5(a) and 5(b) show the experimental -distributions, defined in Eq. (6), for like-sign and unlike-sign pairs. Both and are, for all , compatible with zero within uncertainties, as is expected if the W+ and W- decay independently. In particular, shows no evidence for a strong inter–WW BEC effect.
The intra–W and no–BEC MC predictions are zero within errors. This shows that the event mixing technique used is adequate and does not introduce strong methodological biases. For the full–BEC scenario, the inter–WW BEC effect is clearly visible for like-sign particle pairs at low , GeV, Fig. 5(a). Note, however, that a small and rather broad enhancement of the full–BEC curve over the other BEC scenarios is predicted also for unlike-sign particle pairs, Fig. 5(b). These artificial correlations arise from the way energy-momentum conservation is locally enforced in PYBOEI and affects all particles, whatever their charge.
Whereas the result for is, by itself, consistent with the hypothesis of no inter–WW BEC, comparison with the full–BEC predictions leads to the conclusion that the experimental sensitivity is insufficient to be able to exclude inter–WW correlations of the type and size as introduced in the BEC model of Pythia.
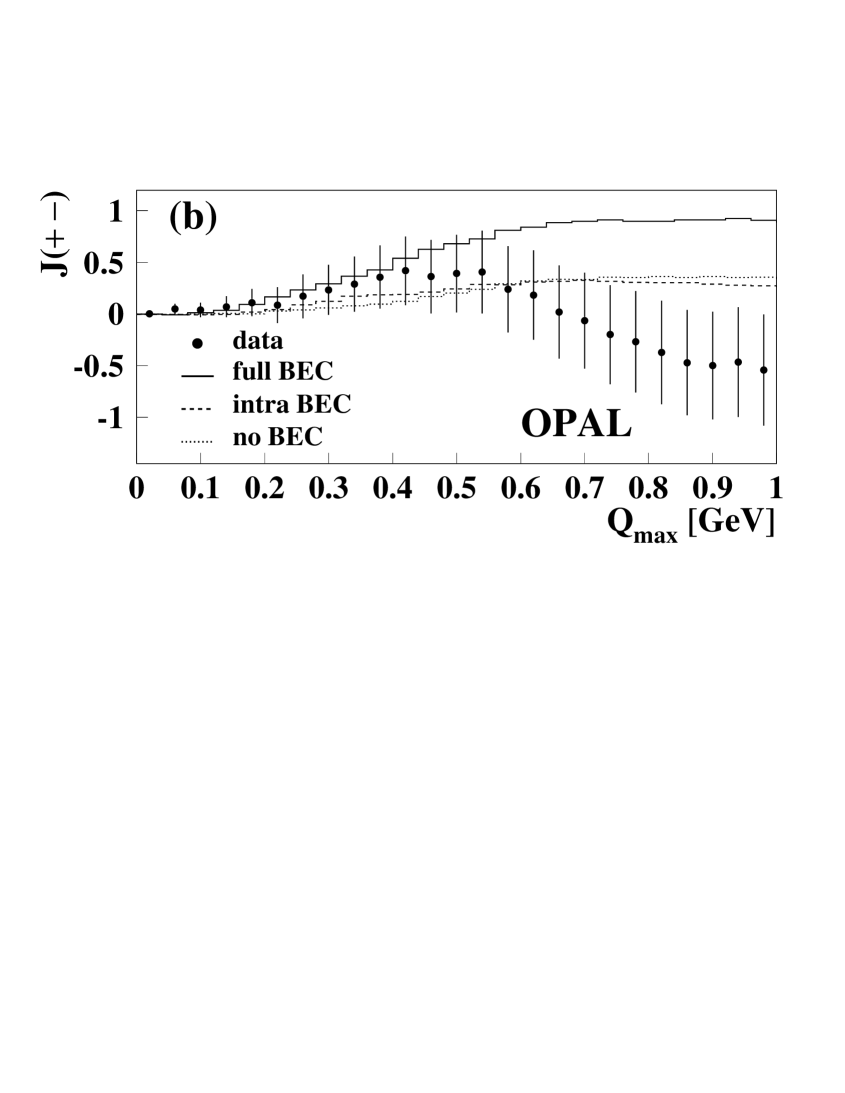
In Fig. 6, the integrated distributions, and , Eq. (7), computed by summation over bins up to , are shown. The data for are consistent with zero, as are the intra–W and no–BEC predictions. As expected, significantly larger values are observed for the model with inter–WW BEC. Positive values are also predicted for ; these result from the broad enhancement at low observed in Fig. 5(b).
The values of for GeV are given in the first row of Table 1. The experimental value is consistent with that for the intra–W and no–BEC scenarios, but differs from that for full BEC effects by 2.2 standard deviations.
In Fig. 7, we present the inter–WW correlation function , Eq. (8), for like-sign and unlike-sign pairs. In data and for all models except the full–BEC case, is consistent with zero even in the low- region, with the largest deviation in the second lowest data point. Although the data do not show a significant signal of inter–WW BEC, the low data statistics do not allow the different scenarios to be distinguished.
Figs. 8 and 9 show the distributions , Eq. (9), and , Eq. (13), respectively, for like-sign and unlike-sign particle pairs. The data points are compatible with unity for all , as expected for independent W+ and W- decays. The same holds for the intra–W and no–BEC scenarios. The data are consistent with both the full and intra–W BEC scenarios as predicted by Pythia.
The distributions and (and , see below) have been fitted with an empirical parametrization [13] of the form
| (17) |
The fits were performed in the interval GeV using the full covariance matrix of the corresponding distributions. In Eq.(17), , , and are fit parameters: is the overall normalisation, takes into account effects due to potential long-range correlations, and are, respectively, a measure of the “strength” and width of the enhancement expected from inter–WW BEC. Since the predictions of the MC scenarios without inter–WW BEC and the data are compatible with a constant value of , was first determined from a fit to the respective distribution for a MC event sample with full BEC. This reduces the number of free fit parameters. The values obtained are given in Table 1.333From now on, we use a notation corresponding to the fitted variable to denote the parameters resulting from the fits. In all other fits, was kept fixed at these values.
To evaluate the systematic uncertainties, in addition to the effects listed in Sect. 6, the fits have also been performed starting at GeV instead of GeV, and fitting the distribution up to GeV and GeV. In addition, the fits were repeated either changing the values of the width parameter or within the errors quoted, or omitting444The corresponding parameters used are GeV and GeV. the factor in Eq. (17). In view of the deviation between data and the corresponding MC with BEC, shown in Fig. 1, the fits have been repeated with the interval GeV excluded. In this case only a negligible change in the results occurred.
The values of the “strength” parameter obtained from fits to () and () for the data and for the MC are collected in Table 1 together with the other parameters. The values are also shown in Fig. 10. The contributions to the systematic uncertainties on and are listed in Table 2. The measured values of and differ from the full–BEC scenario values by 1.5 and 1.3 standard deviations, respectively.
As explained in Sect. 2, the distributions considered so far are sensitive not only to inter–WW BEC but also to inter–WW correlations of non-BEC origin. The effect of the latter can be eliminated or at least reduced by considering the distributions , Eq. (10), , Eq. (11), and the -ratio, Eq. (12). In MC calculations, intra–W predictions for the terms involving unlike-sign pair distributions are used to account for the artificial correlations introduced by PYBOEI discussed earlier. The results are presented in Figs. 5(c), 7(c) and 8(c).
From Fig. 5(c), where the function is shown, one can see that there is no evidence for inter–WW BEC in the small region: within the uncertainties, the data points are compatible with zero, as the intra–W and no–BEC MC predict. In addition, the integral of , , is consistent with zero in the data, with , calculated up to GeV. Similar results are obtained from the MC -integrals for intra–W and no–BEC scenarios with and , respectively, while the -integral for the full–BEC scenario is significantly positive with .
The same conclusions can be drawn from Figs. 7(c) and Fig. 8(c). In Fig. 7(c) we show the difference , Eq. (11), between the inter-source like-sign and unlike-sign correlation functions, and , Eq. (8); all the data points, including the first two points, are compatible with zero, within the errors. In Fig. 8(c) we show the measured -ratio, ; within the uncertainties, all the data points are compatible with unity.
The distribution has also been fitted with the parametrization Eq. (17) in the interval GeV. The parameter was determined from a fit to obtained in the full–BEC MC; its value is listed in Table 1 along with other fitted parameters. The value for the “strength” parameter is also shown in Fig. 10. The contributions to the systematic uncertainties on are listed in Table 2. When the factor was omitted, was used in the fit. The parameter, which is complementary to that derived from or of like-sign pairs, but with strongly reduced contributions from effects other than BEC, is compatible with zero for the data. For the MC event sample with full BEC, deviates from the data value by 2.1 standard deviations.
Several variables have been studied in this analysis to search for BEC from different W bosons; it is of interest to identify the variable and/or distribution which has the largest sensitivity to the inter–WW BEC and can be used for the estimation of the systematic errors due to BEC on measurements of the W mass. We compare the difference between the predictions of the two MC scenarios, the full–BEC and intra–W BEC models, and the data, using the values of the integral ) and the fitted “strength” parameters given in Table 1. The separation power of the integral and the fitted parameters can be quantified by calculating the difference between the full–BEC and intra–W BEC predictions from MC simulation scaled by the total uncertainty of the measurement from the data. The values obtained for and the “strength” parameters are 2.2, 2.3, 2.0 and 1.8 for , , and respectively, indicating that the powers of all these variables are comparable, and both the distributions and the integral can be used as sensitive tests for establishing inter–WW BEC. For the purposes of setting a limit on the amount of inter–WW BEC to be considered as a systematic uncertainty for the W mass measurement, the measured data value plus one standard deviation can be taken as a bound on the fraction of the full Pythia model prediction consistent with the data. This fraction is 77% of the full Pythia inter–WW prediction for the parameter and 44% for the integral. It should also be noted that the and variables are sensitive to correlations other than BEC, but these effects are expected to cancel (assuming charge independence) in the , and functions. Therefore, exploring both the and e.g. the distributions (both of which disfavour inter–WW BEC) gives complementary information.
8 Conclusions
The full sample of high-energy events collected by the OPAL detector has been studied to look for evidence of Bose-Einstein correlations between like-sign hadron pairs from different W bosons, using dedicated test variables and distributions. The model for BEC effects as implemented in Pythia has been used to demonstrate the sensitivity. Within the data statistics available, no inter–WW BEC effects have been observed. Inter–WW BEC effects of the size predicted by Pythia are disfavoured. However, the limited data statistics do not permit them to be completely excluded. On the basis of the Pythia model, the distribution and the integral integral of the distribution, , are found to be the most sensitive to inter–WW BEC out of all variables studied. The measured value of the is found to be 2.2 standard deviations below the value expected from the Pythia full–BEC scenario. A combination of the data from all four LEP experiments will be required to draw a firm conclusion on the existence or absence of inter–WW BEC effects.
Acknowledgements:
We particularly wish to thank the SL Division for the efficient operation
of the LEP accelerator at all energies
and for their close cooperation with
our experimental group. In addition to the support staff at our own
institutions we are pleased to acknowledge the
Department of Energy, USA,
National Science Foundation, USA,
Particle Physics and Astronomy Research Council, UK,
Natural Sciences and Engineering Research Council, Canada,
Israel Science Foundation, administered by the Israel
Academy of Science and Humanities,
Benoziyo Center for High Energy Physics,
Japanese Ministry of Education, Culture, Sports, Science and
Technology (MEXT) and a grant under the MEXT International
Science Research Program,
Japanese Society for the Promotion of Science (JSPS),
German Israeli Bi-national Science Foundation (GIF),
Bundesministerium für Bildung und Forschung, Germany,
National Research Council of Canada,
Hungarian Foundation for Scientific Research, OTKA T-038240,
and T-042864,
NWO/NATO Fund for Scientific Research, the Netherlands.
References
-
[1]
E.A. De Wolf, I.M. Dremin, W. Kittel, Phys. Rep. 270
(1996) 1;
I.G. Knowles, G.D. Lafferty, J. Phys. G 23 (1997) 731. -
[2]
R. Hanbury Brown, R.Q. Twiss, Phil. Mag. 45 (1954) 663;
R. Hanbury Brown, R.Q. Twiss, Nature 178 (1956) 1076. -
[3]
B. Andersson, W. Hofmann, Phys. Lett. B 169
(1986) 364;
B. Andersson, M. Ringnér, Phys. Lett. B 421 (1998) 283;
B. Andersson, M. Ringnér, Nucl. Phys. B 513 (1998) 627. -
[4]
B. Andersson, The Lund Model, Cambridge
University Press, 1998;
B. Andersson et al., Recent developments in the Lund model, Proc. XXXVI Annual Winter School on Nuclear and Particle Physics and VIII St. Petersburg School on Theoretical Physics, St. Petersburg (Russia), 2002, hep-ph/0212122. -
[5]
G. Goldhaber et al., Phys. Rev.
Lett. 3 (1959) 181;
G. Goldhaber et al., Phys. Rev. 120 (1960) 300. - [6] W. Kittel, Lectures at 41st Course of Cracow School of Theoretical Physics, Zakopane (Poland), 2001, Acta Phys. Pol. B 32 (2001) 3927.
- [7] OPAL Collaboration, G. Abbiendi et al., Phys. Lett. B 523 (2001) 35.
- [8] G. Alexander, Rep. Prog. Phys. 66 (2003) 481.
- [9] W.J. Metzger, Bose-Einstein and other correlations in hadronic Z decay, Proc. XXXVIII Les Rencontres de Moriond: QCD and Hadronic Interactions, Les Arcs (France), 2003, hep-ex/0304025.
-
[10]
DELPHI Collaboration, P. Abreu et al., Phys. Lett. B 401 (1997) 181;
OPAL Collaboration, G. Abbiendi et al., Eur. Phys. J. C 8 (1999) 559;
ALEPH Collaboration, R. Barate et al., Phys. Lett. B 478 (2000) 50. -
[11]
L3 Collaboration, M. Acciarri et al., Phys. Lett. B 493 (2000) 233;
L3 Collaboration, P. Achard et al., Phys. Lett. B 547 (2002) 139. - [12] S.V. Chekanov, E.A. De Wolf, W. Kittel, Eur. Phys. J. C 2 (1999) 403.
- [13] E.A. De Wolf, Correlations in e+e W+W- hadronic decays, hep-ph/0101243.
-
[14]
P. de Jong, Final state interactions at LEP2,
Proc. Int. Europhysics Conference on High Energy Physics:
EPS-HEP 2003, Aachen (Germany), 2003, hep-ex/0309012;
E. Barberio, W physics at LEP, Proc. XXIII Int. Conference on Physics in Collision, Zeuthen (Germany), 2003, hep-ex/0309066;
N. van Remortel, Bose-Einstein Correlations in Hadronic W Decays at LEP, Proc. XXXIII Int. Symposium on Multiparticle Dynamics: ISMD 2003, Cracow (Poland), 2003, Acta Phys. Pol. B 35 (2004) 55. - [15] The LEP Collaborations ALEPH, DELPHI, L3, OPAL, the LEP Electroweak Working Group, and the SLD Electroweak and Heavy Flavour Groups, A combination of preliminary electroweak measurements and constraints on the Standard Model, hep-ex/0312023 and LEPEWWG/2003-02 (see http://www.cern.ch/LEPEWWG).
-
[16]
OPAL Collaboration, K. Ahmet et al., Nucl. Instr. Meth.
A 305 (1991) 275;
OPAL Collaboration, P.P. Allport et al., Nucl. Instr. Meth. A 346 (1994) 476;
S. Anderson et al., Nucl. Instr. Meth. A 403 (1998) 326. - [17] OPAL Collaboration, R. Akers et al., Z. Phys. C 67 (1995) 389.
-
[18]
OPAL Collaboration,
G. Abbiendi et al.,
Eur. Phys. J. C 8 (1999) 191.
OPAL Collaboration, G. Abbiendi et al., Phys. Lett. B 493 (2000) 249. -
[19]
T. Sjöstrand, Comp. Phys. Comm. 82 (1994) 74;
T. Sjöstrand et al., Comp. Phys. Comm. 135 (2001) 238. - [20] J. Allison et al., Nucl. Instr. Meth. A 317 (1992) 47.
- [21] T. Sjöstrand, L. Lönnblad, Eur. Phys. J. C 2 (1998) 165.
- [22] OPAL Collaboration, G. Alexander et al., Z. Phys. C 69 (1996) 543.
- [23] L. Lönnblad, Z. Phys. C 70 (1996) 107.
| Variable | Parameter | Data | no BEC | intra–W BEC | full BEC |
|---|---|---|---|---|---|
| (GeV) | fixed at the value | ||||
| — | |||||
| (GeV) | fixed at the value | ||||
| — | |||||
| — | |||||
| (GeV) | fixed at the value | ||||
| Source | Uncertainty on | Uncertainty on | Uncertainty on |
|---|---|---|---|
| Distance of track closest approach | 0.016 | 0.014 | 0.007 |
| Specific energy loss | 0.006 | 0.013 | 0.011 |
| event bakground | 0.008 | 0.011 | 0.027 |
| event likelihood weight | 0.003 | 0.002 | 0.004 |
| 4-jet scaling | 0.017 | 0.019 | 0.003 |
| Maximal mixing angle of 50 mrad | 0.008 | 0.012 | 0.004 |
| Maximal mixing angle of 100 mrad | 0.003 | 0.014 | 0.004 |
| Mixing energy difference | 0.012 | 0.005 | 0.004 |
| Fit range | 0.019 | 0.023 | 0.032 |
| errors | 0.003 | 0.018 | 0.008 |
| Removing from the fit | 0.013 | 0.010 | 0.020 |
| Total systematic uncertainty | 0.038 | 0.047 | 0.050 |


dps.ps

