Evidence for a narrow baryonic state decaying to and in deep inelastic scattering at HERA
Abstract
A resonance search has been made in the and invariant-mass spectrum measured with the ZEUS detector at HERA using an integrated luminosity of 121 pb-1. The search was performed in the central rapidity region of inclusive deep inelastic scattering at an centre-of-mass energy of 300–318 GeV for exchanged photon virtuality, , above 1 . Recent results from fixed-target experiments give evidence for a narrow baryon resonance decaying to and , interpreted as a pentaquark. The results presented here support the existence of such state, with a mass of and a Gaussian width consistent with the experimental resolution of . The signal is visible at high and, for , contains events. The probability of a similar signal anywhere in the range 1500–1560 MeV arising from fluctuations of the background is below .
DESY–04–056
The ZEUS Collaboration
S. Chekanov,
M. Derrick,
J.H. Loizides1,
S. Magill,
S. Miglioranzi1,
B. Musgrave,
J. Repond,
R. Yoshida
Argonne National Laboratory, Argonne, Illinois 60439-4815, USA n
M.C.K. Mattingly
Andrews University, Berrien Springs, Michigan 49104-0380, USA
N. Pavel
Institut für Physik der Humboldt-Universität zu Berlin,
Berlin, Germany
P. Antonioli,
G. Bari,
M. Basile,
L. Bellagamba,
D. Boscherini,
A. Bruni,
G. Bruni,
G. Cara Romeo,
L. Cifarelli,
F. Cindolo,
A. Contin,
M. Corradi,
S. De Pasquale,
P. Giusti,
G. Iacobucci,
A. Margotti,
A. Montanari,
R. Nania,
F. Palmonari,
A. Pesci,
L. Rinaldi,
G. Sartorelli,
A. Zichichi
University and INFN Bologna, Bologna, Italy e
G. Aghuzumtsyan,
D. Bartsch,
I. Brock,
S. Goers,
H. Hartmann,
E. Hilger,
P. Irrgang,
H.-P. Jakob,
O. Kind,
U. Meyer,
E. Paul2,
J. Rautenberg,
R. Renner,
A. Stifutkin,
J. Tandler3,
K.C. Voss,
M. Wang
Physikalisches Institut der Universität Bonn,
Bonn, Germany b
D.S. Bailey4,
N.H. Brook,
J.E. Cole,
G.P. Heath,
T. Namsoo,
S. Robins,
M. Wing
H.H. Wills Physics Laboratory, University of Bristol,
Bristol, United Kingdom m
M. Capua,
A. Mastroberardino,
M. Schioppa,
G. Susinno
Calabria University,
Physics Department and INFN, Cosenza, Italy e
J.Y. Kim,
I.T. Lim,
K.J. Ma,
M.Y. Pac5
Chonnam National University, Kwangju, South Korea g
M. Helbich,
Y. Ning,
Z. Ren,
W.B. Schmidke,
F. Sciulli
Nevis Laboratories, Columbia University, Irvington on Hudson,
New York 10027 o
J. Chwastowski,
A. Eskreys,
J. Figiel,
A. Galas,
K. Olkiewicz,
P. Stopa,
L. Zawiejski
Institute of Nuclear Physics, Cracow, Poland i
L. Adamczyk,
T. Bołd,
I. Grabowska-Bołd6,
D. Kisielewska,
A.M. Kowal,
M. Kowal,
J. Łukasik,
M. Przybycień,
L. Suszycki,
D. Szuba,
J. Szuba7
Faculty of Physics and Nuclear Techniques,
AGH-University of Science and Technology, Cracow, Poland p
A. Kotański8,
W. Słomiński
Department of Physics, Jagellonian University, Cracow, Poland
V. Adler,
U. Behrens,
I. Bloch,
K. Borras,
V. Chiochia,
D. Dannheim9,
G. Drews,
J. Fourletova,
U. Fricke,
A. Geiser,
P. Göttlicher10,
O. Gutsche,
T. Haas,
W. Hain,
S. Hillert11,
C. Horn,
B. Kahle,
U. Kötz,
H. Kowalski,
G. Kramberger,
H. Labes,
D. Lelas,
H. Lim,
B. Löhr,
R. Mankel,
I.-A. Melzer-Pellmann,
C.N. Nguyen,
D. Notz,
A.E. Nuncio-Quiroz,
A. Polini,
A. Raval,
L. Rurua,
U. Schneekloth,
U. Stösslein,
G. Wolf,
C. Youngman,
W. Zeuner
Deutsches Elektronen-Synchrotron DESY, Hamburg, Germany
S. Schlenstedt
DESY Zeuthen, Zeuthen, Germany
G. Barbagli,
E. Gallo,
C. Genta,
P. G. Pelfer
University and INFN, Florence, Italy e
A. Bamberger,
A. Benen,
F. Karstens,
D. Dobur,
N.N. Vlasov
Fakultät für Physik der Universität Freiburg i.Br.,
Freiburg i.Br., Germany b
M. Bell, P.J. Bussey,
A.T. Doyle,
J. Ferrando,
J. Hamilton,
S. Hanlon,
D.H. Saxon,
I.O. Skillicorn
Department of Physics and Astronomy, University of Glasgow,
Glasgow, United Kingdom m
I. Gialas
Department of Engineering in Management and Finance, Univ. of
Aegean, Greece
T. Carli,
T. Gosau,
U. Holm,
N. Krumnack,
E. Lohrmann,
M. Milite,
H. Salehi,
P. Schleper,
T. Schörner-Sadenius,
S. Stonjek11,
K. Wichmann,
K. Wick,
A. Ziegler,
Ar. Ziegler
Hamburg University, Institute of Exp. Physics, Hamburg,
Germany b
C. Collins-Tooth,
C. Foudas,
R. Gonçalo12,
K.R. Long,
A.D. Tapper
Imperial College London, High Energy Nuclear Physics Group,
London, United Kingdom m
P. Cloth,
D. Filges
Forschungszentrum Jülich, Institut für Kernphysik,
Jülich, Germany
M. Kataoka13,
K. Nagano,
K. Tokushuku14,
S. Yamada,
Y. Yamazaki
Institute of Particle and Nuclear Studies, KEK,
Tsukuba, Japan f
A.N. Barakbaev,
E.G. Boos,
N.S. Pokrovskiy,
B.O. Zhautykov
Institute of Physics and Technology of Ministry of Education and
Science of Kazakhstan, Almaty, Kazakhstan
D. Son
Kyungpook National University, Center for High Energy Physics, Daegu,
South Korea g
K. Piotrzkowski
Institut de Physique Nucléaire, Université Catholique de
Louvain, Louvain-la-Neuve, Belgium
F. Barreiro,
C. Glasman15,
O. González,
L. Labarga,
J. del Peso,
E. Tassi,
J. Terrón,
M. Zambrana
Departamento de Física Teórica, Universidad Autónoma
de Madrid, Madrid, Spain l
M. Barbi, F. Corriveau,
S. Gliga,
J. Lainesse,
S. Padhi,
D.G. Stairs,
R. Walsh
Department of Physics, McGill University,
Montréal, Québec, Canada H3A 2T8 a
T. Tsurugai
Meiji Gakuin University, Faculty of General Education,
Yokohama, Japan f
A. Antonov,
P. Danilov,
B.A. Dolgoshein,
D. Gladkov,
V. Sosnovtsev,
S. Suchkov
Moscow Engineering Physics Institute, Moscow, Russia j
R.K. Dementiev,
P.F. Ermolov,
I.I. Katkov,
L.A. Khein,
I.A. Korzhavina,
V.A. Kuzmin,
B.B. Levchenko,
O.Yu. Lukina,
A.S. Proskuryakov,
L.M. Shcheglova,
S.A. Zotkin
Moscow State University, Institute of Nuclear Physics,
Moscow, Russia k
I. Abt,
C. Büttner,
A. Caldwell,
X. Liu,
J. Sutiak
Max-Planck-Institut für Physik, München, Germany
N. Coppola,
S. Grijpink,
E. Koffeman,
P. Kooijman,
E. Maddox,
A. Pellegrino,
S. Schagen,
H. Tiecke,
M. Vázquez,
L. Wiggers,
E. de Wolf
NIKHEF and University of Amsterdam, Amsterdam, Netherlands h
N. Brümmer,
B. Bylsma,
L.S. Durkin,
T.Y. Ling
Physics Department, Ohio State University,
Columbus, Ohio 43210 n
A.M. Cooper-Sarkar,
A. Cottrell,
R.C.E. Devenish,
B. Foster,
G. Grzelak,
C. Gwenlan16,
T. Kohno,
S. Patel,
P.B. Straub,
R. Walczak
Department of Physics, University of Oxford,
Oxford United Kingdom m
A. Bertolin, R. Brugnera,
R. Carlin,
F. Dal Corso,
S. Dusini,
A. Garfagnini,
S. Limentani,
A. Longhin,
A. Parenti,
M. Posocco,
L. Stanco,
M. Turcato
Dipartimento di Fisica dell’ Università and INFN,
Padova, Italy e
E.A. Heaphy,
F. Metlica,
B.Y. Oh,
J.J. Whitmore17
Department of Physics, Pennsylvania State University,
University Park, Pennsylvania 16802 o
Y. Iga
Polytechnic University, Sagamihara, Japan f
G. D’Agostini,
G. Marini,
A. Nigro
Dipartimento di Fisica, Università ’La Sapienza’ and INFN,
Rome, Italy
C. Cormack18,
J.C. Hart,
N.A. McCubbin
Rutherford Appleton Laboratory, Chilton, Didcot, Oxon,
United Kingdom m
C. Heusch
University of California, Santa Cruz, California 95064, USA n
I.H. Park
Department of Physics, Ewha Womans University, Seoul, Korea
H. Abramowicz,
A. Gabareen,
S. Kananov,
A. Kreisel,
A. Levy
Raymond and Beverly Sackler Faculty of Exact Sciences,
School of Physics, Tel-Aviv University, Tel-Aviv, Israel d
M. Kuze
Department of Physics, Tokyo Institute of Technology,
Tokyo, Japan f
T. Fusayasu,
S. Kagawa,
T. Tawara,
T. Yamashita
Department of Physics, University of Tokyo,
Tokyo, Japan f
R. Hamatsu,
T. Hirose2,
M. Inuzuka,
H. Kaji,
S. Kitamura19,
K. Matsuzawa
Tokyo Metropolitan University, Department of Physics,
Tokyo, Japan f
M. Costa,
M.I. Ferrero,
V. Monaco,
R. Sacchi,
A. Solano
Università di Torino and INFN, Torino, Italy e
M. Arneodo,
M. Ruspa
Università del Piemonte Orientale, Novara, and INFN, Torino,
Italy e
T. Koop,
J.F. Martin,
A. Mirea
Department of Physics, University of Toronto, Toronto, Ontario,
Canada M5S 1A7 a
J.M. Butterworth20,
R. Hall-Wilton,
T.W. Jones,
M.S. Lightwood,
M.R. Sutton4,
C. Targett-Adams
Physics and Astronomy Department, University College London,
London, United Kingdom m
J. Ciborowski21,
R. Ciesielski22,
P. Łużniak23,
R.J. Nowak,
J.M. Pawlak,
J. Sztuk24,
T. Tymieniecka,
A. Ukleja,
J. Ukleja25,
A.F. Żarnecki
Warsaw University, Institute of Experimental Physics,
Warsaw, Poland q
M. Adamus,
P. Plucinski
Institute for Nuclear Studies, Warsaw, Poland q
Y. Eisenberg,
D. Hochman,
U. Karshon
M. Riveline
Department of Particle Physics, Weizmann Institute, Rehovot,
Israel c
A. Everett,
L.K. Gladilin26,
D. Kçira,
S. Lammers,
L. Li,
D.D. Reeder,
M. Rosin,
P. Ryan,
A.A. Savin,
W.H. Smith
Department of Physics, University of Wisconsin, Madison,
Wisconsin 53706, USA n
S. Dhawan
Department of Physics, Yale University, New Haven, Connecticut
06520-8121, USA n
S. Bhadra,
C.D. Catterall,
S. Fourletov,
G. Hartner,
S. Menary,
M. Soares,
J. Standage
Department of Physics, York University, Ontario, Canada M3J
1P3 a
1 also affiliated with University College London, London, UK
2 retired
3 self-employed
4 PPARC Advanced fellow
5 now at Dongshin University, Naju, South Korea
6 partly supported by Polish Ministry of Scientific
Research and Information Technology, grant no. 2P03B 12225
7 partly supported by Polish Ministry of Scientific Research and Information
Technology, grant no.2P03B 12625
8 supported by the Polish State Committee for Scientific
Research, grant no. 2 P03B 09322
9 now at Columbia University, N.Y., USA
10 now at DESY group FEB
11 now at University of Oxford, Oxford, UK
12 now at Royal Holoway University of London, London, UK
13 also at Nara Women’s University, Nara, Japan
14 also at University of Tokyo, Tokyo, Japan
15 Ramón y Cajal Fellow
16 PPARC Postdoctoral Research Fellow
17 on leave of absence at The National Science Foundation, Arlington, VA, USA
18 now at University of London, Queen Mary College, London, UK
19 present address: Tokyo Metropolitan University of
Health Sciences, Tokyo 116-8551, Japan
20 also at University of Hamburg, Alexander von Humboldt
Fellow
21 also at Łódź University, Poland
22 supported by the Polish State Committee for
Scientific Research, grant no. 2P03B 07222
23 Łódź University, Poland
24 Łódź University, Poland, supported by the
KBN grant 2P03B12925
25 supported by the KBN grant 2P03B12725
26 on leave from MSU, partly supported by
the Weizmann Institute via the U.S.-Israel BSF
| a | supported by the Natural Sciences and Engineering Research Council of Canada (NSERC) |
|---|---|
| b | supported by the German Federal Ministry for Education and Research (BMBF), under contract numbers HZ1GUA 2, HZ1GUB 0, HZ1PDA 5, HZ1VFA 5 |
| c | supported by the MINERVA Gesellschaft für Forschung GmbH, the Israel Science Foundation, the U.S.-Israel Binational Science Foundation and the Benozyio Center for High Energy Physics |
| d | supported by the German-Israeli Foundation and the Israel Science Foundation |
| e | supported by the Italian National Institute for Nuclear Physics (INFN) |
| f | supported by the Japanese Ministry of Education, Culture, Sports, Science and Technology (MEXT) and its grants for Scientific Research |
| g | supported by the Korean Ministry of Education and Korea Science and Engineering Foundation |
| h | supported by the Netherlands Foundation for Research on Matter (FOM) |
| i | supported by the Polish State Committee for Scientific Research, grant no. 620/E-77/SPB/DESY/P-03/DZ 117/2003-2005 |
| j | partially supported by the German Federal Ministry for Education and Research (BMBF) |
| k | supported by RF President grant N 1685.2003.2 for the leading scientific schools and by the Russian Ministry of Industry, Science and Technology through its grant for Scientific Research on High Energy Physics |
| l | supported by the Spanish Ministry of Education and Science through funds provided by CICYT |
| m | supported by the Particle Physics and Astronomy Research Council, UK |
| n | supported by the US Department of Energy |
| o | supported by the US National Science Foundation |
| p | supported by the Polish Ministry of Scientific Research and Information Technology, grant no. 112/E-356/SPUB/DESY/P-03/DZ 116/2003-2005 |
| q | supported by the Polish State Committee for Scientific Research, grant no. 115/E-343/SPUB-M/DESY/P-03/DZ 121/2001-2002, 2 P03B 07022 |
1 Introduction
Recent results from fixed-target experiments give evidence for the existence of a narrow baryon resonance with a mass of approximately 1530 MeV and positive strangeness [1, *plb572:127, *prl91kub, *prl92:032001], seen in the decay channel. These results have triggered new interest in baryon spectroscopy since this baryon is manifestly exotic; it cannot be composed of three quarks, but may be explained as a bound state of five quarks, i.e. as a pentaquark, . A narrow baryonic resonance close to the observed mass is predicted in the chiral soliton model[5]. The quantum numbers of this state also permit decays to and (denoted as ). Evidence for a corresponding signal has been seen [6, *hep-ex-0309042, *hep-ex-0401024, *plb585:213, *hep-ex-0403011] in this channel by other experiments. Evidence for two other pentaquark states has also been reported recently [11, 12].
The Particle Data Group (PDG)[13] lists a number of ‘ bumps’, unestablished resonances observed with low significance by previous fixed-target experiments. The possible presence of these resonances in the mass region close to the production threshold of the final state complicates the search for pentaquarks in this decay channel.
The state and the bumps discussed above have never been observed in high-energy experiments, where hadron production is dominated by fragmentation. This paper presents the results of a search for narrow states in the decay channel in the central rapidity region of high-energy collisions, where particle production is not expected to be influenced by the baryon number in the initial state. The analysis was performed using deep inelastic scattering (DIS) events measured with exchanged-photon virtuality . The data sample, collected with the ZEUS detector at HERA, corresponds to an integrated luminosity of 121 pb-1, taken between 1996 and 2000. This sample is the sum of 38 pb-1 of data taken at a centre-of-mass energy of and 68 pb-1 taken at , plus 16 pb-1 of data taken at .
2 Experimental set-up
A detailed description of the ZEUS detector can be found elsewhere [14]. A brief outline of the components that are most relevant for this analysis is given below.
Charged particles are tracked in the central tracking detector (CTD) [15, *npps:b32:181, *nim:a338:254], which operates in a magnetic field of provided by a thin superconducting solenoid. The CTD consists of 72 cylindrical drift chamber layers, organised in nine superlayers covering the polar-angle111The ZEUS coordinate system is a right-handed Cartesian system, with the axis pointing in the proton beam direction, referred to as the “forward direction”, and the axis pointing left towards the centre of HERA. The coordinate origin is at the nominal interaction point. region . The transverse-momentum resolution for full-length tracks is , with in GeV. To estimate the ionization energy loss per unit length, , of particles in the CTD[18, *epj:c18:625], the truncated mean of the anode-wire pulse heights was calculated, which removes the lowest and at least the highest depending on the number of saturated hits. The measured values were corrected by normalising to the average for tracks around the region of minimum ionisation for pions, GeV. Henceforth, is quoted in units of minimum ionising particles (mips). The distribution for electrons has a roughly Gaussian shape centred about mips with width 0.14 mips, corresponding to a resolution of .
The high-resolution uranium–scintillator calorimeter (CAL) [20, *nim:a309:101, *nim:a321:356, *nim:a336:23] consists of three parts: the forward, the barrel and the rear calorimeters. The smallest subdivision of the calorimeter is called a cell. The CAL energy resolutions, as measured under test-beam conditions, are for electrons and for hadrons, with in GeV. A presampler [24, *magill:bpre] mounted in front of the calorimeter was used to correct the energy of the scattered electron222Henceforth the term electron is used to refer both to electrons and positrons.. The position of electrons scattered close to the electron beam direction is determined by a scintillator-strip detector [26].
The luminosity was measured using the bremsstrahlung process with the luminosity monitor [27, *zfp:c63:391, *acpp:b32:2025], a lead–scintillator calorimeter placed in the HERA tunnel at m.
3 Event simulation
Inclusive DIS events were generated using the Ariadne 4.08 Monte Carlo (MC) model [30] interfaced with Heracles 4.5.2 [31] via the Djangoh 1.1 program [32] in order to incorporate first-order electroweak corrections. The Ariadne program uses the Lund string model [33] for hadronisation, as implemented in Jetset 7.4[34].
Before detector simulation, the invariant-mass distribution was calculated from the true and (anti)protons in the mass range up to 1700 MeV. No peaks were found, indicating that no reflection from known decays are expected to generate a narrow peak in these decay channels.
The generated events were passed through a full simulation of the detector using Geant 3.13 [35] and processed with the same reconstruction program as used for the data. The detector-level MC samples were then selected in the same way as the data. The generated MC statistics were about three times higher than those of the data.
4 Event sample
The search was performed using DIS events with , the largest event sample for which no explicit trigger requirement was imposed on the hadronic final state. A three-level trigger [14] was used to select events online. At the third level, an electron with an energy greater than and a position outside a box of cm2 on the face of the calorimeter was required. The trigger has a high acceptance for GeV2. However, data below are strongly affected by prescales which were applied to the inclusive triggers to control data rates.
The Bjorken scaling variables and , as well as , were reconstructed using the electron method (denoted by the subscript ), which uses measurements of the energy and angle of the scattered electron, or using the Jacquet-Blondel (JB) method[36]. The scattered-electron candidate was identified from the pattern of energy deposits in the CAL [37].
The following requirements were imposed:
-
;
-
GeV, where is the corrected energy of the scattered electron measured in the CAL;
-
GeV, where , is the energy of the th calorimeter cell, is its polar angle and the sum runs over all cells;
-
and ;
-
cm, where is the vertex position determined from the tracks.
The present analysis is based on charged tracks measured in the CTD. The tracks were required to pass through at least five CTD superlayers and to have transverse momenta and pseudorapidity in the laboratory frame , restricting the study to a region where the CTD track acceptance and resolution are high. Candidates for long-lived neutral strange hadron decaying to two charged particles are identified by selecting pairs of oppositely charged tracks, fitted to a displaced secondary vertex. Events were required to have at least one such candidate.
After these selection cuts, a sample of 1 600 000 events remained.
5 Reconstruction of candidates
The mesons were identified by their charged-decay mode, . Both tracks were assigned the mass of the charged pion and the invariant mass, , of each track pair was calculated. The candidates were selected by imposing the following requirements:
-
•
, where the electron mass was assigned to each track, to eliminate tracks from photon conversions;
-
•
, where the proton mass was assigned to the track with higher momentum, to eliminate and contamination of the signal;
-
•
;
-
•
and .
Figure 1 shows the invariant-mass distribution for candidates for . A fit using two Gaussian functions plus a first-order polynomial function was used. The number of candidates was , with a background under the peak constituting approximately 6% of the total number of candidates. The peak position was , which agrees with the PDG value of [13] within the calibration uncertainty of the CTD. The width is consistent with the detector resolution.
6 Selection of candidates
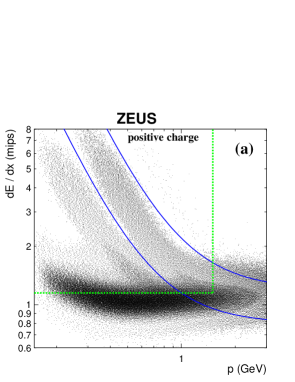
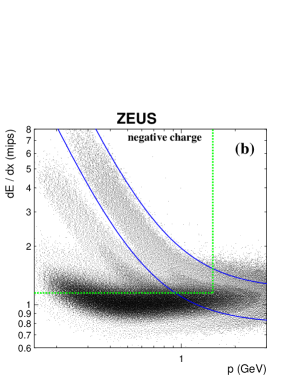
The (anti)proton candidate selection used the energy-loss measurement in the CTD, . Figure 2 shows the distribution as a function of the track momentum for positive and negative tracks. Tracks fitted to the primary vertex were used, with the exception of the scattered-electron track. Tracks were selected as described in Section 4. In addition, only tracks with more than CTD hits were used to ensure a good measurement. The tracks were then selected by requiring , where and , motivated by the Bethe-Bloch equation, are the functions: , (for positive tracks) and , (for negative tracks), where is the total track momentum in GeV. These cuts were found from an examination of as a function of and were checked by studying (anti)proton candidate tracks from decays. The proton band was found to be broader than that of the antiproton. There is also a clear deuteron band for positive tracks, which suggests a small contribution from secondary interactions. To remove the region where the proton band completely overlaps the pion band, the proton momentum was required to be less than . Finally, a cut requiring mips was applied.
After these cuts, the purity of the proton sample, estimated from the MC simulation, is around 60%, varying from 96% at low momentum to 17% at the highest accepted momenta. Applying a higher cut leads to higher purity, but reduces the acceptance for protons in the high-momentum region and reduces the statistics.
7 Reconstruction of invariant mass
The invariant mass was obtained by combining and (anti)proton candidates selected as described above, and fixing the mass to the PDG value. The resolution of the invariant-mass measurement was estimated using MC simulations to be in the region near , for both the and the channels.
The resolution was independently verified from the data by reconstructing the peak, assuming that the momentum and angle resolution for (anti)protons is similar to that for pions. Tracks passing the same angle and momentum cuts as the proton candidate sample were taken from the pion band, assigned the pion mass, and combined with the candidates. A fit was performed using a Breit-Wigner function convoluted with a Gaussian to describe the resolution. The width of the Breit-Wigner function was fixed to the natural width of the resonance of [13]. The resulting width of the Gaussian was , independent of the pion charge.
8 Results
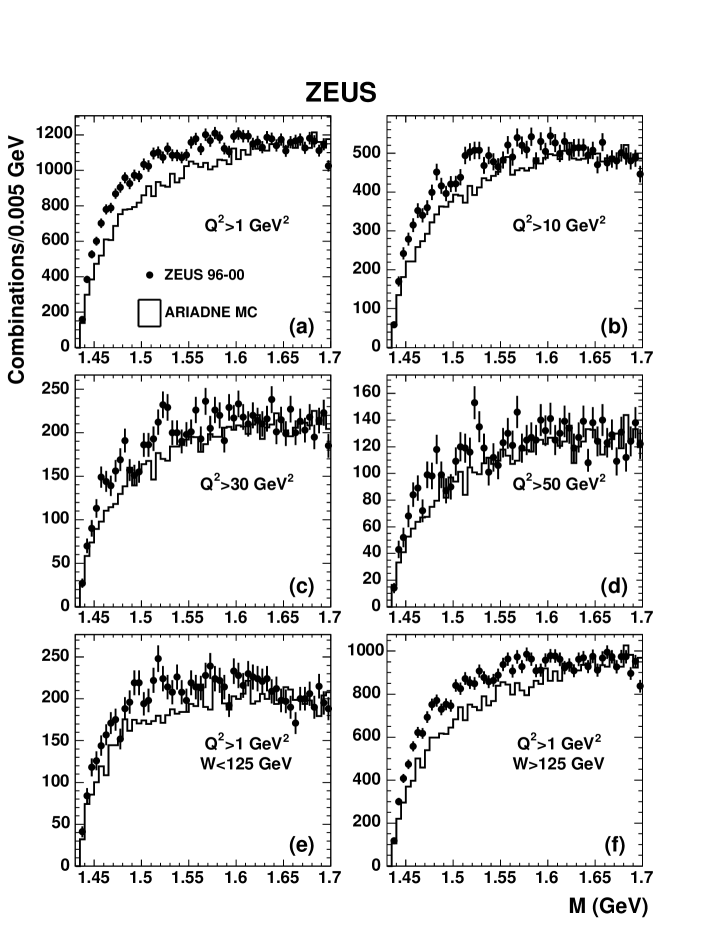
The mass spectrum, in the range from threshold to 1700 MeV, is shown in Fig. 3 for various regions of the DIS phase space. Figures 3a-3d show the mass distribution integrated above a minimum ranging from 1 GeV2 to . The data show signs of structure below about . For , a peak is seen in the mass distribution around 1520 MeV. Figures 3e and 3f show the sample divided into two bins of the photon-proton centre-of-mass energy, . A peak is seen in the lower bin.
The expectation from the MC simulation, scaled to agree with the data in the mass region above 1650 MeV, is also shown. If normalised to the luminosity, the simulation lies below the data by a factor of approximately two (not shown). Even after scaling, the data are not well described by the simulation for masses below 1600 MeV, and no structure is seen in the simulated data. The PDG reports a bump at , and several states above . None of these states are included in the simulation, which includes only well established resonances.
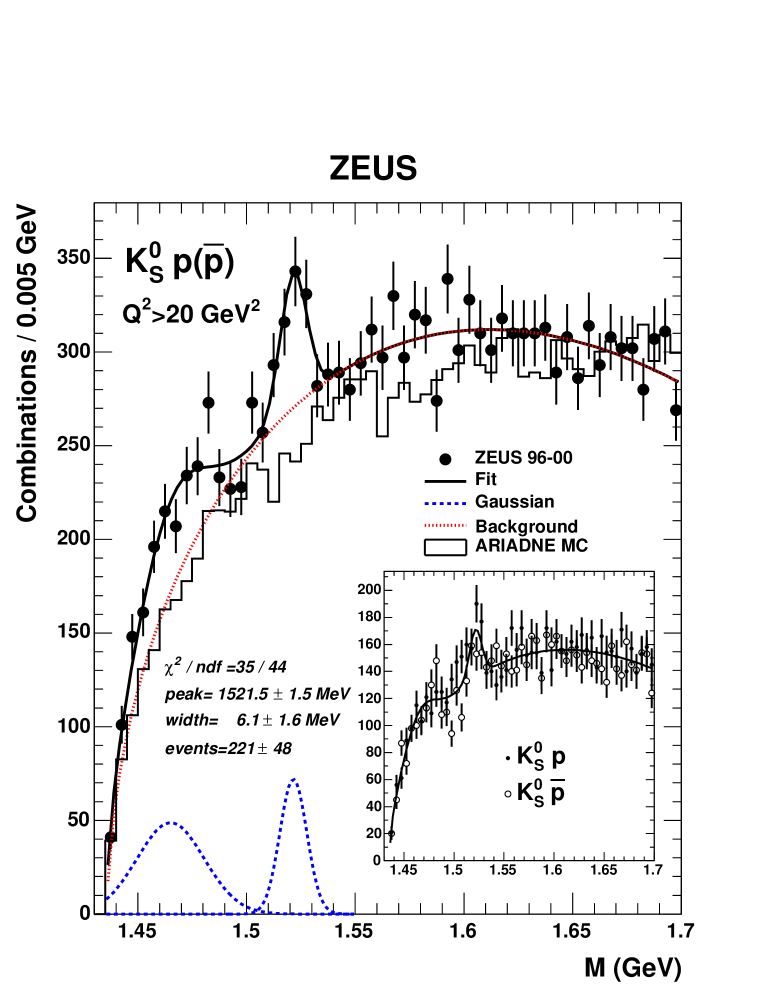
Several functional forms were fit to the data for over the mass range from threshold up to 1700 MeV to estimate the significance of the peak, as well as its position and width. A background of the form
where is the candidate mass, and are the masses of the proton and the , respectively, and , and are parameters, was found to give a good description of the data when combined with Gaussians to describe the signal near 1520 MeV as well as possible contributions from bumps. The parameters of the Gaussians and the background were left free. A bin-by-bin minimisation was used. The results of the fit using the background function plus one and two Gaussians are shown in Table 1. Reducing the number of parameters in the background function significantly reduces the quality of the fit. Adding a third Gaussian does not significantly improve the fit. The result of the fit using two Gaussians is shown in Fig. 4. The second Gaussian significantly improves the fit in the low mass region, and has a mass of and a width of and may correspond to the . However, the parameters and significance of any state in this region are difficult to estimate due to the steeply falling background close to threshold. The signal peak position is , with a measured Gaussian width , consistent with the resolution. The fit gives events above the background, corresponding to . The equivalent estimate for the single Gaussian fit is . The per degree of freedom for the fit over the whole fitted range of masses is 35/44. Over the same range, the per degree of freedom for the fit with no Gaussians is 69/50, which is an acceptable fit. However, this value is dominated by contributions from the high-mass region. A number of MC experiments were carried out, using the background fit with zero gaussians as a starting distribution and generating random data using Poisson statistics. The probability of a fluctuation leading to a signal with significance or more in the mass range 1500–1560 MeV and with a Gaussian width in the range 1.5–12 MeV, was found to be . The same exercise was carried out using the background plus the 1465 MeV Gaussian as the starting distribution, and the probability was found to be about a factor of ten lower.
The Gaussian function was replaced by a Breit-Wigner function convoluted with a Gaussian to describe the peak near . The width of the Gaussian distribution was fixed to the experimental resolution to obtain an estimate of the intrinsic width of the signal. The extracted width was .
The fit was repeated for different values of the minimum cut. Above both the signal and background are consistent with having a dependence, similar to the inclusive cross section. A MC study in which particles were modified to have a mass of 1530 MeV and artificially forced to decay to indicated that, at low , the impact of detector acceptance on the visible cross section is important; for the number of selected candidates rises more slowly than , as well as more slowly than the background. Such acceptance effects may be the reason for the absence of a clear signal at low and high . However, this suppression of the signal may also be related to the unknown production mechanism of the signal.
The invariant-mass spectrum was investigated for the and samples separately. The result is shown as an inset in Fig. 4 for , compared to the fit to the combined sample scaled by a factor of 0.5. The results for two decay channels are compatible, though the number of candidates is systematically lower. The mass distributions were fitted using the same function as the combined sample and gave statistically consistent results for the peak position and width (not shown). The number of events in the channel is . If the signal corresponds to the , this provides the first evidence for its antiparticle.
If an isotensor state is responsible for the signal, a signal might be expected in the spectrum[38]. The invariant mass spectra were investigated for a wide range of minimum values, identifying proton and charged kaon candidates using in a kinematic region similar to that used in the analysis. No peak was observed in the spectrum, while a clean signal333 The signal for in the spectrum has the same number of events and significance as the signal in the spectrum. was observed in the spectrum at , corresponding to the . Performing a fit using a Gaussian fixed to the detector resolution convoluted with a Breit-Wigner gives an intrinsic width of , consistent with the PDG value of [13].
8.1 Systematic checks
A number of checks have been carried out to study possible reflections from known states and to verify the robustness of the peak.
Tracks from the proton band within twice the width of the peak were removed. According to a MC calculation, this cut increased the purity of the proton sample by and reduced the statistics by a factor of 2.5. The resulting peak position was unchanged.
The energy of the proton candidates was required to be higher than that of the , to reduce the combinatorial background [39]. Using this cut and the -rejection cut, a peak may be seen in the mass spectrum even in the sample. However, this combination of cuts leads to a complicated background shape, making the significance and the mass of the signal difficult to evaluate.
The invariant mass was reconstructed from the data using the mass hypothesis for proton candidates, to see whether decays contribute to the signal. It was verified that heavy-flavour particles cannot contribute to this spectrum if .
The candidates were combined with primary tracks in the region mips and , where pions are expected to dominate over (anti)protons. The invariant mass was reconstructed using the same procedure as before, applying the proton-mass hypothesis for selected tracks. In addition, the mass distribution was calculated using the pion band of the plot to select proton candidates, and by using proton and candidates from different events. In none of these cases was any structure seen in the mass distribution.
The robustness of the peak was also checked by varying the event and track selections. The maximum momentum for the proton candidates was changed in a wide range from to . The cut was varied in the range to mips. No change was seen in the peak position.
8.2 Systematic uncertainties
The systematic uncertainties on the peak position and the width, determined from the fit shown in Fig. 4, were evaluated by changing the selection cuts and the fitting procedure. The largest uncertainties on the peak position and the Gaussian width for each check are given in parentheses (in MeV). The following systematic studies have been evaluated:
-
the DIS selection cuts were found to have a negligible effect on the peak position. The largest uncertainty was found by raising the cut to (, );
-
the -hit requirement for the proton candidates was not used (, ). The variations of the cuts on the tracks in the laboratory frame were found to have a negligible effect on the peak;
-
the cut was increased to mips (, ). The maximum momentum of protons was varied within (, );
-
the bin size was raised and lowered by (, ); the log-likelihood method was used for the fitting procedure instead of the method (no change);
-
the fit was made using only a single Gaussian (, ), or with three Gaussians (, ); the background function was changed to a third-order polynomial (, );
-
the CTD momentum calibration uncertainty on the peak position was calculated from the mass measurements of , and , as well as the reconstructed in the decay channel ().
The overall systematic uncertainties of and on the peak position and the width were determined by adding the above uncertainties in quadrature.
9 Summary and conclusions
The invariant mass spectrum has been studied in inclusive deep inelastic scattering for a large range in the photon virtuality. For a peak is seen around 1520 MeV.
The peak position, determined from a fit to the mass distribution in the kinematic region , is , and the measured Gaussian width of is above, but consistent with, the experimental resolution of . The number of events ascribed to the signal by this fit is . The statistical significance, estimated from the number of events assigned to the signal by the fit, varies between and depending upon the treatment of the background. The probability of a similar signal anywhere in the range 1500–1560 MeV arising from fluctuations of the background is below .
The results provide further evidence for the existence of a narrow baryon resonance consistent with the predicted pentaquark state with a mass close to and a width of less than . Evidence for such a state has been seen by other experiments, although the mass reported here lies somewhat below the average mass of these previous measurements. In the interpretation, the signal observed in the channel corresponds to first evidence for an antipentaquark with a quark content of . The results, obtained at high energies, constitute first evidence for the production of such a state in a kinematic region where hadron production is dominated by fragmentation.
Acknowledgements
We thank the DESY Directorate for their strong support and encouragement. The remarkable achievements of the HERA machine group were essential for the successful completion of this work and are greatly appreciated. We are grateful for the support of the DESY computing and network services. The design, construction and installation of the ZEUS detector have been made possible owing to the ingenuity and effort of many people from DESY and home institutes who are not listed as authors.
10
References
- [1] LEPS Coll., T. Nakano et al., Phys. Rev. Lett. 91, 012002 (2003)
- [2] SAPHIR Coll., J. Barth et al., Phys. Lett. B 572, 127 (2003)
- [3] CLAS Coll., V. Kubarovsky et al., Phys. Rev. Lett. 91, 252001 (2003)
- [4] CLAS Coll., V. Kubarovsky et al., Phys. Rev. Lett. 92, 032001 (2004). Erratum; ibid, 049902
- [5] D. Diakonov, V. Petrov and M.V. Polyakov, Z. Phys. A 359, 305 (1997)
- [6] DIANA Coll., V.V. Barmin et al., Phys. Atom. Nucl 66, 1715 (2003)
- [7] A.E. Asratyan, A.G. Dolgolenko, M.A. Kubantsev, Preprint hep-ex/0309042, 2003
- [8] SVD Coll., A. Aleev et al., Preprint hep-ex/0401024, 2004
- [9] HERMES Coll., A. Airapetian et al., Phys. Lett. B 585, 213 (2004)
- [10] COSY-TOF Coll., M. Abdel-Bary et al., Preprint hep-ex/0403011, 2004
- [11] NA49 Coll., C. Alt et al., Phys. Rev. Lett. 92, 042003 (2004)
- [12] H1 Coll., A. Aktas et al., Preprint hep-ex/0403017, 2004
- [13] Particle Data Group, K. Hagiwara et al., Phys. Rev. D 66, 010001 (2002)
- [14] ZEUS Coll., U. Holm (ed.), The ZEUS Detector. Status Report (unpublished), DESY (1993), available on http://www-zeus.desy.de/bluebook/bluebook.html
- [15] N. Harnew et al., Nucl. Inst. Meth. A 279, 290 (1989)
- [16] B. Foster et al., Nucl. Phys. Proc. Suppl. B 32, 181 (1993)
- [17] B. Foster et al., Nucl. Inst. Meth. A 338, 254 (1994)
- [18] ZEUS Coll., J. Breitweg et al., Phys. Lett. B 481, 213 (2000)
- [19] ZEUS Coll., J. Breitweg et al., Eur. Phys. J. C 18, 625 (2001)
- [20] M. Derrick et al., Nucl. Inst. Meth. A 309, 77 (1991)
- [21] A. Andresen et al., Nucl. Inst. Meth. A 309, 101 (1991)
- [22] A. Caldwell et al., Nucl. Inst. Meth. A 321, 356 (1992)
- [23] A. Bernstein et al., Nucl. Inst. Meth. A 336, 23 (1993)
- [24] A. Bamberger et al., Nucl. Inst. Meth. A 382, 419 (1996)
- [25] S. Magill and S. Chekanov, Proceedings of the IX Int. Conference on Calorimetry (Annecy, Oct 9-14, 2000), B. Aubert et al. (ed.), p. 625. Frascati Physics Series 21, Annecy, France (2001)
- [26] A. Bamberger et al., Nucl. Inst. Meth. A 401, 63 (1997)
- [27] J. Andruszków et al., Preprint DESY-92-066, DESY, 1992
- [28] ZEUS Coll., M. Derrick et al., Z. Phys. C 63, 391 (1994)
- [29] J. Andruszków et al., Acta Phys. Pol. B 32, 2025 (2001)
- [30] L. Lönnblad, Comp. Phys. Comm. 71, 15 (1992)
- [31] A. Kwiatkowski, H. Spiesberger and H.-J. Möhring, Comp. Phys. Comm. 69, 155 (1992). Also in Proc. Workshop Physics at HERA, Ed. W. Buchmüller and G.Ingelman, (DESY, Hamburg, 1991)
- [32] H. Spiesberger, heracles and djangoh: Event Generation for Interactions at HERA Including Radiative Processes, 1998, available on http://www.desy.de/~hspiesb/djangoh.html
- [33] B. Andersson et al., Phys. Rep. 97, 31 (1983)
- [34] T. Sjöstrand, Comp. Phys. Comm. 82, 74 (1994)
- [35] R. Brun et al., geant3, Technical Report CERN-DD/EE/84-1, CERN, 1987
- [36] F. Jacquet and A. Blondel, Proceedings of the Study for an Facility for Europe, U. Amaldi (ed.), p. 391. Hamburg, Germany (1979). Also in preprint DESY 79/48
- [37] H. Abramowicz, A. Caldwell and R. Sinkus, Nucl. Inst. Meth. A 365, 508 (1995)
- [38] S. Capstick et al., Phys. Lett. B 570, 185 (2003)
- [39] B. Levchenko, Preprint hep-ph/0401122, 2004
| Fit | Gaussian+Bkg. | 2 Gaussians + Bkg. | |
| MeV | 51/47 | 35/44 | |
| mass (MeV) | - | ||
| Peak 1 | width (MeV) | - | |
| events | - | ||
| mass (MeV) | |||
| Peak 2 | width (MeV) | ||
| events |