EXPERIMENTAL EVIDENCE OF GIANT ELECTRON – GAMMA BURSTS
GENERATED
BY EXTENSIVE
ATMOSPHERIC SHOWERS IN THUNDERCLOUDS
Abstract
The existence of a new phenomena – giant electron-gamma bursts is established. The bursts are generated in thunderclouds as a result of the combined action of runaway breakdown and extensive atmosphere showers (RB-EAS). The experiments were fulfilled at the Tien Shan Mountain Scientific Station using EAS-Radio installation. This specially constructed installation consists of a wide spread EAS trigger array and a high time resolution radiointerferometer.
(1) P.N. Lebedev Physical Institute, Moscow, Russia
(2) Radiophysical Research Institute, Nizhny Novgorod, Russia
(3) Thayer School of Engineering, Dartmouth College, NH, USA
(4) Ionosphere Institute Almaty, Kazakhstan Republic
(5) Tien Shan Mountain Scientific Station of LPI, Almaty,
Kazakhstan Republic
1 Introduction
A new physical concept of an avalanche type increase of a number of relativistic electrons in gas under the action of the electric field was proposed by Gurevich, Milikh and Roussel - Dupre [1]. The avalanche can grow in electric field . The field is almost an order of magnitude less than the threshold electric field of conventional breakdown . The growth of number of electrons with energies MeV is determined by the fact that under the action of electric field fast electrons could become runaways , what means that they are accelerated by electric field as suggested by Wilson [2]. Due to collisions with gas molecules they can generate not only large number of slow thermal electrons, but the new fast electrons having energies as well. Directly this process – acceleration and collisions lead to the avalanche type growth of the number of runaway and thermal electrons, which was called in [1] ”runaway breakdown” (RB). The detailed kinetic theory of RB was developed in [3]–[8].
In atmosphere, the critical field is kV/m and exactly these values of electric field are often observed during thunderstorms [9], [10] . When the electric field in thunderstorm cloud reaches the critical value every cosmic ray secondary electron (its energy MeV) initiates a micro runaway breakdown. It serves as a source of intensive ionization of air and manifests itself in a strong amplification of and -rays emission in thundercloud [1],[11],[12].
This emission was observed at airplanes [13], baloons [14], and in the mountain experiments [15] – [19].
Extensive atmospheric showers (EAS) are generated by a high energy cosmic ray particles. EAS are accompanied by a very strong local growth of cosmic ray secondaries number and emission in a high energy range . This flux interacts effectively with thundercloud electric field if runaway breakdown conditions are fulfilled (RB-EAS interaction). The energy obtained by fast electrons from thundercloud electric field due to the RB-EAS combined effect can serve for the explosive generation of a very large number of a newborn electrons and gamma quanta (see accompanying theoretical paper [20]).
The experimental study at the Tien Shan Mountain Scientific Station of this phenomena is our goal.
At the station a special system of gamma-spectrometers exist for ”thunderstorm” measurements. It is based on the Geiger-Muller counters SIG5 and NaJ detectors. The system permit to measure intensity of electrons, X and gamma quanta in wide energy range. A detailed description of ”thunderstorm” detector complex can be found in [15],[18].
For the present work a special air shower trigger array was created. The array system has to fix the EAS coming on an extensive region with high accuracy. The system consists of a set of shower electrons and quanta detectors (based on proportional Geiger-Muller counters) widely spread over Tien Shan Station territory.
The RB-EAS combined action lead to a strong radio pulses emitted from thundercloud [21]. A specially constructed radio installation was used to study the short electromagnetic pulses of this radio emission [22]. The installation allows to determine pulse form, its maximal intensity and arrival direction (inclination and azimuth angles). The moments of EAS coming is fixed by piping the trigger signal from shower array to the radio installation. That allows to study the EAS and radio emission simultaneously.
The results of measurements are presented. More then 150 simultaneous EAS-radio events are observed. The analysis of the obtained experimental data allows to establish the existence of a new phenomena – giant electron – gamma bursts generated in thunderclouds.
2 The cosmic showers trigger array
The cosmic showers trigger array has to fix coming EAS and inform about it radio installation piping there trigger signal. The array is fixed around Tien - Shan Mountain Scientific Station situated 3340 m high above see level (N, E)
The basic design principles.
The basis of the trigger array topology is the principle of three-fold signal coincidences from a set of detectors placed in the vertexes of a triangle. The whole system was build as an aggregate of such triangles. The common trigger signal is the logical OR sum of signals, generated independently by elementary triangle parts.
For the EAS particles detection in trigger array are used the SI5G type self-quenching ionization counters which permit to have a high amplitude signal at relativistic charged particles and high energy gamma quanta passage. The counters are tolerant to sharp changes of weather conditions. The registration efficiency of SI5G counters for relativistic electrons is high ( 80%). For gamma quanta it is much lower and depend on quanta energy. The detailed calibration measurements of SI5G counter efficiency for registration of gamma quanta in our conditions were carried out in [18]. The characteristic efficiency is of the order of 1%. Note, that it could be noticeably increased due to photoelectrons emitted from the aluminum walls of the counter box.
The counters are placed inside the boxes made of a 2 mm thick aluminum, which assures a proper shielding from electromagnetic interference. Each detector box contains 18–20 counters. The sensitive area of each SI5G counter being 0.033 m2, the total area of a detector box is around 0.6 . The detector is placed in a special little housing construction [15].
Pulse signals from the all distant detector points are transmitted to the data collection centers through the screened electrical cables. To avoid the damage of semiconductor electronics in the moment of lightning discharge, the cables are conjugated both with the detector and with registering apparatus throughout the vacuum tube based circuits (see [15],[18]).
Layout of the shower trigger array.
Current status of the shower trigger array is shown in Fig. 1. The array consists of two independent subsystems marked with Roman numerals on the figure; each subsystem, in its turn, — of a set of elementary triangles.
As it is seen from Fig. 1, the total area being covered with trigger array’s perimeter exceeds 0.1 square kilometer.
The size of the elementary detector triangles was determined by such a way to achieve the rate of triple coincidences about one per 10 seconds. Preliminary measurements have shown that our first triangle ABC having the edge sizes 65 x 75 x 65 m3 satisfy this requirement. This triangle was selected as a basic for the trigger array constructing. Fig. 1(down) represents on a large scale the mutual location of detector points in the trigger subsystems. The numbers shown near the edges of elementary triangles mean their length in meters.
Trigger data requisition.
The shower trigger array (so as the whole ”thunderstorm” detector system) has several data registration centers connected with each other and with the trigger detector subsystems by the means of cable lines. Topology of the data transfer cables is shown in Fig. 1.
One of the registration centers — the main center — has a cable connection also with the system of radio emission registration; it is the same place where the common shower trigger signal is elaborated from coincidence signals of separate elementary triangles. The common trigger signal is transmitted to the radio registration system through the special cable; in the moment of its appearance information about the coincidence type (namely, identifiers of the all detector points whose pulses were coinciding with the trigger) is written by a registration computer. Later these data are used to estimate roughly the size of a registered shower.
All the detector points of subsystem I (it is also denoted as CENTER in Fig. 1) have a direct connection with the main registration point and their pulses are transmitted to that point immediately. This circumstance permits to analyze the trigger coincidence type in particularly and to define precisely the intensity of ABC, BCE, CDE and DEF triggers coming from the CENTER trigger subsystem.
The signals of the subsystem II are analyzed in the peripheral registration point and just the ready coincidence pulses from its basic triangles G and H are transmitted to the main center (see Fig. 1).
In the main registration center any combination of the ABC, BCE, CDE, DEF, G, H signals is used to generate a common trigger pulse for radio emission registration system. The trigger signal is formed as a coincidence of signals within s duration from every three modulus connected in a triangle (ABC for example). That is why the trigger time accuracy of the array is s. Its stability was tested with a precision scintillation counter.
Calibration of the array during quiet time
During quiet time (not thunderstorm days) trigger array was carefully calibrated. It was established that in average the full array was registering a shower every 2.45 second (Fig. 2). Calibration was proved by measurements at triangle ABC done simultaneously by SIG5G and scintillation counter counters. A detailed numerical simulations was fulfilled, which demonstrated a reasonable agreement with observations.
It will be shown below that the work of a trigger system in thunderstorm period (which is of our interest) and in quiet days is significantly different. That is why the detailed description of a quiet time array calibration is omitted here. It will be presented in a separate paper.
3 Radio registration system
Receiving antennas
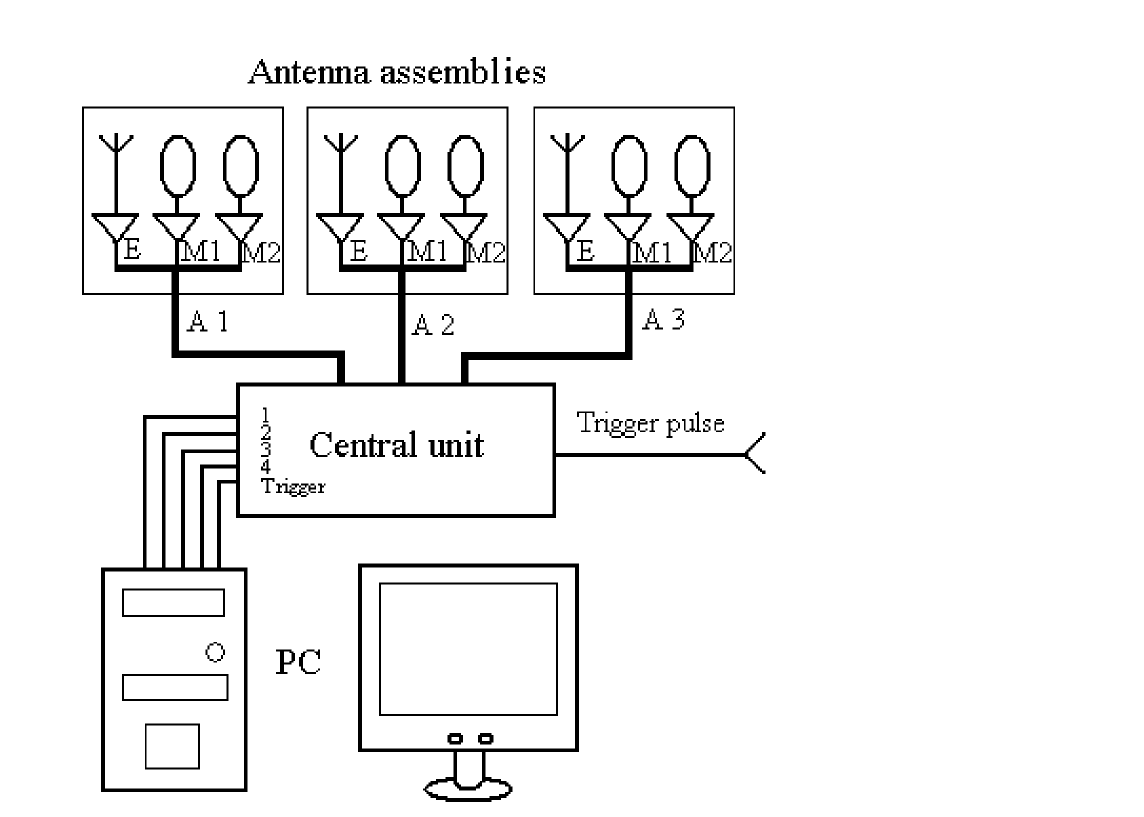
Radio measurements were carried out using specially designed installation (analogous to described in [22]) for short electromagnetic pulse observations in the frequency range from 0.1 to 30 MHz. This installation contains three spaced receiving antennas connected to the receiving apparatus (central unit). It allows signal arrival angle determination using correlation technique as well as waveform recording with high temporal resolution (16 ns). Its block diagram is shown in the Fig. 3.
Each receiving antenna of the installation (antenna assembly) actually consists of three individual antennas—two mutually perpendicular loop antennas for horizontal magnetic field measurements, and an End-Fed antenna to measure vertical electric field. All three antennas are active and include transistor amplifiers. This allowed to reduce the size of the assembly essentially and to reach uniform gain-frequency characteristics for all antennas in the wide frequency range.
Antenna for magnetic field measurements is a screened vertically sited rectangular loop. Loop and prime amplifier screening is needed to provide antenna sensitivity only to magnetic field, in other case its directional pattern becomes non-symmetric and frequency dependent. To equalize frequency-response of the loop it should be loaded by small resistance. Thus it is attached to the amplifier input through a step-up transformer made on long lines working as current transformer.
Electric antenna is an electrically short rod attached to the matched transistor amplifier. Its frequency-response equalization is achieved using principally capacitate character of the electrically short pole impedance as well as of transistor input impedance in the frequency range concerned. So, antenna–amplifier connection is a frequency independent divider with a ratio of antenna capacity to amplifier capacity as a transfer coefficient. Antenna capacity is increased by a plate tip at the end of the rod to increase the transfer coefficient. The increase of antenna capacity extends the antenna frequency range to lower frequencies also. Low boundary of the antenna frequency range is determined by the response time that is equal to the product of the antenna capacity and an input resistance of the amplifier. High input resistance of the amplifier leads to the growth of low frequency noise and assigns a risk of input transistor damage due to breakdown in strong electric fields. Therefore the input resistance was chosen in accordance with low boundary of the antenna frequency range (100 kHz approximately) to be about 1 MOhm. Breakdown protection of the amplifier is provided in three stages by high-voltage feed-through capacitor, gas-filled excess voltage preventer, and two parallel-opposition semiconductor diodes successively mounted at its input.
Data registration and storage
All three antenna amplifiers outputs from each antenna assembly are connected to the central unit by coaxial cables of equal lengths. Separate cables are used to provide antenna amplifiers power supply through appropriate bypasses. The central unit provides switching and selection up to 4 receiving elements (antennas) most suitable under specific conditions of the experiment. It serves also for preliminary analog data reduction, namely, reduction of the dynamic range of received signals to analog-to-digital converter (ADC) input range to prevent loss of information, and both high-pass and low-pass filtering to decrease low-frequency noise and to prevent spectral aliasing during data sampling.
After the central unit chosen signals are digitized by 4-channel radio receiver based on the personal computer (PC) using two synchronized two-channel ADC boards with sampling rate up to 60 MHz and 256 MB per board internal memory. High sampling rate leads to high data traffic that exceeds the ability of PC bus. Therefore pulse operation mode is needed with fast data storage into internal buffer area following by slower data transfer to the PC initiated by trigger pulse. ADC internal buffer memory allows to record up to 1 second sessions with maximum sampling rate of 60 MHz.
Radio receiver is operated in the pretrigger mode allowing signal recording before and after the trigger pulse. It can be triggered by external TTL signal as well as internally. In the last case triggering occurred when an input signal of one of the ADC channels exceeds a preset threshold.
The whole installation is supplied by UPS (Uninterruptible Power Supply) with enhanced up to several hours off-line operation capability (using external accumulator of higher capacity).
Antenna units (assemblies) are mounted at the Tien Shan Scientific Station at the altitude of about 3340 m above the sea level. They form direct angle triangle with perpendicular bases of about 78 m in the azimuth direction with elevation angle of (below the horizon) and about 74 m in the azimuth direction with elevation angle of (above the horizon).
An additional receiver operated at about 250 MHz is used as a separate facility to observe VHF radiation from the lightning. This receiver has filter bandwidth of 6 MHz, its output is detected with time constant of 100 s or 10 s providing correspondent time resolution. Its data acquisition system can also record EAS trigger pulses and static electric field using additional channels.
4 Results of measurements
Quiet time
Observations were carried out from July 19 till October 09, 2003 almost continuously. The radio receiving system was triggered by the EAS facility. Mean time interval between triggers was about 10 s in the beginning of observations decreasing later to 2.45 s due to upgrade of EAS facility and enhancement of its effective area (Fig. 2). Recording time was slightly above 100 s with 83.2 s pre-history. Data sampling rate of 60 MHz was used. Short radio pulses with few hundred nanosecond length correspondent to EAS’s were searched. Wide band radio interferometer in frequency range 0.1 – 30 MHz was used in our experiment. The electromagnetic noise in this frequency range is always rather strong. The radio noise spectrum has well defined maximum of the order or less than 0.2 MHz. This frequency is small compared with the frequency of registered signals ( MHz). That’s why only noise intensity is significant. It is shown in Fig. 4. Strong changes of noise with time is seen
We note, that the mean electric field amplitude value (in mv/m) approximately 1.5 times larger than the potential (in mv) at antenna rode, shown at the figure.
The general result of the observations is that the short radio pulses under quiet conditions are absent. An example of this type regular record in quiet time is shown at Fig. 5. One can see, that the trigger electric circuit signals lead to the noise amplification around trigger point 82.2.
Far thunderstorm
Few records were done for far thunderstorms in the autonomous mode with triggering from the output of one of the receivers as it was described in [22]. The record length was 750 ms with 500 ms pre-history. The same behavior of the radio signal during lightning initiation was observed as it was reported in [22] for lightning in the middle Russia far from mountains. Every lightning began with a short pulse and there were no other pulses during 0.5 sec before the first one.
Close thunderstorm
Unfortunately, during the period of the observations there were no strong thunderstorms directly above the station. Two thunderstorms on July 23 and September 11, 2003 occurred in its close vicinity with lightning at the line-of-site range. An example of records in thunderstorm conditions is given in Fig. 6. Short radio pulses are seen.
The noise amplification around trigger point in thunderstorm time become stronger
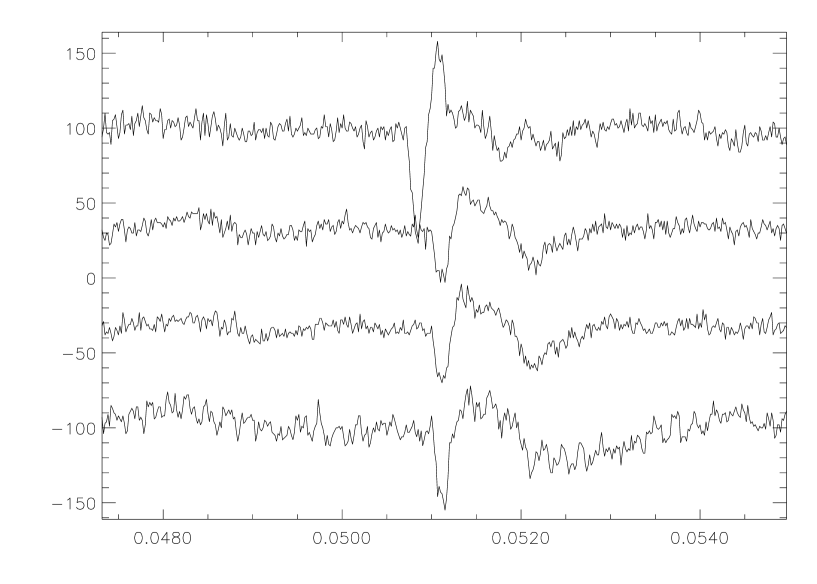
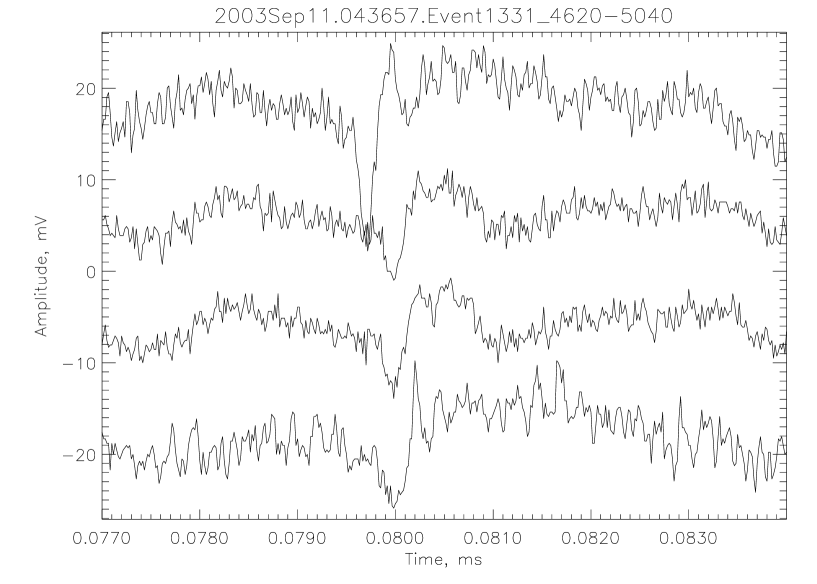
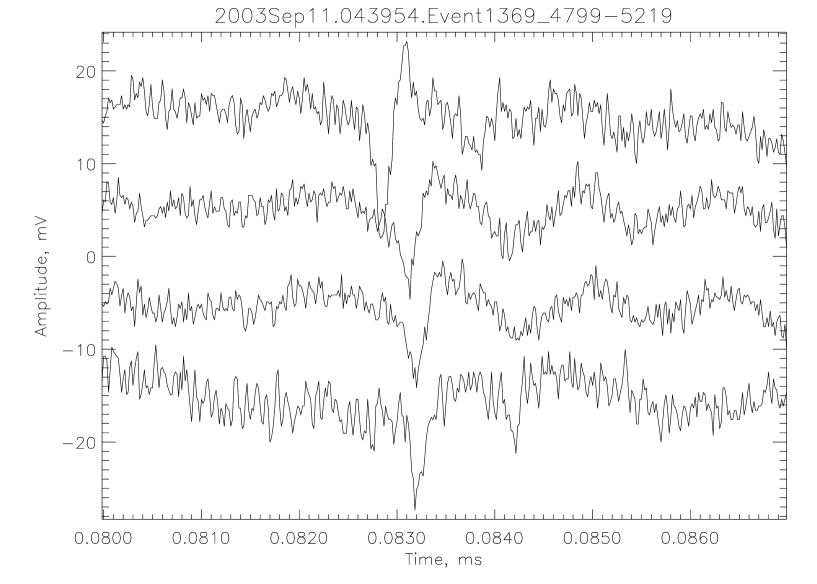
During thunderstorms a number of short electromagnetic pulses were recorded. An example of the record with such a pulse is presented in the Fig. 7. Four shown data records correspond to North, Central, Central, and East electric field antennas. Central antenna signal was recorded twice by different channels of different ADC boards to diminish possible errors in the determination of signal delays between antennas for more accurate arrival angle calculations.
Some records show two short pulses in the 100 s interval of the record. Besides, on July 23 there were a few records of strong electromagnetic signals of different structure possibly correspondent to radiation from electric power line.
The results of short electromagnetic pulse observations for thunderstorms on July 23 and September 11, 2003. are summarized in the Tables 1 and 2 respectively. The time and number of event, delay of the trigger relative to radio pulse, and radio pulse arrival angles are given in the Tables. The delay is positive if radio pulses were observed before trigger and negative while after it. Arrival angle is given as an inclination angle from the vertical and an azimuth from the North of the direction to the radio source.
The summary of the short pulse arrival angles is shown in the Figures 8 and 9 as inclination–azimuth plots for July 23 and September 11, 2003 thunderstorms respectively. It is clearly seen that in both cases most radio pulses came from the horizon direction. Note, that on September 11, 2003 there were several pulses which came from the direction near the vertical.
Histograms of the delays between radio pulse arrival and EAS triggers are shown in the Figures 10 and 11 for July 23 and September 11, 2003 thunderstorms respectively. Positive delays correspond to radio pulses arrived before trigger pulse. It is seen that delays are near equally distributed over the recorded interval.
The radio pulses generated during two observed thunderstorms have similar main features. Below we will analyze in details mainly the thunderstorm 11 September. The trigger array at this storm was wider: the radio pulses I and II in Fig 1 for September 11 were used and only I for July 23. The array calibration at September 11 was totally completed and the time interval between triggers was stable (Fig. 2). Only three records show two short pulses at 100 s interval and a few were observed after trigger.
5 Discussion
I. Radio pulses
RB - EAS combined action The process which is called RB - EAS combined action take place when high energy cosmic ray particle cross the thundercloud. The thundercloud is supposed to be in RB state, what means that the maximal electric field in thundercloud is close to : . Exactly these values of maximal electric field are observed in thundercloud at balloon experiments [9]. Large scale thundercloud electric field is directed close to vertical [10].
The secondary electrons of EAS are multiplied and accelerated in thundercloud due to RB process [3] - [7]. In the same time a very large number of thermal electrons is generated due to air moleculas ionization by high energy electrons [8]. The thermal electrons move in the air under the action of thunderstorm electric field forming an electric current pulse. The current pulse direction is determined by the direction of thundercloud electric field: it could be positive or negative depending on field direction (up or down).
The current pulse is unipolar. Its growth time is determined by RB process , where is characteristic scale of relativistic electron avalanche. At thundercloud heights not far from the Station (4 – 5) km m [1],[7]. The pulse decay is determined by thermal electrons disappearance due to triple collisions attachment in air. The characteristic time of triple attachment at heights 4 – 6 km ns [25],[26].
The form of radio pulse, generated by unipolar current pulse is bipolar [21]. Its characteristic time scales, determined by current pulse are 100 ns and ns. The full width of a pulse s Exactly these time scales determine the frequency range and the form of observed in our experiment radio pulses (Fig. 7).
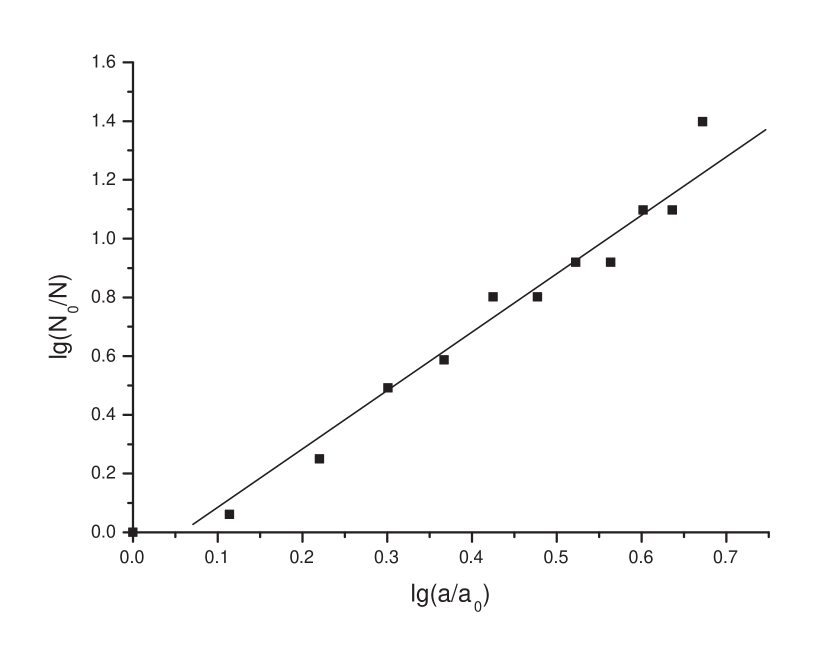
Amplitude distribution of the observed radio pulses is shown at Fig. 12 and Fig. 13. In [21] it was shown that the amplitude of radio signal is proportional to the number of secondary electrons and due to this is proportional to the energy of the cosmic ray particle creating EAS [27]. One can see from Fig. 13 that according to our observational data the integral number of signals in high amplitude range is falling down with amplitude as , . It is in reasonable agreement with the well known cosmic ray integral distribution (). That coincidence could be considered as direct indication that the observed radio pulses are generated by high energy particles crossing the thundercloud. Of course statistics of radio signals shown at Fig. 13 is very poor. We present the data to demonstrate only the new opportunities for cosmic ray studies using thunderstorm radio emission. From the integral distribution presented at Fig. 13 and its comparison with our numerical simulations one can deduce that the energies of cosmic ray particles generating observed pulses lays in the interval .
Electric current
The main part of radio pulses had the bipolar form (Fig. 7) and is generated by the unipolar current directed vertically. The pulses are coming mainly from horizontal direction (Figs. 8, 9). For the amplitude of radio pulse in this case it follows from [21]
| (1) |
Here is the distance between current pulse generated in thundercloud and trigger array. As it will be shown below km. From observations of pulses amplitudes presented in Fig. 12 one can deduce that the maximal value corresponding to cosmic ray particle energy eV is
| (2) |
| (3) |
In this expression current is given in Amperes, – the distance from trigger array to RB region in kilometers and – the energy of CR particle which generates EAS (in eV). Note that at the storm 23 July the radio pulses were in quite analogous amplitude range 20 – 40 mV/m but two pulses was extremely strong mV/m
Full number of thermal electrons
According to [8] the current is produced by the motion of thermal electrons ( eV) under the action of RB electric field kV/cm:
| (4) |
Here – is the electron charge, – full number of thermal electrons at the characteristic length of a pulse and – electron drift velocity:
| (5) |
where – electron mass, – electron collision frequency in air [25],[28]. For eV and (for thundercloud height 4 – 5 km)
| (6) |
| (7) |
Dissipated energy
Now let us take into account that for ionization of one air molecule (generation one free thermal electron) the average energy eV is needed [26]. From (7) it follows that the energy needed to generate the observed radio pulse is
| (8) |
Note that analogous energy goes to - quanta generation. Thus it follows from (8) that the energy dissipated in RB - EAS interaction region at least about 100 times higher than the energy of CR particle, generating EAS! That is why we call the effect ”Giant Burst”.
Of course, the dissipated energy comes from the interaction of the high energy secondary RB - EAS electrons with thunderstorm electric field. Gamma quanta, generating electrons and positrons can give support of the effect also. The detailed theoretical discussion of basic processes which determine the Giant Burst is given in the accompanying paper [20].
II Thunderstorm Extensive Atmospheric Showers (TEAS)
Two main problems
The trigger array (system I, II) worked stable during thunderstorm with the same counting frequency as in quiet days: one shower was registered by the joint system I-II every 2.45 sec (Fig. 2). At the same time, the cases, when radio pulses were observed, were singled out by two very significant peculiarities:
We note, that the previous detailed study of inclination angles of EAS generated by the same energy CR particles () at Tien Shan Scientific Station gave quite a contrary statements. For example according to [23] the probability of inclination angles deviation from vertical direction is proportional to . It means that the pulses should be concentrated near zenith. Analogous result is obtained in [24]: the full number of EAS with was twice larger than for the :
| (9) |
From (9) it follows that the average angle density distribution for EAS with is fourteen times higher than for :
| (10) |
Thus for large angles the probability to observe EAS under quiet conditions is very low, practically close to zero.
2. The observed delay between a trigger array signal matching the EAS coming and the radio pulse arrival to radio antenna was large. EAS was usually late and the time delay was quasi-random distributed in the 5 – 80 timescale (Fig. 11,Table 2).
We note that time delay between a EAS and radio signals should be no more than trigger window , as both signals are propagating with the light velocity.
Thus observed during thunderstorm specific effects are in direct contradiction with the well established usual observations of EAS in quiet conditions.
Giant burst
The qualitative explanation of these effects could be given basing on the RB-EAS combined action analysis presented in the Part I of this Section. Analyzing the radio pulse production mechanism we have seen that when EAS pass the thundercloud under RB conditions fulfilled a large amount of energy is dissipated due to the combined action of thunderstorm electric field and cosmic ray secondaries. This energy lead to the production of a giant burst of electrons and -quanta. Electrons in their final thermal state generate the observed radio pulse [8],[21]. Gamma quanta determine both peculiarities observed in Thunderstorm Extensive Atmosphere Showers (TEAS).
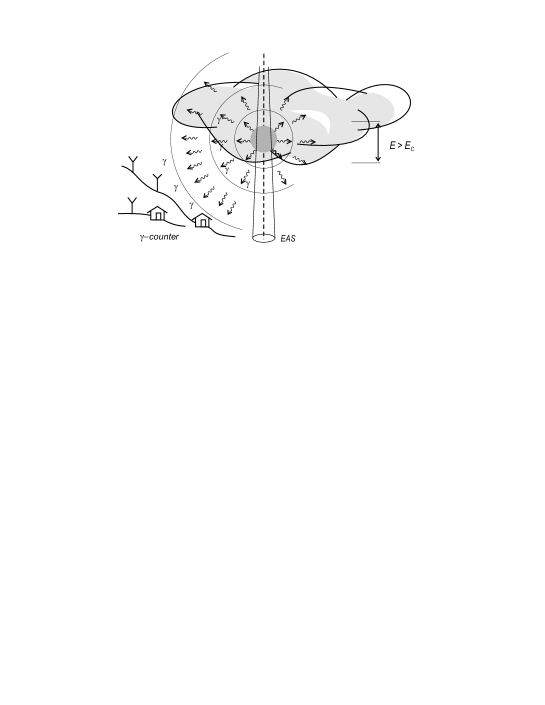
Qualitatively it is shown at Fig. 14. Giant number of high energy electrons and -quanta generated in RB-EAS interaction region form a cascade wich is moving in all directions. In the cascade due to Compton inelastic scattering and pair production on electrons and air nucleas the -quanta energy is rapidly diminishing. As soon as it become less than 0.5 Mev the motion of gamma quanta changes dramatically: the energy losses are small now and the main process become quasy-elastic Compton scattering. As a consequence the motion of -quanta with the energies is diffusive (below 20 keV photo-ionization losses dominates). The diffusion is not a straightforward motion – it lead to the time delay :
| (11) |
Here R is the distance -quanta passed by diffusion, – mean free path of -quanta determined by Thomson scattering. In air , where – Thomson crossection, and – average number of electrons and number density in air molecula. It follows from (10) that for the time dealy is .
The proposed model explains both main peculiarities of TEAS:
-
1.
According the scheme at Fig. 14 the trigger array could see the pulses mainly at large inclination angles. The direct EAS could come to trigger array rarely.
- 2.
-
3.
Analysis shows that we registered not EAS itself but a gumma burts generated by RB-EAS process. That is why the energy of the primary cosmic ray particle could be larger than it was supposed previously.
More detailed theoretical analysis of the process is presented in the accompanying paper [20].
Direct observations of EAS
In two events the time delay between trigger and radio signal is small enough: (). It lays inside the trigger array accuracy (). These events shown in Fig. 15 could be considered as the direct simultaneous observation of radio pulses and EAS. We see that the pulse records are practically the same as in usual case with time delay. The inclination angles for both events are large , what means practically the horizontal motion of CR particle.
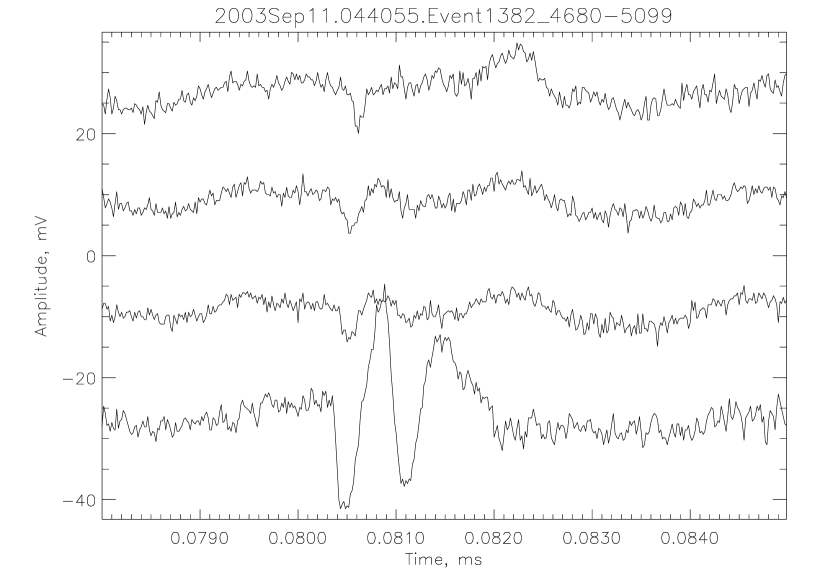
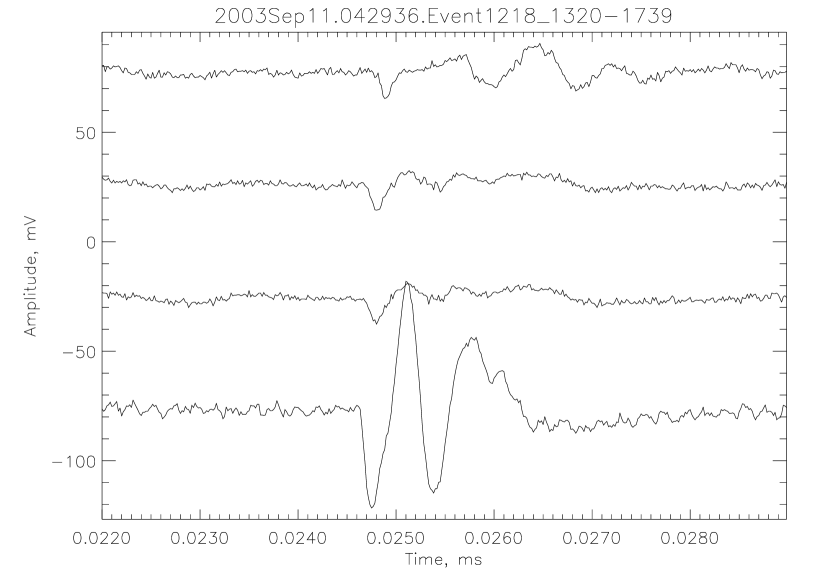
Near zenith direction
From the data presented in Fig. 9, Table 2 one can see that nine pulses are singled out – they are directed close to zenith: inclination angles from to . They all are peculiar pulses being wider and having an unusual structure shown in Fig. 16. The radio pulses looks generated by double unipolar current separated in time at 0.5 s or about 50 – 100 m in space. Note that one of the pulses presented in Fig. 16 is a direct EAS pulse triggered at time delay 2.7 s which lies inside the 5s trigger window. Again no difference is seen between records of direct and delayed pulses.
We have no clear understanding of the origin of these specific pulses. The following preliminary explanation could be proposed. The current in RB - EAS interference region has two components: the current of thermal electrons and current of relativistic runaway electrons. The thermal current is stronger and generates a wide spread radio emission. The relativistic current is weaker and its radio emission is concentrated near EAS direction [33]. It is possible that in the close to zenith case we observe the emission generated by both current pulses what can explain its bipolar form. This speculation needs of course much more detailed theoretical and experimental study.
Lightning initiation
In previous work [22] the lightning initiation process was studied using analogous radio technique. The first lightning radio pulse was singled out and observed for large lightning number. It was established that the radio pulse is generated by unipolar current pulse and its form, width and amplitude agree with the predictions of RB - EAS interaction theory [21]. Thus it was supposed that the lightning is initiated by combined action of RB - EAS generated by primary cosmic ray particles with energy eV. In the present work the radio pulses and EAS are observed directly. The radio pulses have quite analogous form and frequency range as in [22]. The difference in amplitudes is explained by smaller energy of cosmic ray primary particle ( eV). Note that the observations of lightning first pulses from the faraway thunderstorm at Tien Shan gave the results quite analogous obtained in [22].
Thus one can state that the observations presented in the paper confirm the lightning RB - EAS initiation mechanism proposed in [21], [22].
Note that the radio pulses associated with extensive atmospheric showers were observed in a number of previous works [29] - [32]. The width and amplitude of observed pulses were quite different – from s [30] up to 100 s [32], depending on conditions and technique used. In [31], [32] the connection between the existence of radio pulses and weather conditions (clouds, thunderstorms) was indicated.
6 Conclusions
In conclusion we formulate briefly main results of the experiments described in the paper:
-
1.
At Tien Shan Mountain Scientific Station a new EAS - Radio installation is constructed. The installation consists of a wide spread EAS trigger array and a high time resolution radio interferometer what allows to study the EAS and radio pulses emission simultaneously.
-
2.
The absence of simultaneous EAS and radio pulses in a quiet (non-thunderstorm) atmosphere is established.
-
3.
During two thunderstorms 150 simultaneous EAS and radio pulses were observed. The distribution of radio pulses on amplitude, form, inclination and azimuth direction was studied. The following main peculiarities are established:
-
(a)
The radio pulses came mainly from the horizontal direction.
-
(b)
There is a significant random time delay (up to 100 s) between trigger signal and radio pulse.
-
(a)
-
4.
The analysis of the obtained experimental data allows to establish the existence of a new phenomena – giant electron-gamma bursts generated by high-energy cosmic ray particles in thunderclouds. The burst energy could be times larger than the particle energy due to the RB-EAS interaction.
-
5.
The burst generated by high energy cosmic ray particles eV can serve for lightning initiation. That confirms the lightning initiation mechanism studied in [22].
The current generated in thunderclouds due to RB-EAS interaction is proportional to the cosmic ray particle energy . It means that the radio pulse amplitude for eV should be extremely high. The pulse has definite characteristics quite analogous to the established in the present work. It could be observed from the immense distances – 1000 km and even more.
The further simultaneous observations of EAS together with giant bursts of X rays and radio pulses can serve for the development of a new effective method for the radio detection of high energy cosmic ray particles.
Acknowledgements
The authors are grateful to Prof V.L.Ginzburg, Prof. E.L.Feinberg and Dr. H.Carlson foe useful discussions. The work was supported by EOARD- ISTC grant #2236, ISTC grant #1480, by the President of Russian Federation Grant for Leading Scientific Schools Support and by the Russian Academy Fundamental Research Program ”Atmosphere Physics: Electric Processes, Radio Physics Methods”.
References
- [1] A.V.Gurevich, G.M.Milikh, R.Roussel-Dupre Phys. Lett. A 165, (1992) 463.
- [2] C.T.R.Wilson Proc. Cambridge Philos.Soc. bf 22, (1924) 34.
- [3] R.Roussel-Dupre, et al Phys.Rev. E 49 (1994) 2257.
- [4] N.G.Lehtinen, et al. Geophys. Res. Lett. 24 (1997) 2639.
- [5] L.P.Babich, et al. Phys.Lett.A 245, (1998) 460.
- [6] A.V.Gurevich, et al. Phys. Lett. A 275 (2001) 101.
- [7] A.V.Gurevich, K.P.Zybin Physics Uspekhi 44, 11 (2001) 1119.
- [8] A.V.Gurevich, Yu.V.Medvedev, K.P.Zybin Phys. Lett. A 321 (2004) 179.
- [9] T.Marshall et al. J. Geophys. Res. 100 (1996) 7097.
- [10] D. MacGorman, W.D.Rust The electrical nature of the storms, New York, Oxford Univ. Press (1998)
- [11] A.V.Gurevich, et al. Phys. Lett. A 282, 180, (2001)
- [12] J.R.Dwyer Geophys. Res. Lett. 30 (2003), 2055.
- [13] Mc Carthy, G.Parks Geophys.Res.Lett 12 (1985) 393.
- [14] K.B.Eack, et al. J.Gophys.Res. 101 (1996) 29637.
- [15] A.P.Chubenko, et al. Phys.Lett.A. 275 (2000) 90.
- [16] M.B.Brunetti, et al. Geophys. Res. Lett. A 309 (2000) 1599.
- [17] V.V. Alexeenko, et al. Phys. Lett. A 301 (2002) 299.
- [18] A.P.Chubenko, et al. Phys.Lett.A. 309(2003) 90.
- [19] T.Torii et al JGR 107 (2002) 4324
- [20] A.V.Gurevich, Yu.V. Medvedev and K.P.Zybin (2004) (to be published in arXiv:hep-ph).
- [21] A.V.Gurevich, et al. Phys. Lett A 301, (2002) 320.
- [22] A.V.Gurevich, et al. Phys. Lett. A 312 (2003) 228.
- [23] K.V.Barshakov, et al. Preprint FIAN #19 (1998).
- [24] V.S.Aseikin, et al. Proc FIAN v.19 (1979) 3.
- [25] A.V.Gurevich, N.D.Borisov, G.M.Milikh Physics of Microwave Discharges, Gordon and Breach, Amsterdam, 1997.
- [26] E.M.Bazelyan, Yu.P.Raizer, Lightning Physics and Lightning Protection, IOP, Bristol, 2000.
- [27] S.Z.Belenkij Avalanche Processesin Cosmic Rays, OGIZ, Moscow (1948).
- [28] A.V.Gurevich Nonlinear Phenomena in the Ionosphere, Springer, New-York, 1978.
- [29] J.V.Jelly, et al. Nature, 205 (1965) 327.
- [30] K.Suga, et al. 19 ICRC 7 (1985) 268.
- [31] M.Kusukuse, et al. 22 ICRC 4 (1991) 359.
- [32] A.V.Aleksandrov, et al. 20 ICRC 6 (1987) 132.
- [33] R.Roussel - Dupre, A.V.Gurevich JGR 101 (1996) 2297
| Time | Event # | Trigger delay | Inclination | Azimuth |
|---|---|---|---|---|
| 17:51:32 | 2910 | 9.7 | 86 | 35 |
| 17:57:33 | 2942 | 10.3 | 82 | 294 |
| 17:57:50 | 2946 | 9.8 | 79 | 354 |
| 17:59:14 | 2954 | 52.1 | 84 | 296 |
| 44.5 | 81 | 297 | ||
| 18:02:06 | 2971 | 33.6 | 81 | 303 |
| 18:02:20 | 2972 | 77.3 | 84 | 305 |
| 18:02:40 | 2973 | 34.1 | 74 | 296 |
| 18.5 | 86 | 295 | ||
| 18:17:34 | 3058 | 44.3 | 86 | 306 |
| 30.0 | 90 | 289 | ||
| 18:19:02 | 3067 | 17.8 | 93 | 303 |
| 18:19:50 | 3072 | 69.6 | 84 | 302 |
| 18:24:04 | 3099 | 23.6 | 80 | 286 |
| 18:27:18 | 3116 | 38.7 | 82 | 305 |
| 18:29:36 | 3126 | 74.1 | 84 | 306 |
| 18:30:08 | 3133 | 23.2 | 82 | 304 |
| 18:30:33 | 3137 | 82.9 | 84 | 49 |
| 22.5 | 80 | 50 | ||
| 18:35:49 | 3166 | 16.3 | 82 | 305 |
| 9.9 | 81 | 303 | ||
| 18:37:49 | 3172 | 64.6 | 84 | 302 |
| 42.0 | 92 | 303 | ||
| 18:40:13 | 3187 | 5.5 | 90 | 298 |
| 18:40:36 | 3191 | 56.9 | 60 | 300 |
| 18:40:55 | 3197 | 65.3 | 81 | 289 |
| 18:47:49 | 3239 | -11.8 | 89 | 304 |
| 18:51:31 | 3267 | 45.9 | 86 | 320 |
| 18:52:04 | 3270 | 71.4 | 80 | 294 |
| 64.3 | 70 | 298 | ||
| 18:53:29 | 3279 | 73.3 | 87 | 298 |
| 49.3 | 86 | 288 | ||
| 18:53:31 | 3280 | 61.3 | 83 | 293 |
| 47.7 | 92 | 303 | ||
| 18:57:12 | 3300 | 38.6 | 47 | 60 |
| 18:57:36 | 3303 | 62.6 | 84 | 307 |
| 18:58:24 | 3312 | 32.4 | 82 | 294 |
| 5.3 | 89 | 298 | ||
| 18:59:39 | 3323 | 80.6 | 82 | 294 |
| 48.5 | 80 | 281 | ||
| 26.3 | 76 | 275 | ||
| 19:00:46 | 3328 | 1.3 | 86 | 304 |
| 19:03:52 | 3340 | 48.2 | 86 | 288 |
| -14.6 | 81 | 294 | ||
| 19:05:30 | 3350 | 72.4 | 92 | 306 |
| 19:06:07 | 3354 | 8.5 | 93 | 303 |
| -0.1 | 81 | 306 | ||
| 19:08:00 | 3364 | 35.4 | 86 | 298 |
| 19:09:00 | 3374 | 27.2 | 82 | 305 |
| 19:10:24 | 3380 | -11.4 | 87 | 290 |
| 19:10:25 | 3381 | 6.2 | 84 | 305 |
| 19:11:46 | 3386 | 57.0 | 84 | 307 |
| 19:12:13 | 3388 | 42.8 | 89 | 306 |
| 19:12:55 | 3389 | 82.7 | 85 | 306 |
| 79.6 | 90 | 300 | ||
| 19:13:02 | 3391 | 68.1 | 81 | 314 |
| 19:15:23 | 3405 | 24.3 | 82 | 304 |
| 19:16:10 | 3410 | -6.6 | 88 | 292 |
| -14.9 | 81 | 286 | ||
| 19:24:28 | 3466 | 64.3 | 82 | 299 |
| 19:25:05 | 3471 | -11.5 | 92 | 306 |
| 19:25:41 | 3476 | 67.5 | 89 | 298 |
| 19:30:44 | 3512 | 50.6 | 91 | 306 |
| 19:31:31 | 3521 | 35.0 | 53 | 14 |
| -6.3 | 57 | 20 | ||
| 19:32:58 | 3540 | 28.3 | 90 | 298 |
| 19:34:38 | 3557 | 62.5 | 85 | 293 |
| -12.6 | 80 | 297 | ||
| 19:34:50 | 3559 | 8.4 | 77 | 280 |
| 19:35:21 | 3568 | 34.5 | 81 | 21 |
| 19:36:10 | 3578 | 4.4 | 88 | 303 |
| 19:37:19 | 3582 | 24.8 | 95 | 304 |
| 19:42:48 | 3623 | 61.7 | 72 | 3 |
| 2.8 | 84 | 1 | ||
| 19:56:09 | 3756 | -9.9 | 82 | 72 |
| -12.8 | 73 | 68 | ||
| 19:57:11 | 3766 | 11.6 | 75 | 125 |
| 19:58:23 | 3775 | 35.7 | 80 | 65 |
| 20:01:13 | 3800 | 5.0 | 73 | 309 |
| 20:05:20 | 3828 | 13.0 | 82 | 299 |
| 20:15:49 | 3897 | 25.7 | 73 | 56 |
| 20:15:56 | 3898 | 47.6 | 83 | 288 |
| 24.9 | 89 | 304 | ||
| 20:16:06 | 3899 | 41.9 | 72 | 72 |
| 20:22:48 | 3946 | 51.0 | 81 | 306 |
| 13.3 | 89 | 304 | ||
| 20:24:01 | 3953 | 8.3 | 87 | 293 |
| -0.9 | 91 | 306 | ||
| 20:30:37 | 4002 | 26.3 | 83 | 306 |
| 16.6 | 89 | 309 | ||
| 20:32:37 | 4010 | 47.9 | 69 | 344 |
| 45.4 | 69 | 346 | ||
| 20:33:13 | 4016 | 5.9 | 84 | 6 |
| 20:33:39 | 4019 | 23.4 | 84 | 299 |
| 20:37:10 | 4052 | 55.0 | 86 | 305 |
| 31.8 | 82 | 305 | ||
| 20:41:34 | 4074 | 44.0 | 82 | 294 |
| 20:43:14 | 4087 | 19.2 | 91 | 287 |
| Time | Event # | Trigger delay | Inclination | Azimuth |
|---|---|---|---|---|
| 04:26:32 | 1180 | 75.0 | 69 | 14 |
| 04:28:11 | 1199 | 72.0 | 5 | 117 |
| 50.6 | 9 | 140 | ||
| 04:28:58 | 1210 | 54.2 | 81 | 347 |
| 04:29:03 | 1212 | 57.6 | 81 | 356 |
| 04:29:13 | 1214 | 72.7 | 15 | 160 |
| 04:29:36 | 1218 | 58.4 | 14 | 128 |
| 04:30:08 | 1225 | 50.8 | 63 | 12 |
| 04:30:40 | 1233 | 30.1 | 67 | 12 |
| 04:32:12 | 1258 | 32.2 | 91 | 347 |
| 04:32:20 | 1261 | 40.2 | 62 | 1 |
| 04:33:23 | 1275 | 47.6 | 65 | 356 |
| 04:36:50 | 1327 | 55.0 | 12 | 159 |
| -11.6 | 18 | 154 | ||
| 04:36:57 | 1331 | 3.3 | 86 | 352 |
| 04:36:59 | 1332 | 60.1 | 55 | 11 |
| 04:38:44 | 1354 | 29.3 | 83 | 352 |
| 04:39:54 | 1369 | 0.2 | 87 | 345 |
| 04:39:58 | 1370 | 14.9 | 56 | 5 |
| 04:40:39 | 1379 | 49.6 | 89 | 343 |
| 04:40:53 | 1381 | 20.3 | 5 | 117 |
| 04:40:55 | 1382 | 2.7 | 13 | 149 |
| 04:42:17 | 1405 | 30.3 | 66 | 9 |
| 04:42:34 | 1410 | 27.8 | 61 | 7 |
| 04:43:19 | 1425 | 38.2 | 86 | 352 |
| 04:43:30 | 1428 | 70.8 | 83 | 340 |
| 04:44:10 | 1440 | 35.7 | 69 | 356 |
| 04:14:26 | 1442 | 49.4 | 83 | 340 |
| 04:44:55 | 1447 | 53.1 | 87 | 345 |
| 04:45:06 | 1450 | 22.6 | 80 | 349 |
| 04:45:37 | 1456 | 60.3 | 92 | 345 |
| 04:45:50 | 1458 | 19.3 | 15 | 152 |
| 04:46:02 | 1462 | -9.6 | 89 | 343 |
| 04:46:07 | 1463 | 20.5 | 92 | 345 |
| 4.5 | 59 | 4 | ||
| 04:46:51 | 1475 | 17.2 | 91 | 350 |
| 04:46:54 | 1477 | 48.6 | 89 | 24 |
| 04:47:07 | 1480 | 28.3 | 65 | 15 |
| 04:47:16 | 1483 | 36.6 | 80 | 337 |
| 04:47:56 | 1489 | -5.9 | 84 | 345 |
| 04:47:57 | 1490 | -1.2 | 89 | 343 |
| 04:47:58 | 1491 | 16.3 | 80 | 340 |
| 04:48:31 | 1501 | 54.5 | 61 | 343 |
| 04:48:54 | 1508 | 26.7 | 87 | 331 |
| 04:48:56 | 1509 | 66.0 | 84 | 335 |
| 04:49:13 | 1514 | 70.5 | 89 | 343 |
| 04:49:15 | 1515 | 18.4 | 92 | 345 |
| 04:49:16 | 1516 | 82.4 | 80 | 347 |
| 04:49:40 | 1520 | 24.6 | 59 | 2 |
| 04:51:13 | 1542 | 59.8 | 91 | 340 |
| 04:51:51 | 1557 | 45.8 | 91 | 340 |
| 04:52:06 | 1560 | 26.3 | 79 | 342 |
| 04:53:31 | 1583 | 62.6 | 80 | 340 |
| 04:53:59 | 1598 | 40.6 | 56 | 5 |
| 04:54:26 | 1606 | 35.6 | 63 | 12 |
| 04:57:47 | 1657 | 54.0 | 92 | 345 |
| 04:58:05 | 1663 | 52.3 | 91 | 350 |
| 05:08:18 | 1849 | 17.9 | 79 | 342 |
| 05:21:47 | 2079 | 28.0 | 89 | 338 |

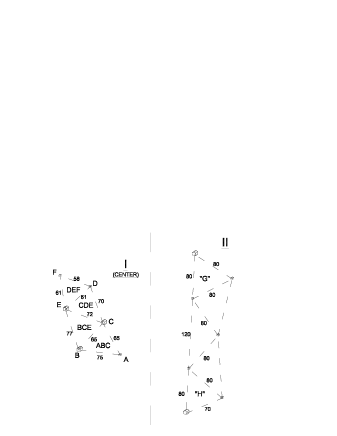
Down – layout of the separate trigger subsystems I-II. Numerals shown near the lines represent the length of corresponding triangle edges (measured in meters), the letters mark separate detector points and corresponding coincidence types.